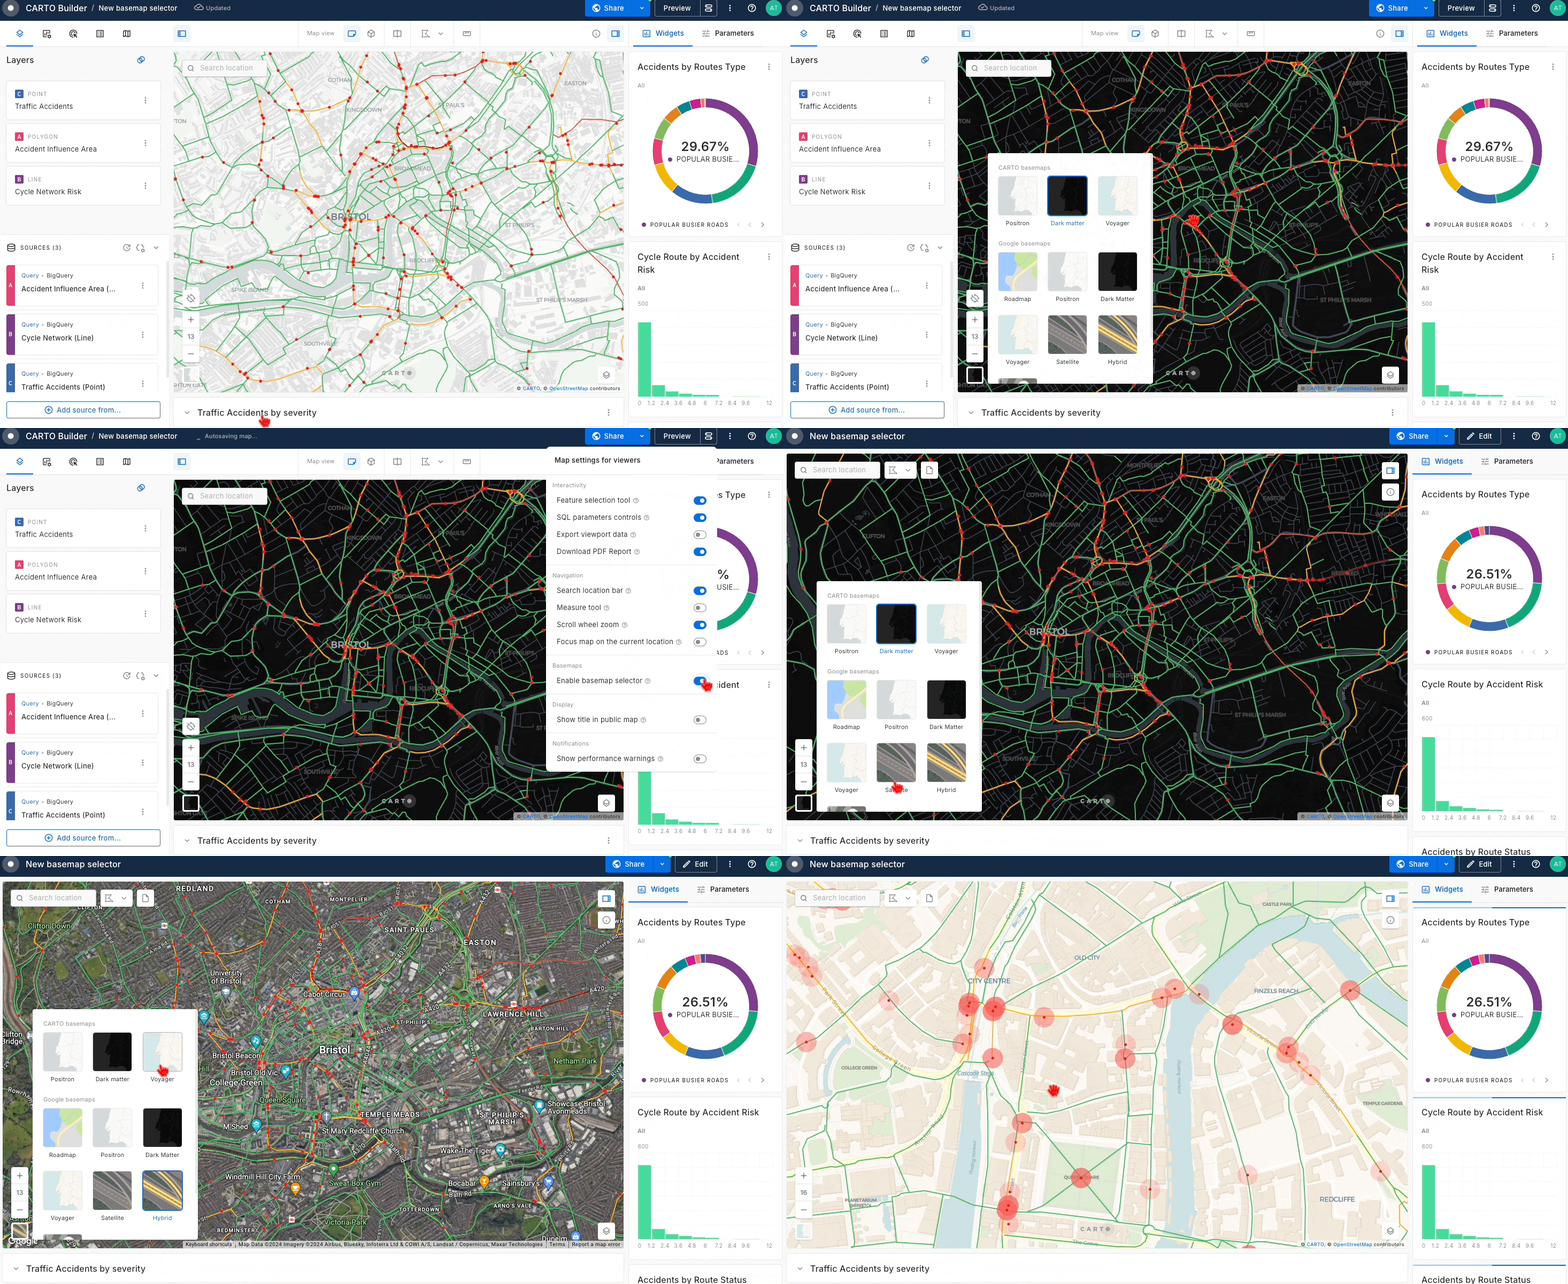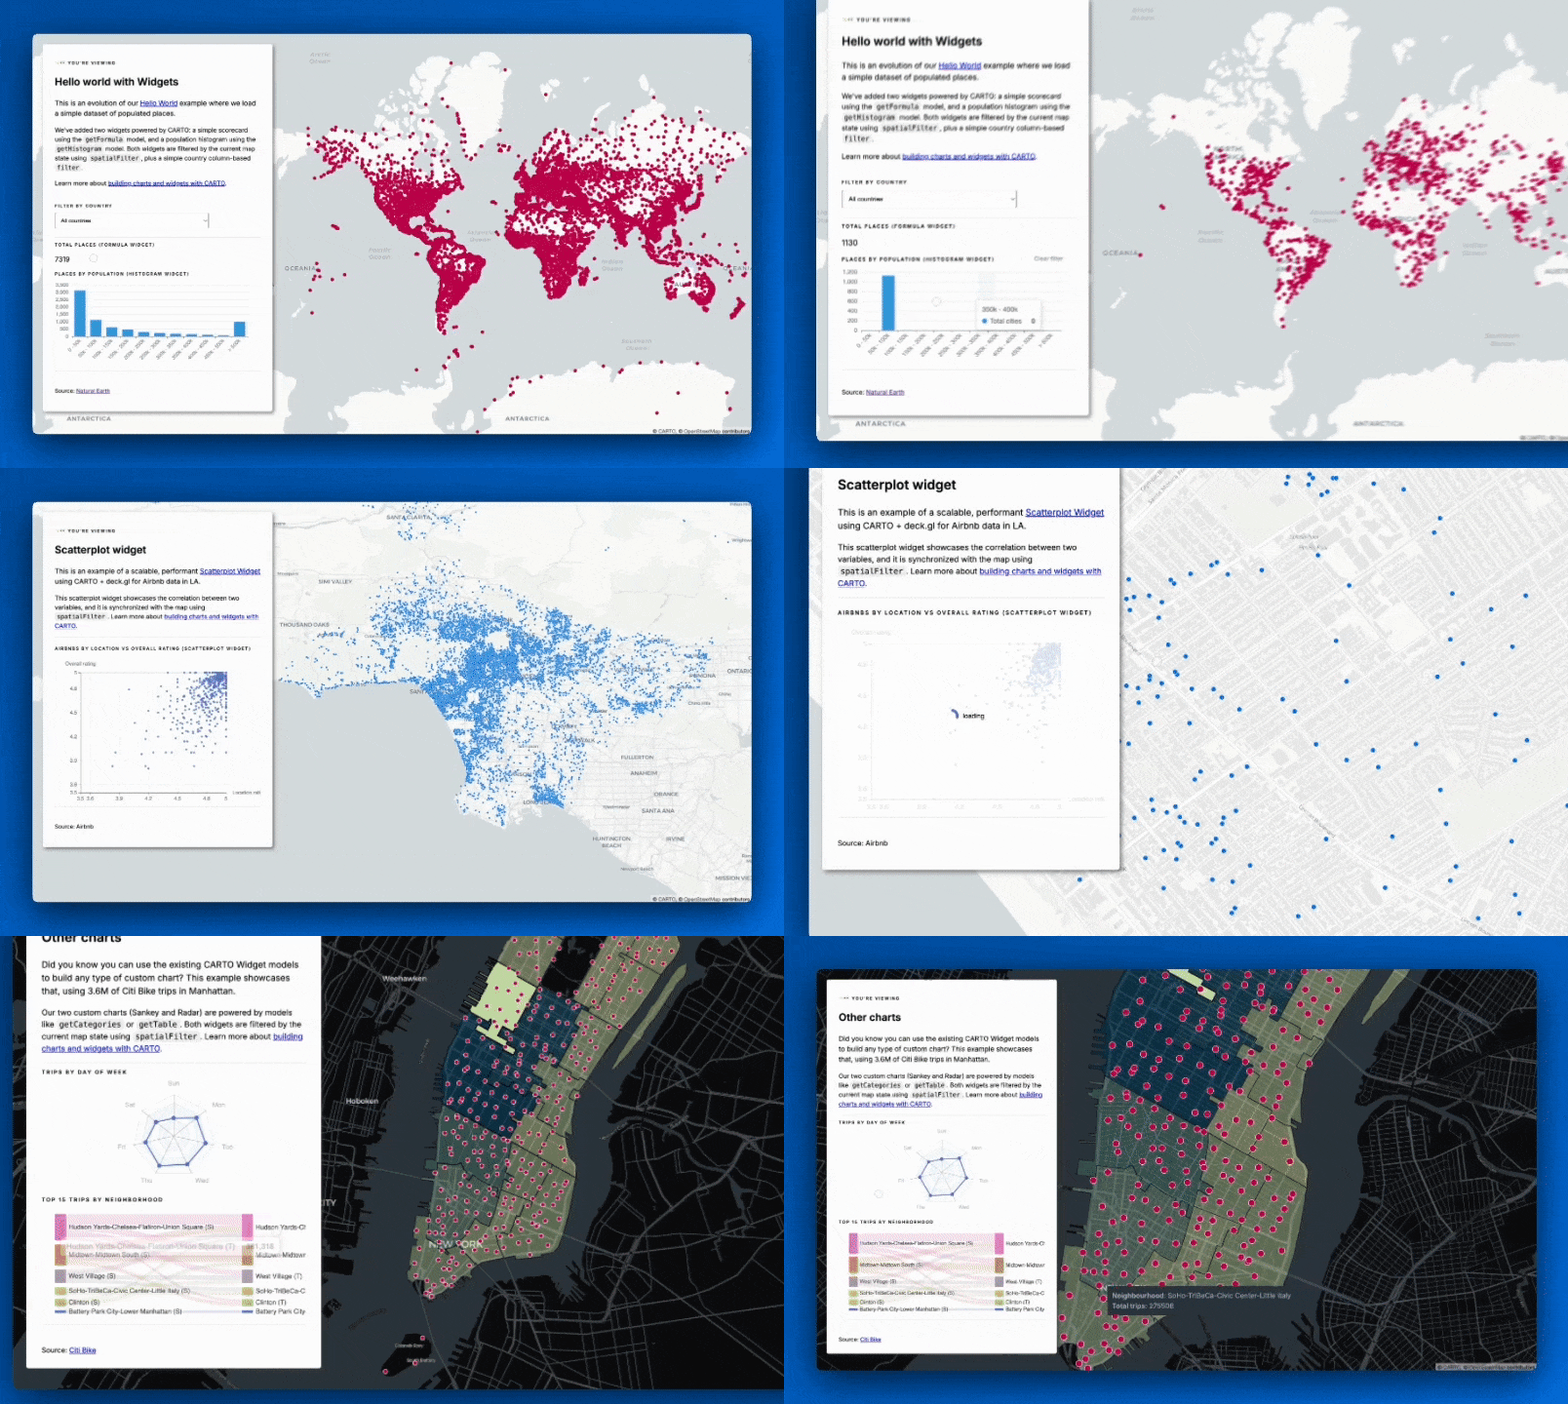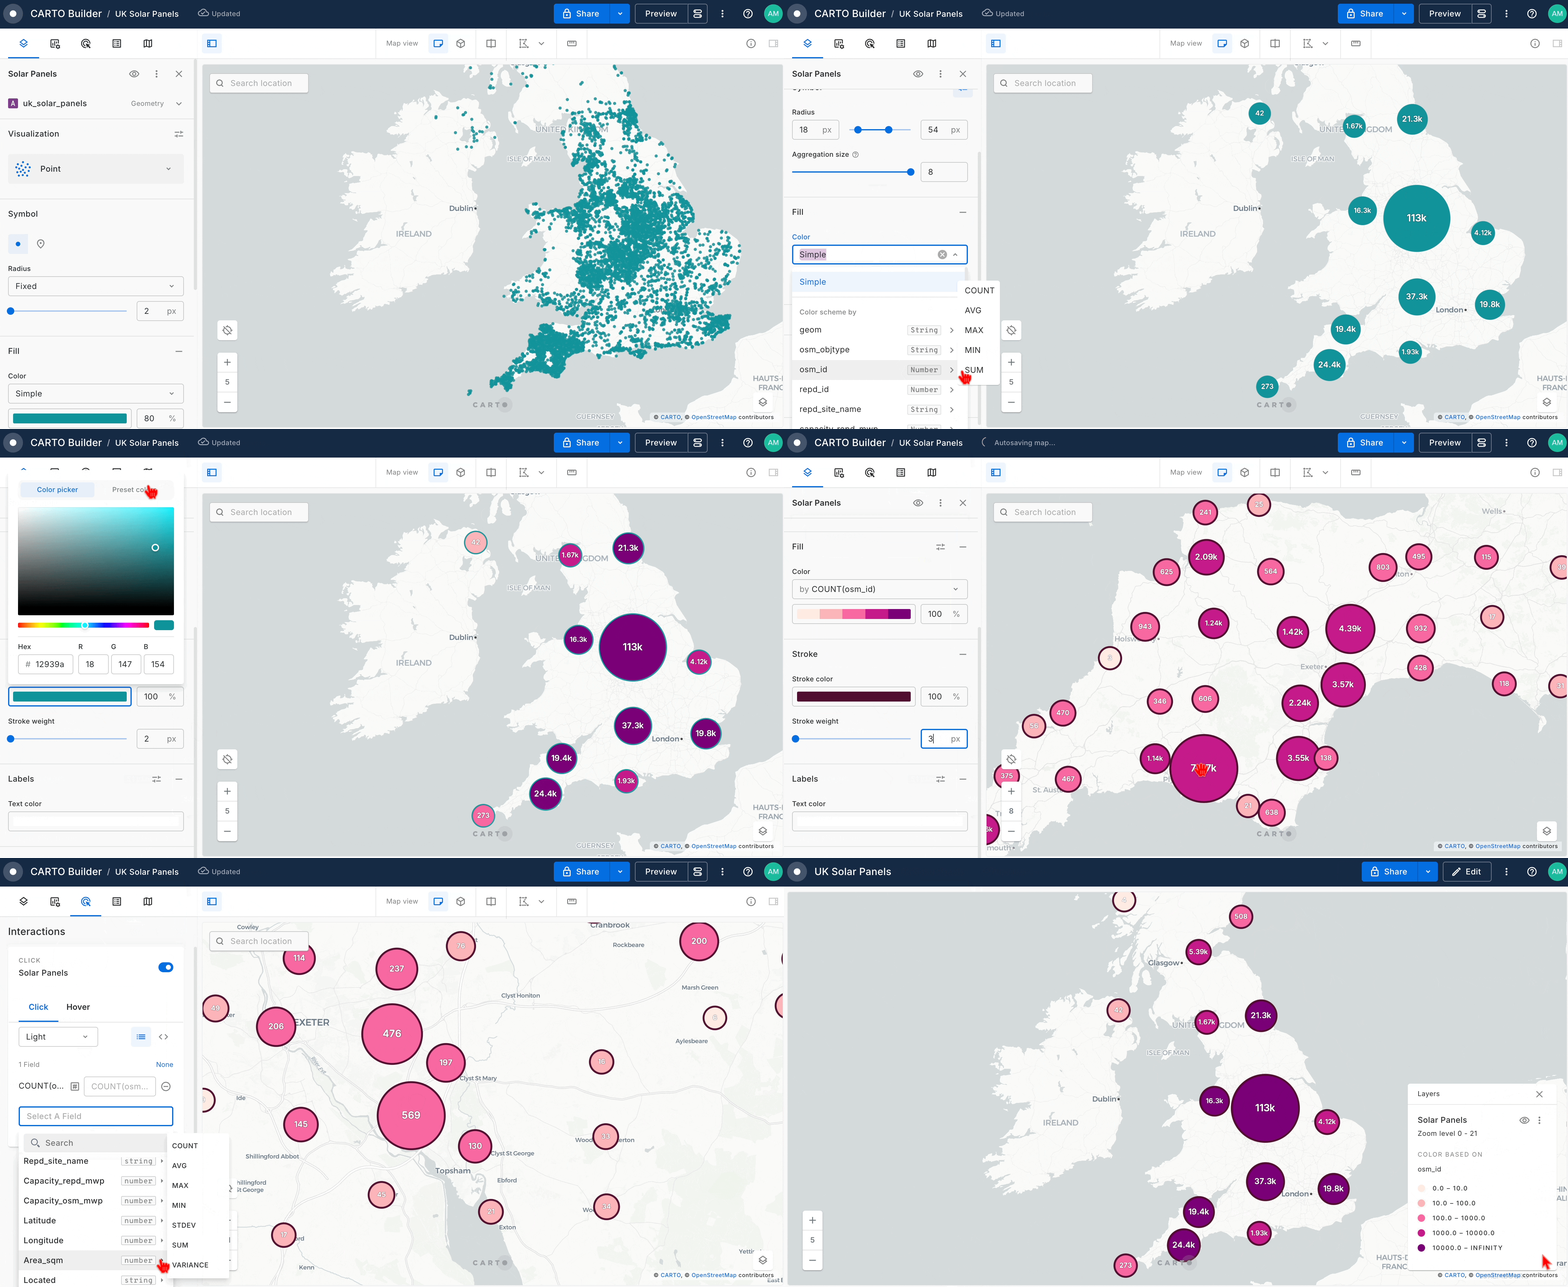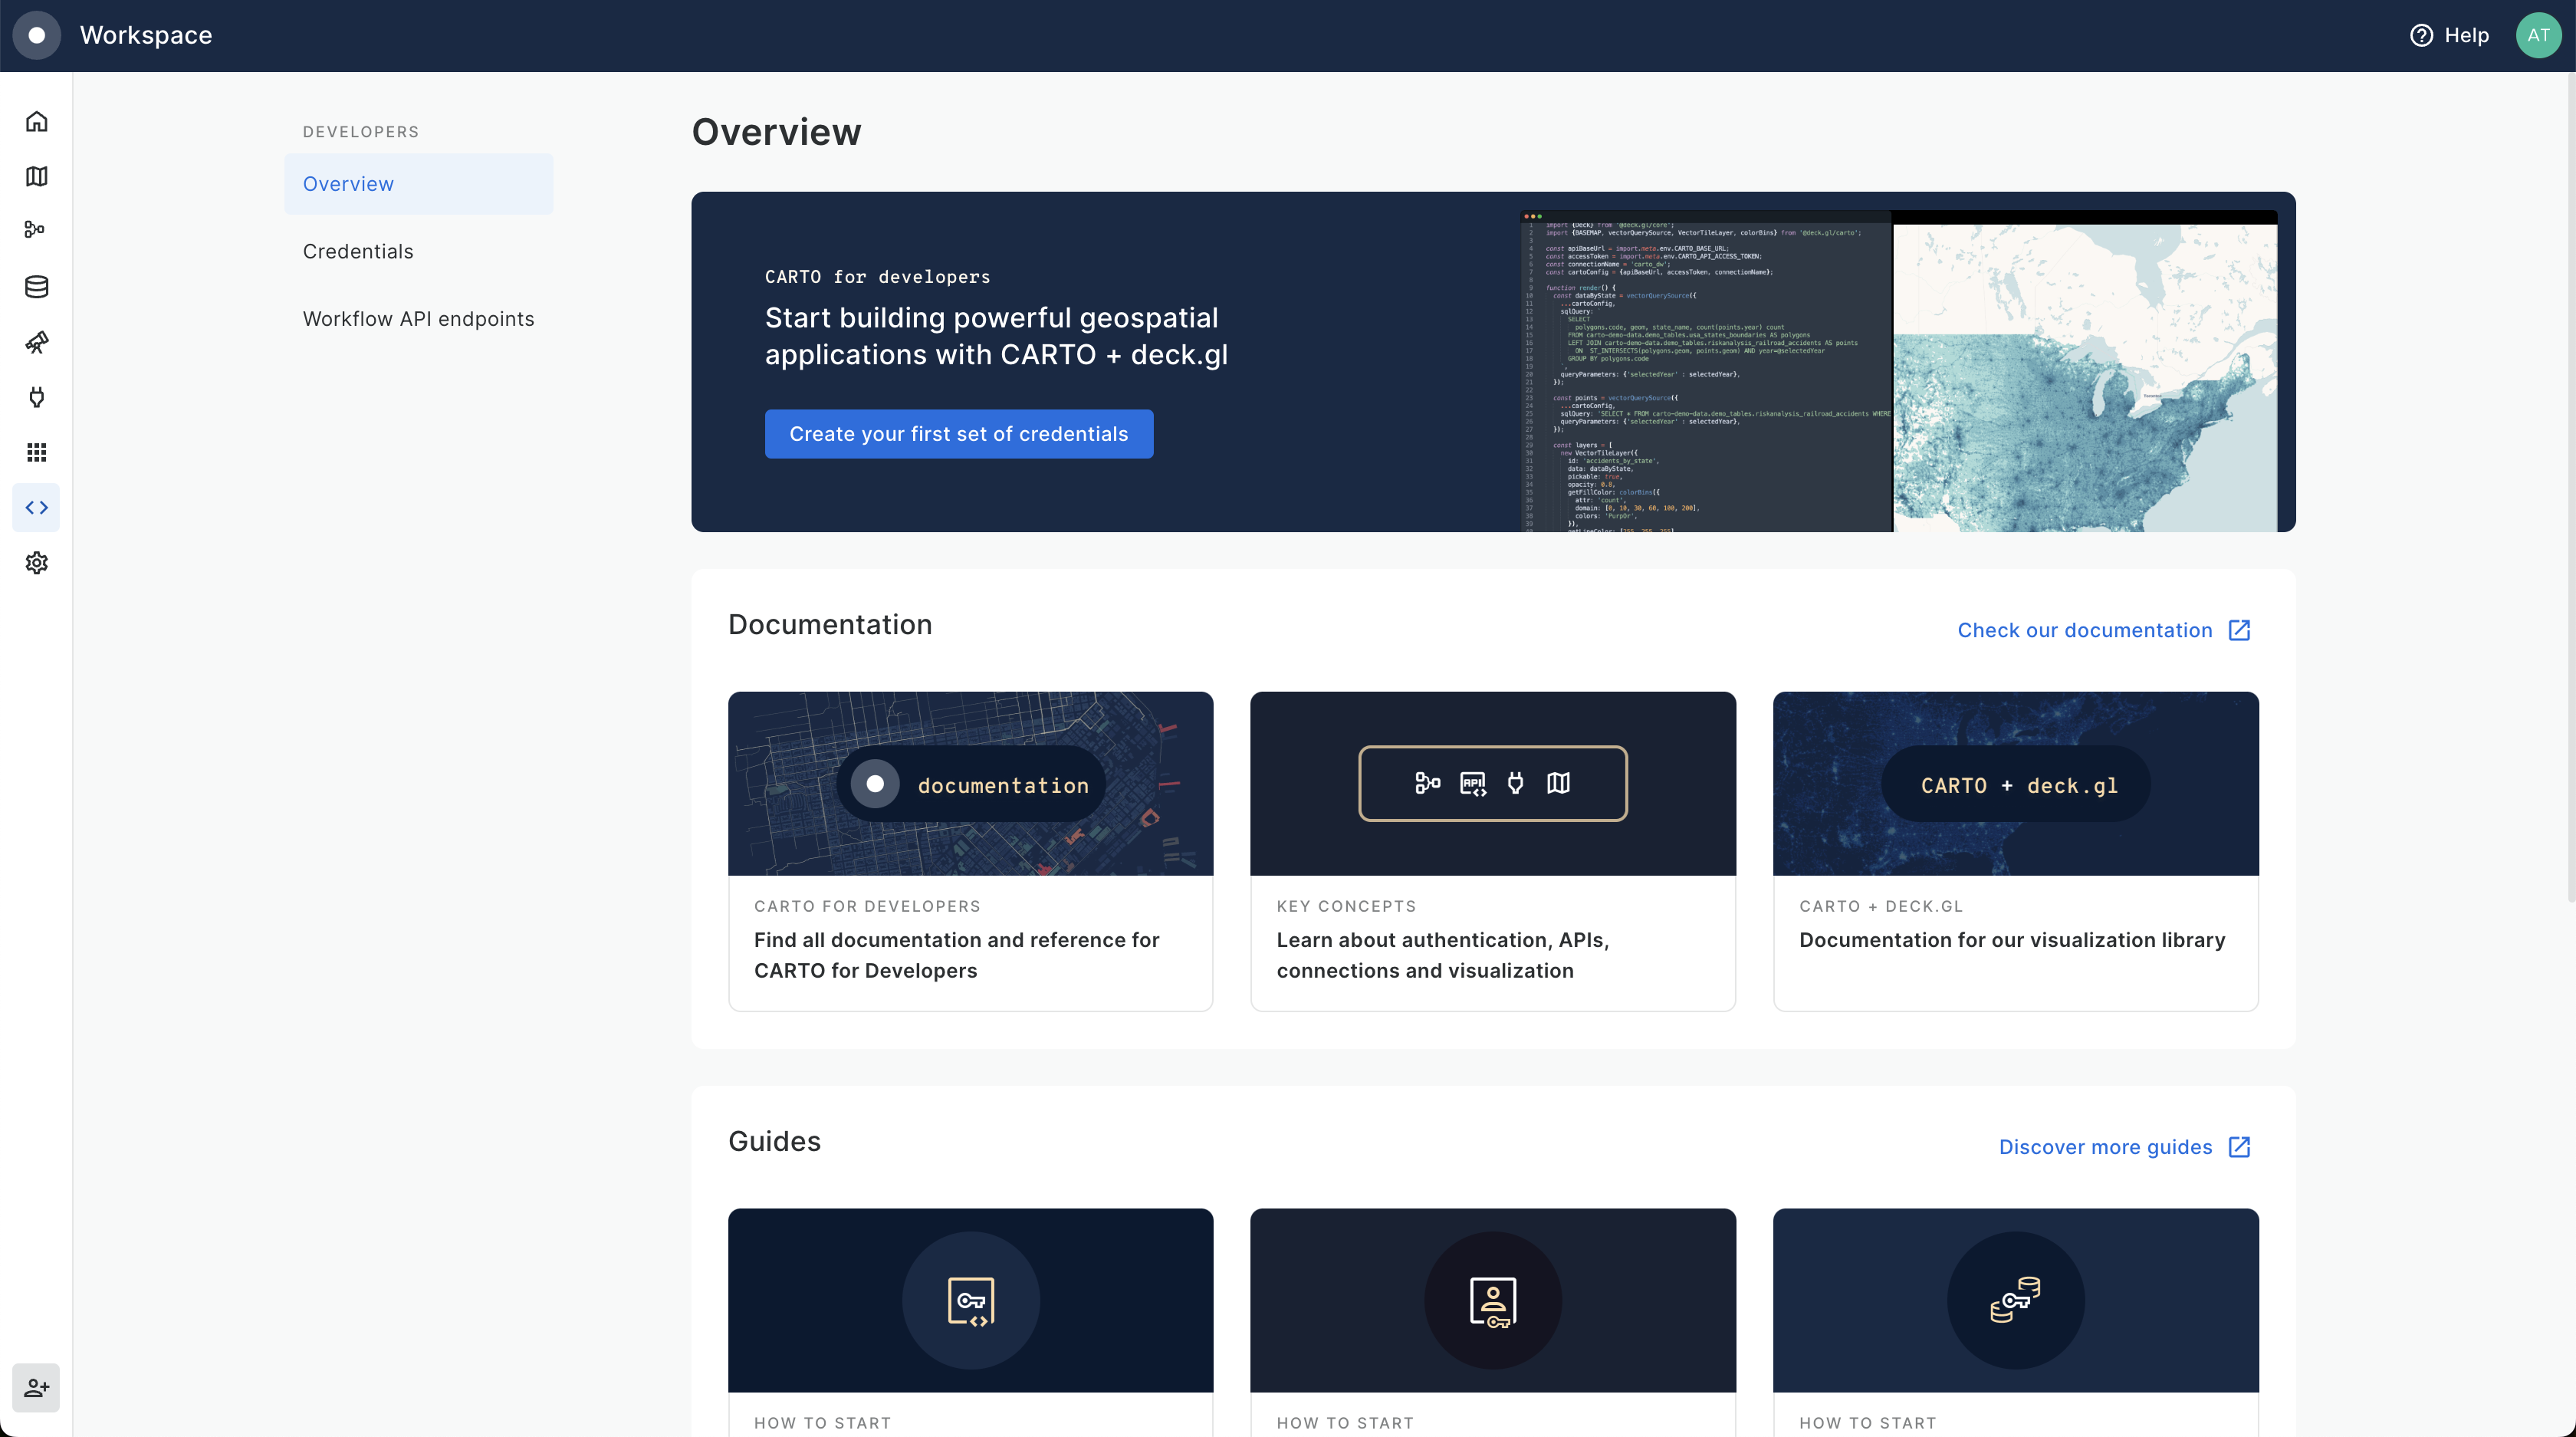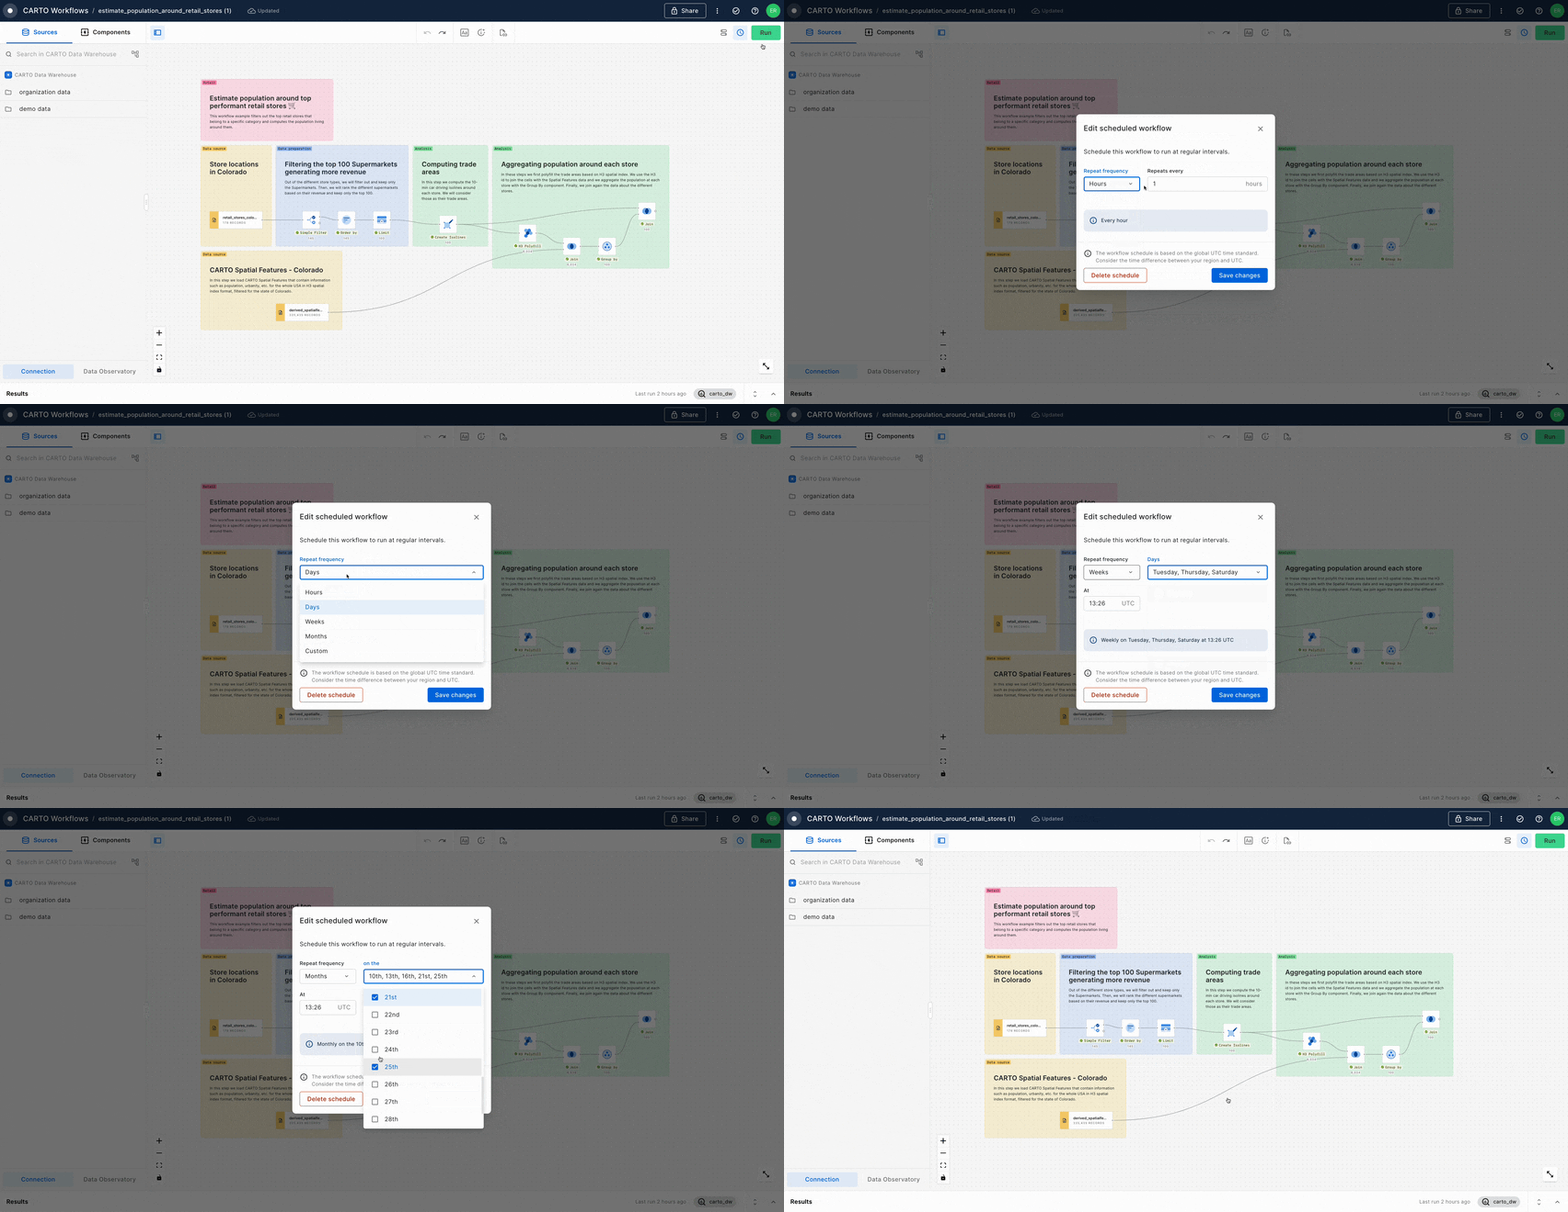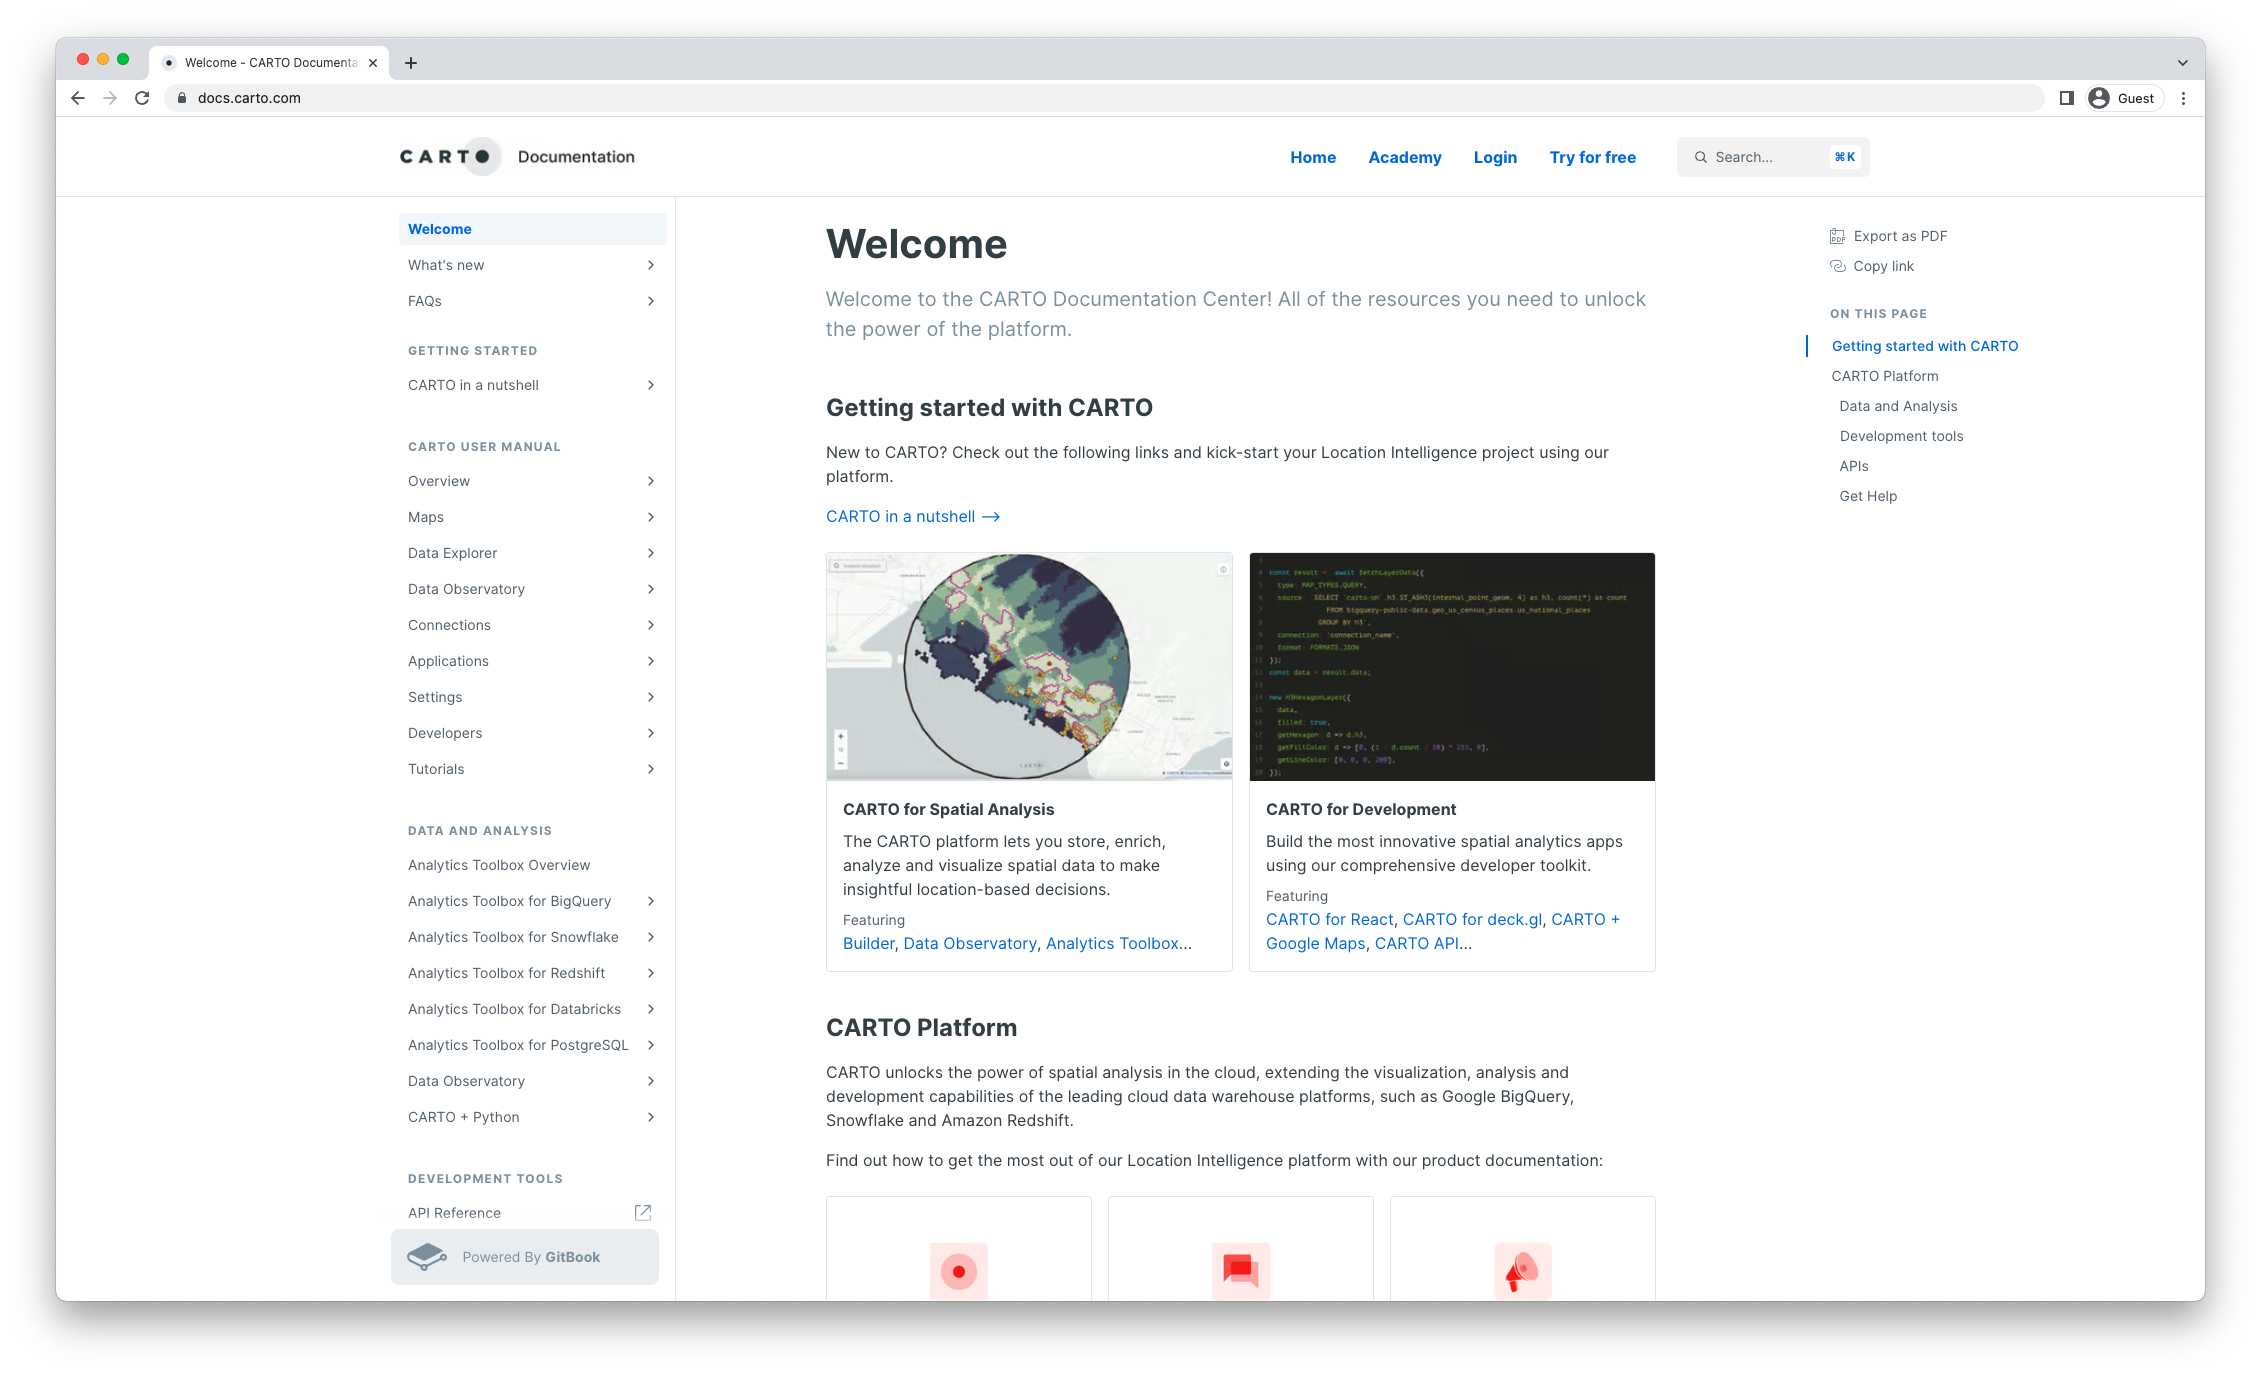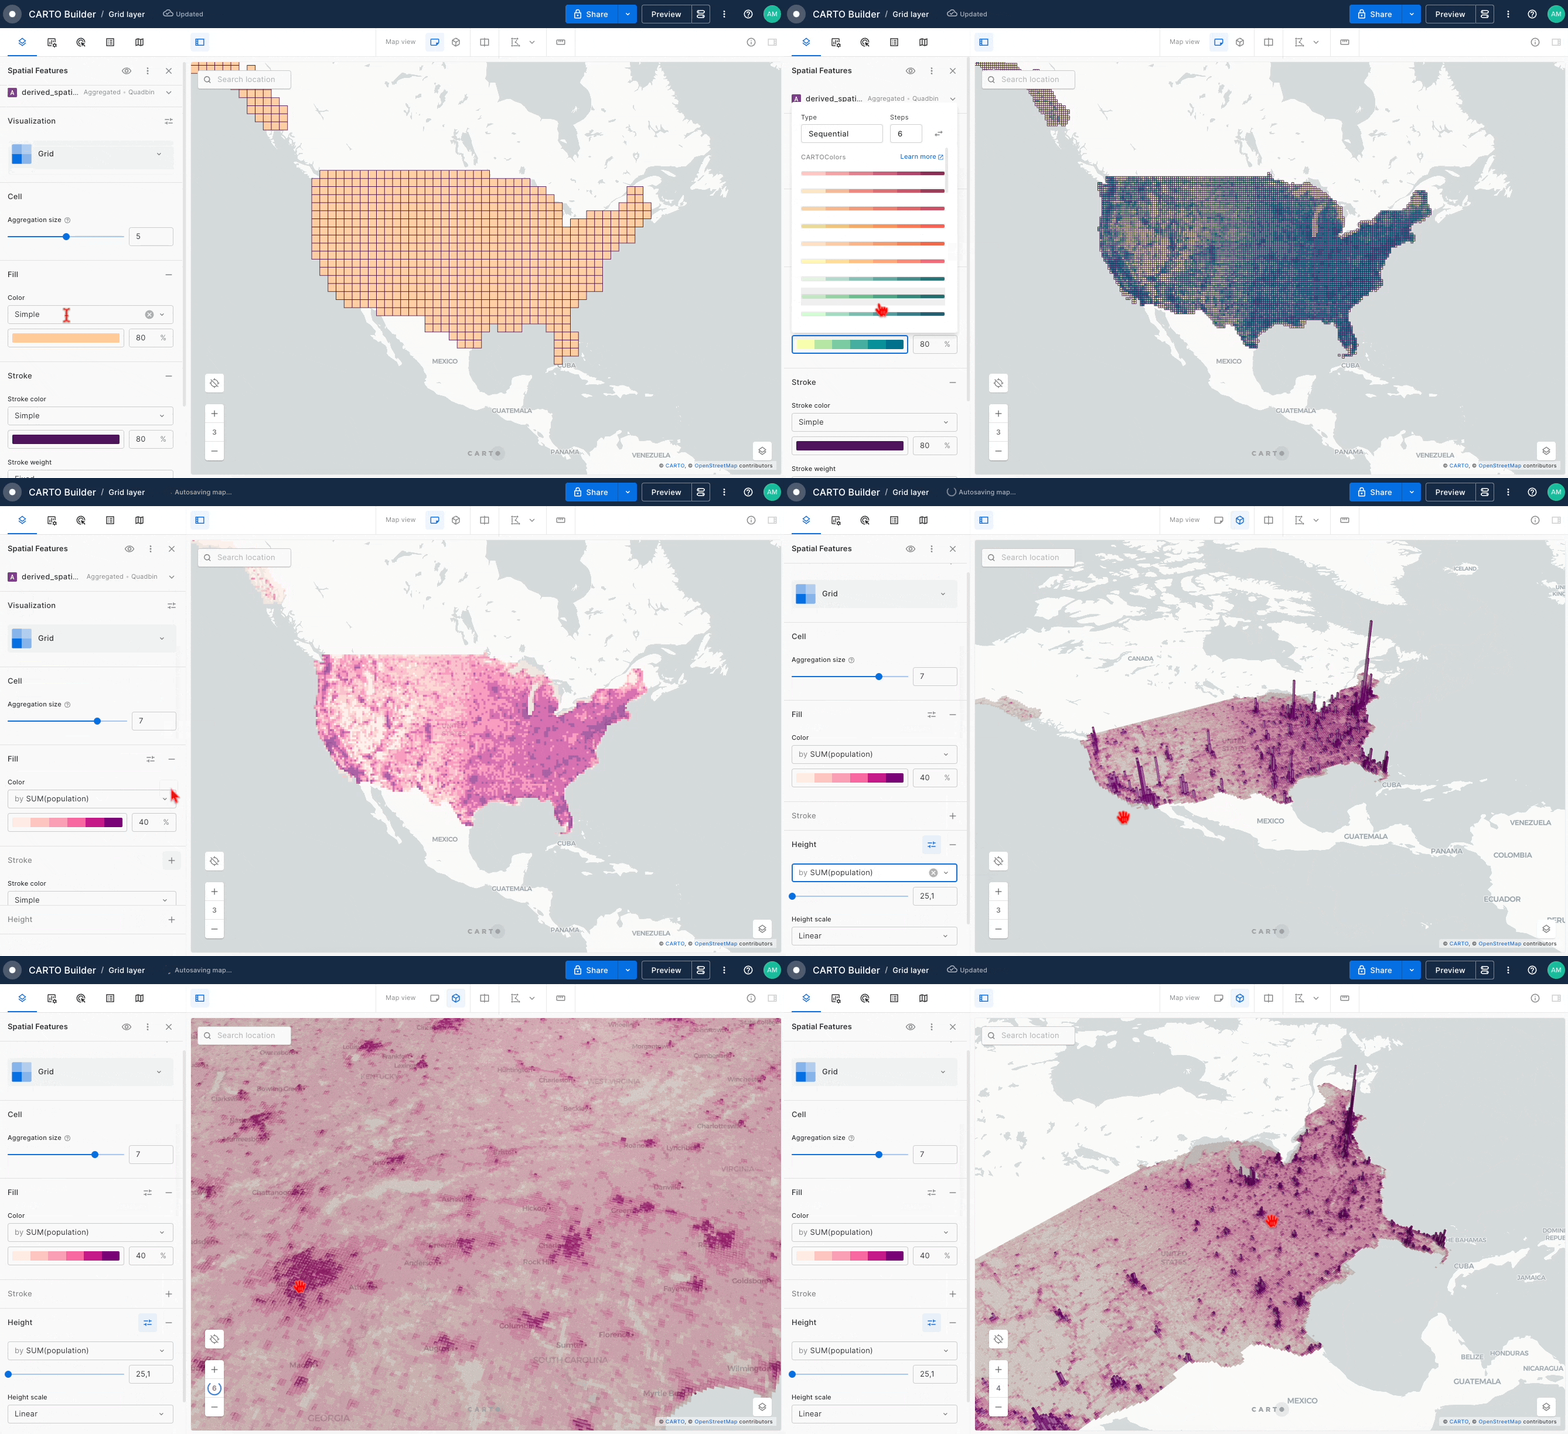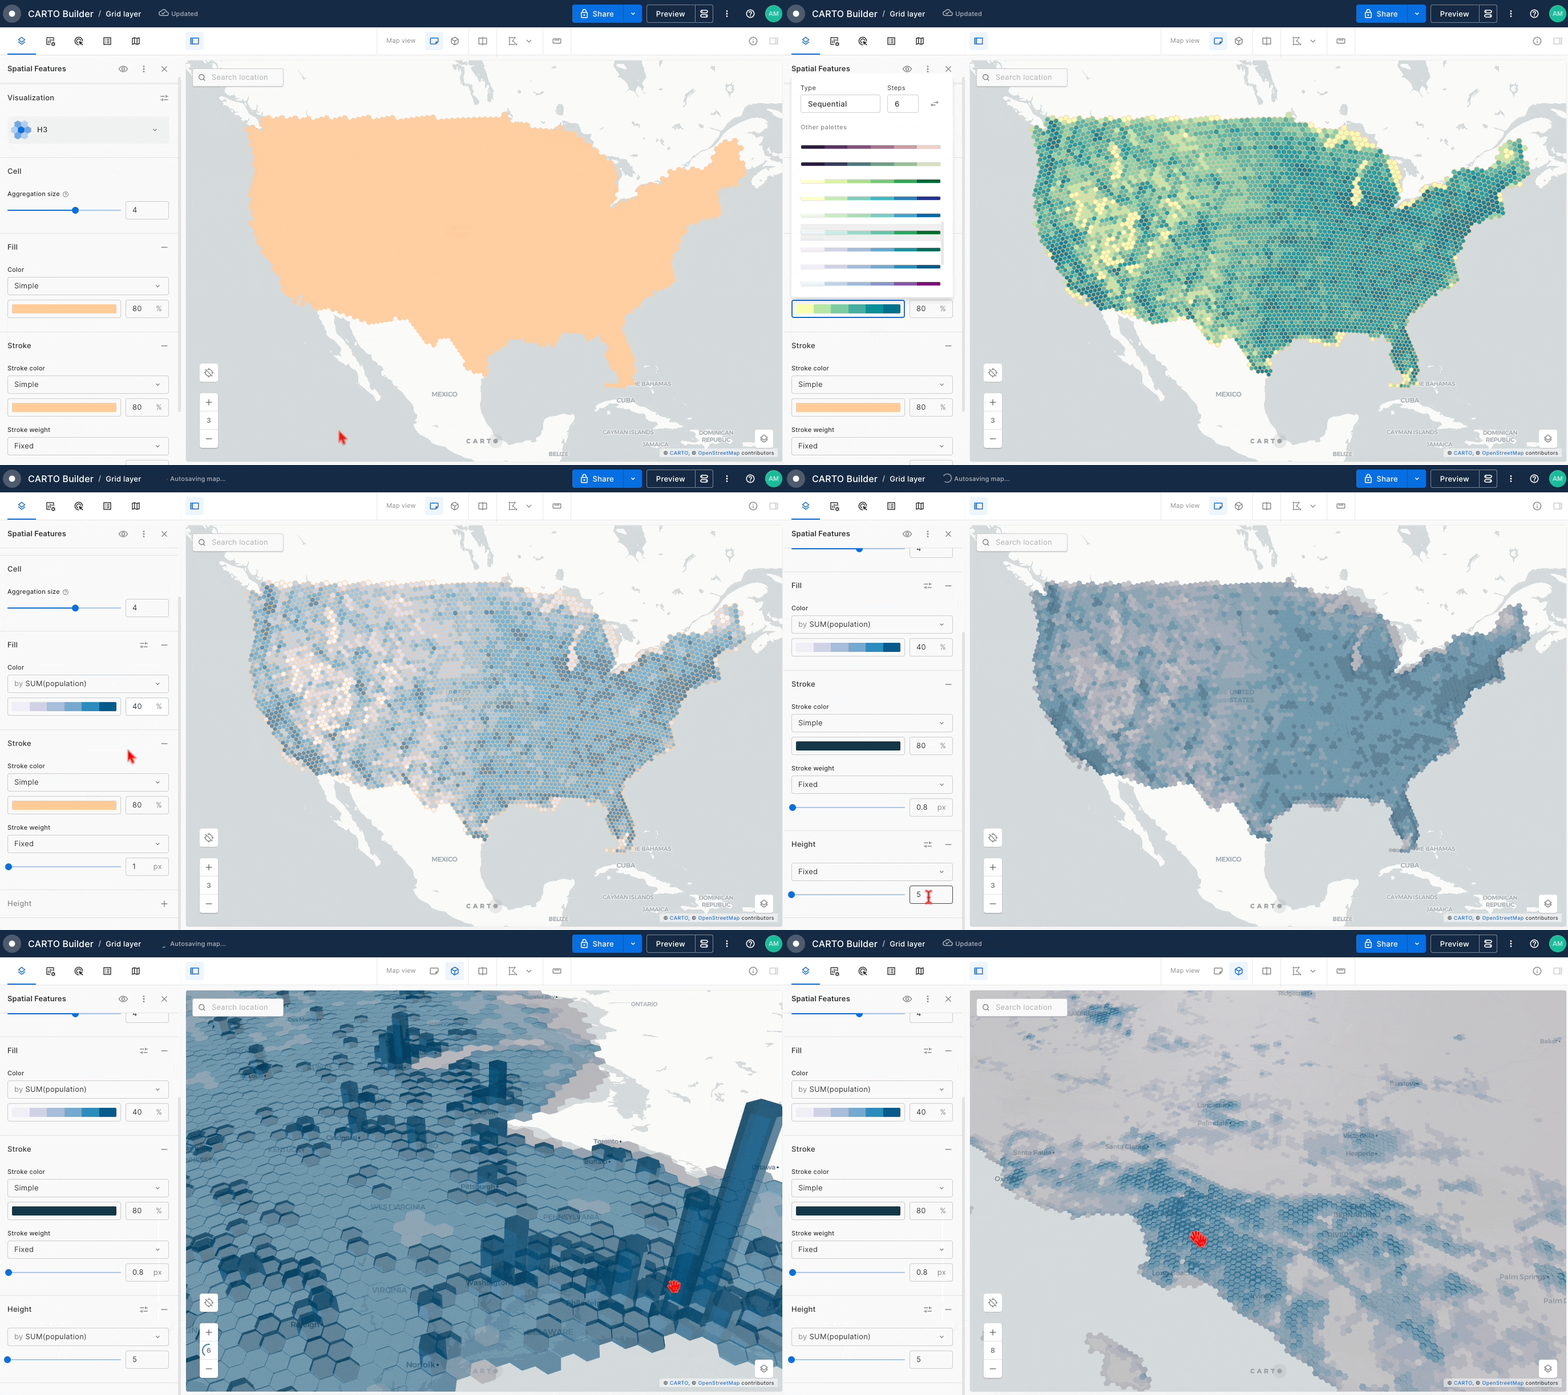
# Welcome

Welcome to the CARTO Documentation Center! All of the resources you need to unlock the power of the platform.

## Getting started with CARTO

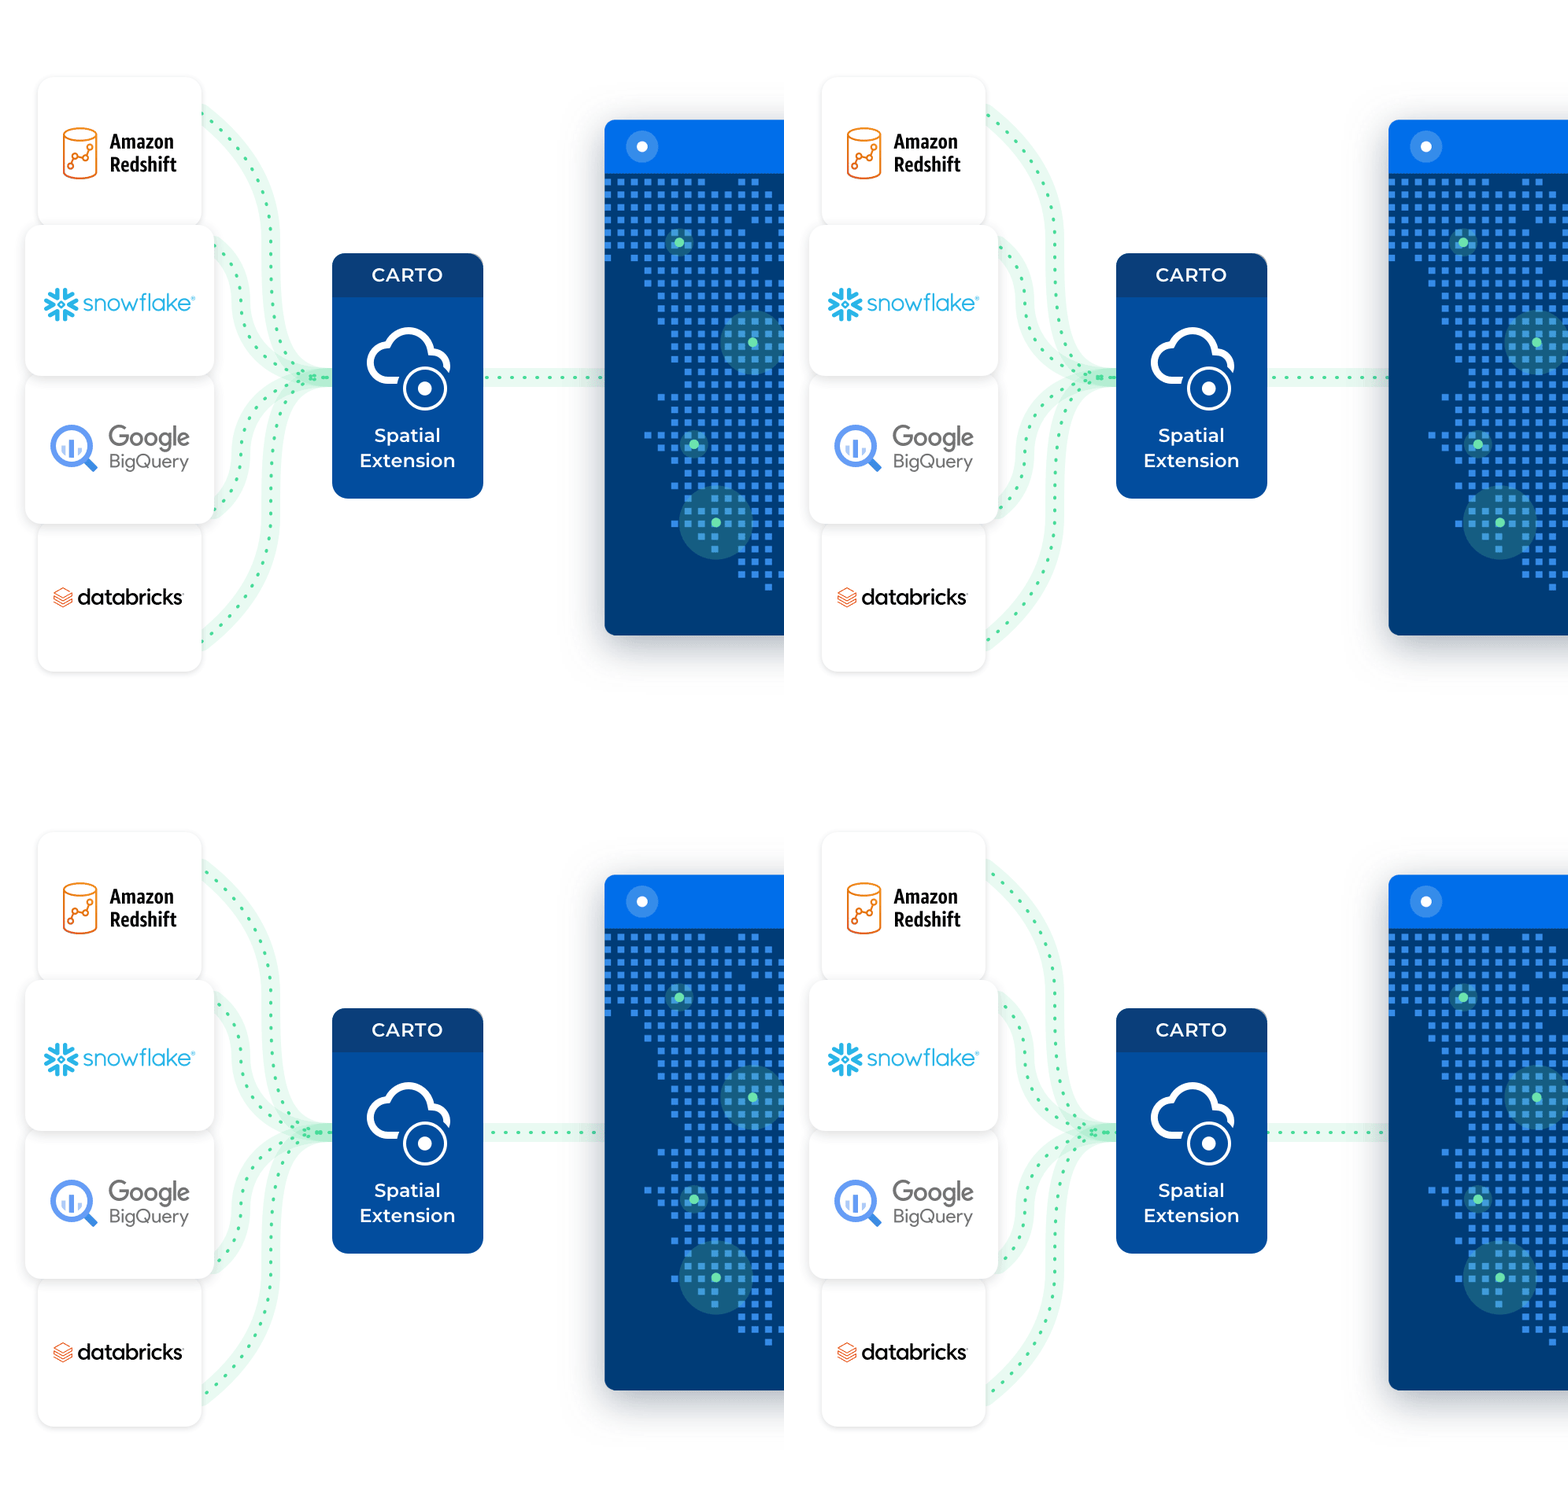
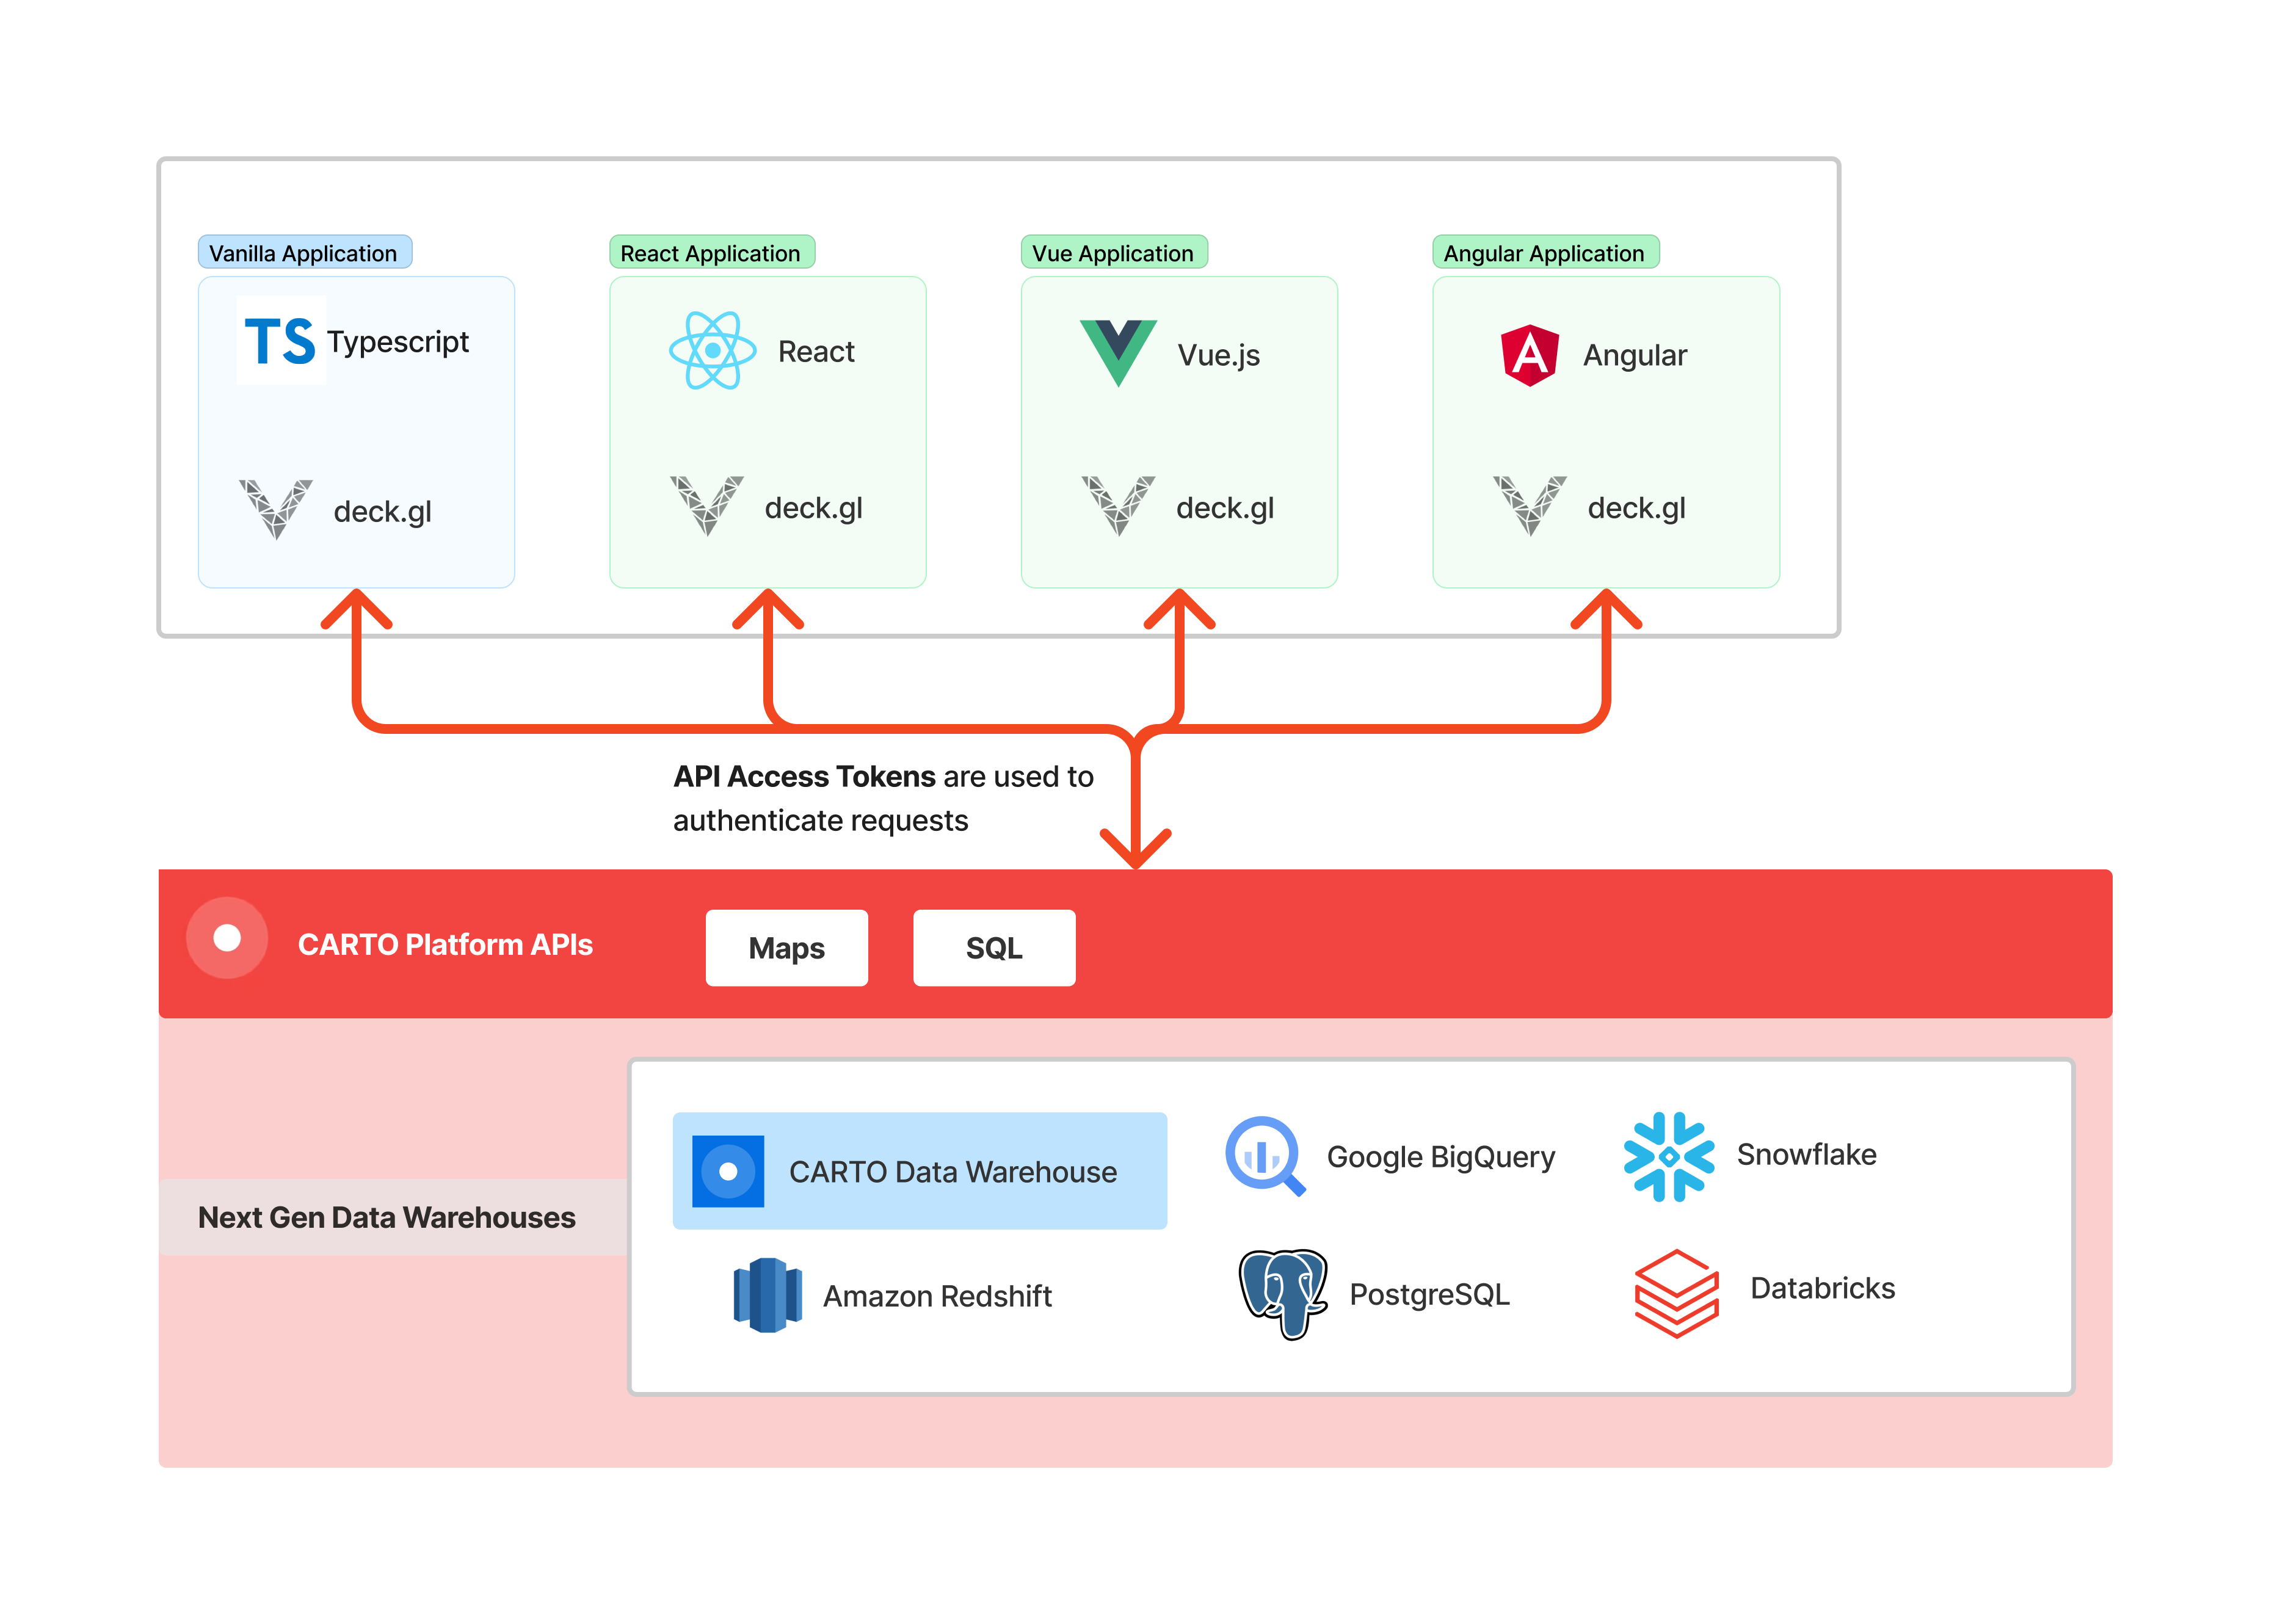
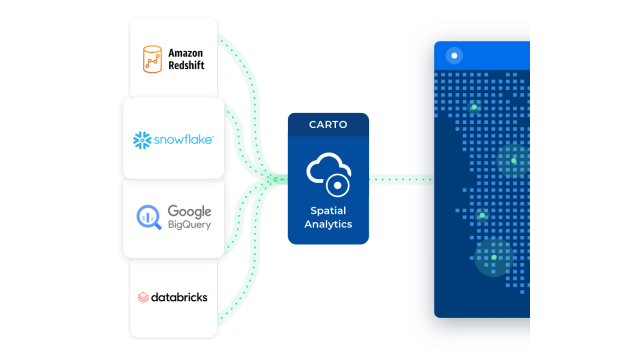
CARTO is the only cloud-first spatial platform built for accelerated, modern GIS. It runs natively on top of your cloud data warehouse platform (e.g. Google BigQuery, Snowflake, AWS Redshift, Databricks, Oracle, etc.), providing easy access to highly scalable spatial analysis and visualization capabilities in the cloud — be it for analytics, app development, data engineering, and more.

<table data-card-size="large" data-view="cards"><thead><tr><th></th><th></th><th data-hidden data-card-target data-type="content-ref"></th><th data-hidden data-card-cover data-type="files"></th></tr></thead><tbody><tr><td><strong>What is CARTO?</strong></td><td>An introduction to our cloud-native platform benefits and its different components.</td><td><a href="/pages/OiY9lJBAkEtJEIxDsJuA">/pages/OiY9lJBAkEtJEIxDsJuA</a></td><td><a href="/files/c85jZP8QVAVsprfy8nWR">/files/c85jZP8QVAVsprfy8nWR</a></td></tr><tr><td><strong>Quickstart guides</strong></td><td>Step-by-step guides to build your first maps, workflows, and applications.</td><td><a href="/pages/QOBWgxlRbnV60CSNHOqn">/pages/QOBWgxlRbnV60CSNHOqn</a></td><td><a href="/files/xgq3q0Z830jqhvFWCkS1">/files/xgq3q0Z830jqhvFWCkS1</a></td></tr><tr><td><strong>CARTO Academy</strong></td><td>Access detailed tutorials, videos and templates to learn more about geospatial analytics and to become a proficient user of the CARTO platform.</td><td><a href="https://academy.carto.com">https://academy.carto.com</a></td><td><a href="/files/q5tTlakxMQcIigkzk25c">/files/q5tTlakxMQcIigkzk25c</a></td></tr></tbody></table>

## CARTO Platform

CARTO unlocks the power of spatial analysis in the cloud, extending the visualization, analysis and development capabilities of the leading cloud data warehouse platforms, such as Google BigQuery, Snowflake, Oracle, and Amazon Redshift.

Find out how to get the most out of our Location Intelligence platform with our product documentation:

<table data-view="cards"><thead><tr><th></th><th></th><th></th><th data-hidden data-card-cover data-type="files"></th><th data-hidden data-card-target data-type="content-ref"></th></tr></thead><tbody><tr><td><strong>CARTO User Manual</strong></td><td>How to create connections to your data warehouse, build interactive maps and analytical workflows, subscribe to external data, and more.</td><td></td><td><a href="/files/kIalAYt0vj8ZLXFXreT6">/files/kIalAYt0vj8ZLXFXreT6</a></td><td><a href="/pages/99TedRFZumnPkXfxAd4N">/pages/99TedRFZumnPkXfxAd4N</a></td></tr><tr><td><strong>FAQs</strong></td><td>Frequently Asked Questions about the CARTO platform and its components.</td><td></td><td><a href="/files/L1f83l5PeAxj2SV2zIgK">/files/L1f83l5PeAxj2SV2zIgK</a></td><td><a href="/pages/JJ640i9mugSc5nTdhgkq">/pages/JJ640i9mugSc5nTdhgkq</a></td></tr><tr><td><strong>What's New</strong></td><td>Learn about the latest features, improvements and bug fixes in our product.</td><td></td><td><a href="/files/GM63KZcQMhpWj1u2Y5MA">/files/GM63KZcQMhpWj1u2Y5MA</a></td><td><a href="/pages/qvwFGMMY1SNZ5z88PomN">/pages/qvwFGMMY1SNZ5z88PomN</a></td></tr><tr><td><strong>CARTO Self-hosted</strong></td><td>Deploy CARTO on your own infrastructure. Learn about recommended architecture, requirements, and follow installation guides to get started.</td><td></td><td><a href="/files/8Zu6Jd7M4ItlFwMymYOo">/files/8Zu6Jd7M4ItlFwMymYOo</a></td><td><a href="/pages/MT8p4PkILM9iZYfu1COq">/pages/MT8p4PkILM9iZYfu1COq</a></td></tr></tbody></table>

### CARTO for Agents

<table data-view="cards"><thead><tr><th></th><th></th><th></th><th data-hidden data-card-cover data-type="files"></th><th data-hidden data-card-target data-type="content-ref"></th></tr></thead><tbody><tr><td><strong>CARTO CLI</strong></td><td>Manage maps, workflows, connections, and the rest of your CARTO organization from the terminal, usable by humans and AI agents alike.</td><td></td><td><a href="/files/vA2zRjxMR54Cofs3vzhm">/files/vA2zRjxMR54Cofs3vzhm</a></td><td><a href="/pages/jDLCAWsmRqnQEueBVErB">/pages/jDLCAWsmRqnQEueBVErB</a></td></tr><tr><td><strong>CARTO MCP Server</strong></td><td>Plug CARTO into chat agents like Claude.ai, ChatGPT, and Gemini through the standard Model Context Protocol.</td><td></td><td><a href="/files/RAoI5WVHqXMyfk06m5er">/files/RAoI5WVHqXMyfk06m5er</a></td><td><a href="/pages/2qEL0xe1jvf2yfQjMRtx">/pages/2qEL0xe1jvf2yfQjMRtx</a></td></tr><tr><td><strong>CARTO Agent Skills</strong></td><td>Skill playbooks that teach coding agents (Claude Code, Cursor, Codex, Gemini CLI) how to drive CARTO without re-discovering the API every session.</td><td></td><td><a href="/files/L6Xyu9cFhHS1rSwETbR7">/files/L6Xyu9cFhHS1rSwETbR7</a></td><td><a href="/pages/rkTqpbCFsLgeyvnctpBi">/pages/rkTqpbCFsLgeyvnctpBi</a></td></tr></tbody></table>

### Data and Analysis

<table data-view="cards"><thead><tr><th></th><th></th><th></th><th data-hidden data-card-cover data-type="files"></th><th data-hidden data-card-target data-type="content-ref"></th></tr></thead><tbody><tr><td><strong>Analytics Toolbox for BigQuery</strong></td><td>Unlock Spatial Analytics on your BigQuery.</td><td></td><td><a href="/files/YV4LQ4QhmNds8H5lL7oX">/files/YV4LQ4QhmNds8H5lL7oX</a></td><td><a href="/pages/UxYrodq5z6I8En1qVxNO">/pages/UxYrodq5z6I8En1qVxNO</a></td></tr><tr><td><strong>Analytics Toolbox for Snowflake</strong></td><td>Unlock Spatial Analytics on your Snowflake.</td><td></td><td><a href="/files/rJGAA8rIYlxyyd6mOu3O">/files/rJGAA8rIYlxyyd6mOu3O</a></td><td><a href="/pages/nNUmVF4s29wzSf7ffU4s">/pages/nNUmVF4s29wzSf7ffU4s</a></td></tr><tr><td><strong>Analytics Toolbox for Redshift</strong></td><td>Unlock Spatial Analytics on your Redshift.</td><td></td><td><a href="/files/Htpk3NrW720HqyPqFX3C">/files/Htpk3NrW720HqyPqFX3C</a></td><td><a href="/pages/xqlPhzxzpMjt9UUKMOuL">/pages/xqlPhzxzpMjt9UUKMOuL</a></td></tr><tr><td><strong>Analytics Toolbox for Databricks</strong></td><td>Unlock Spatial Analytics on your Databricks.</td><td></td><td><a href="/files/wrUw6h5UQULgLhidDT9B">/files/wrUw6h5UQULgLhidDT9B</a></td><td><a href="/pages/xywnGDpdK2d2Z0KJfW36">/pages/xywnGDpdK2d2Z0KJfW36</a></td></tr><tr><td><strong>Analytics Toolbox for PostgreSQL</strong></td><td>Unlock Spatial Analytics on your PostgreSQL.</td><td></td><td><a href="/files/whfpX04NY39xYAIwuDHO">/files/whfpX04NY39xYAIwuDHO</a></td><td><a href="/pages/2xHwVS8hTJjh20lnumy6">/pages/2xHwVS8hTJjh20lnumy6</a></td></tr><tr><td><strong>Data Observatory</strong></td><td>Gain access to thousands of public and premium spatial datasets, and save time on gathering, cleaning, and analyzing data.</td><td></td><td><a href="/files/aZo1s5YcE8Zx7JHxqxaV">/files/aZo1s5YcE8Zx7JHxqxaV</a></td><td><a href="/pages/wEMq5dZahEiOrETEOoNO">/pages/wEMq5dZahEiOrETEOoNO</a></td></tr><tr><td><strong>CARTO + Python</strong></td><td>A set of Python packages to allow data scientists to work with CARTO from Python notebooks.</td><td></td><td><a href="/files/VezBxP4jgRUUP69Sxt36">/files/VezBxP4jgRUUP69Sxt36</a></td><td><a href="/pages/aXahqmpsE1WpX16WNzNP">/pages/aXahqmpsE1WpX16WNzNP</a></td></tr></tbody></table>

### Development tools

<table data-view="cards"><thead><tr><th></th><th></th><th></th><th data-hidden data-card-cover data-type="files"></th><th data-hidden data-card-target data-type="content-ref"></th></tr></thead><tbody><tr><td><strong>CARTO + deck.gl</strong></td><td>Build large-scale geospatial apps using deck.gl, the WebGPU-based framework for data visualization.</td><td></td><td><a href="/files/sPPDmqIGHTNSLZqszBu2">/files/sPPDmqIGHTNSLZqszBu2</a></td><td><a href="https://github.com/CartoDB/gitbook-documentation/blob/master/carto-for-developers/key-concepts/carto-for-deck.gl">https://github.com/CartoDB/gitbook-documentation/blob/master/carto-for-developers/key-concepts/carto-for-deck.gl</a></td></tr><tr><td><strong>CARTO for React</strong></td><td>Build compelling spatial apps using CARTO, React and deck.gl.</td><td></td><td><a href="/files/aTz8nQ9ZT3WlMwAnZ8M3">/files/aTz8nQ9ZT3WlMwAnZ8M3</a></td><td><a href="/pages/h4L12XZhuLIc3xh5SSX6">/pages/h4L12XZhuLIc3xh5SSX6</a></td></tr><tr><td><strong>CARTO + Google Maps</strong></td><td>Integrate CARTO layers with Google Maps API and basemaps.</td><td></td><td><a href="/files/XfINcHwaj9aesdS6G1RG">/files/XfINcHwaj9aesdS6G1RG</a></td><td><a href="/pages/MpHMEyLwBq86PJjgVgNX">/pages/MpHMEyLwBq86PJjgVgNX</a></td></tr></tbody></table>

### APIs

<table data-card-size="large" data-view="cards"><thead><tr><th></th><th></th><th></th><th data-hidden data-card-cover data-type="files"></th><th data-hidden data-card-target data-type="content-ref"></th></tr></thead><tbody><tr><td><strong>CARTO API</strong></td><td>The CARTO API allows you to interact with your data in an external data warehouse to create performant cloud-native geospatial solutions.</td><td></td><td><a href="/files/ChAJcSXrWm2t3A2aesTt">/files/ChAJcSXrWm2t3A2aesTt</a></td><td><a href="https://api-docs.carto.com">https://api-docs.carto.com</a></td></tr></tbody></table>

### Get Help

<table data-view="cards"><thead><tr><th></th><th></th><th></th><th data-hidden data-card-cover data-type="files"></th><th data-hidden data-card-target data-type="content-ref"></th></tr></thead><tbody><tr><td><strong>Contact Support</strong></td><td>Get in touch with our team of first-class geospatial specialists.</td><td></td><td><a href="/files/Crn6JlfBM6YaT7XCbjfY">/files/Crn6JlfBM6YaT7XCbjfY</a></td><td><a href="/pages/aHMHP576BualGbBYCQ46">/pages/aHMHP576BualGbBYCQ46</a></td></tr><tr><td><strong>Join our community of users in Slack</strong></td><td>Our community of users is a great place to ask questions and get help from CARTO experts.</td><td></td><td><a href="/files/ffzCrlueJeUF8I1W7HVb">/files/ffzCrlueJeUF8I1W7HVb</a></td><td><a href="https://join.slack.com/t/cartousercommunity/shared_invite/zt-t7t7k5s4-3c4pZJLrLlkVow3AEDt~ZQ">https://join.slack.com/t/cartousercommunity/shared_invite/zt-t7t7k5s4-3c4pZJLrLlkVow3AEDt~ZQ</a></td></tr><tr><td><strong>All previous libraries and components</strong></td><td>Including <em>API v2, CARTO.js, CartoCSS, Torque.js, CARTOframes and others.</em></td><td></td><td><a href="/files/TDHVMyp1PTwEIvh2N7Ye">/files/TDHVMyp1PTwEIvh2N7Ye</a></td><td><a href="/pages/3GvzWPceEjqU9cK5RpjA">/pages/3GvzWPceEjqU9cK5RpjA</a></td></tr></tbody></table>


# What's new

Learn about the latest features, improvements and fixes in our product.

{% hint style="success" %}
This page will always reflect the latest changes in the CARTO platform. Older release notes will be archived and are available in the left menu and the search bar.
{% endhint %}

{% updates %}
{% update date="2026-07-06" tags="new,builder" %}

## More export formats and controls in Builder

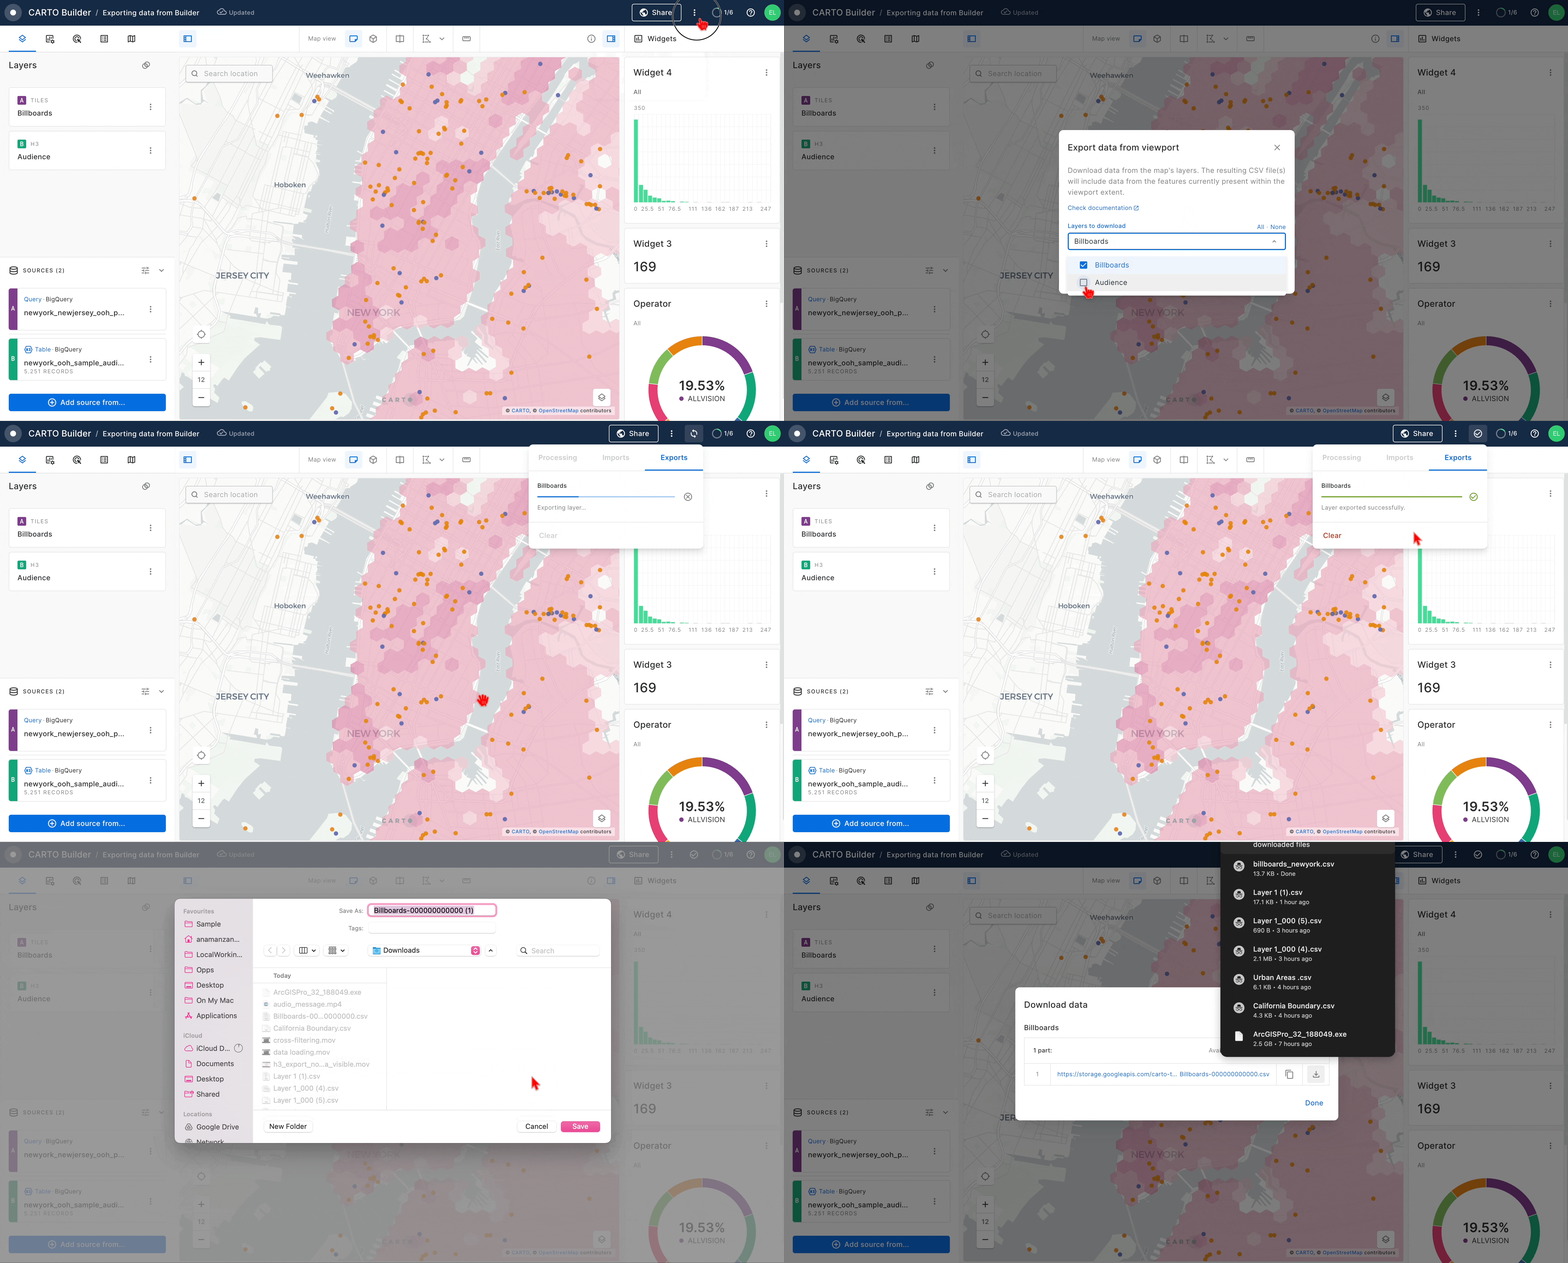
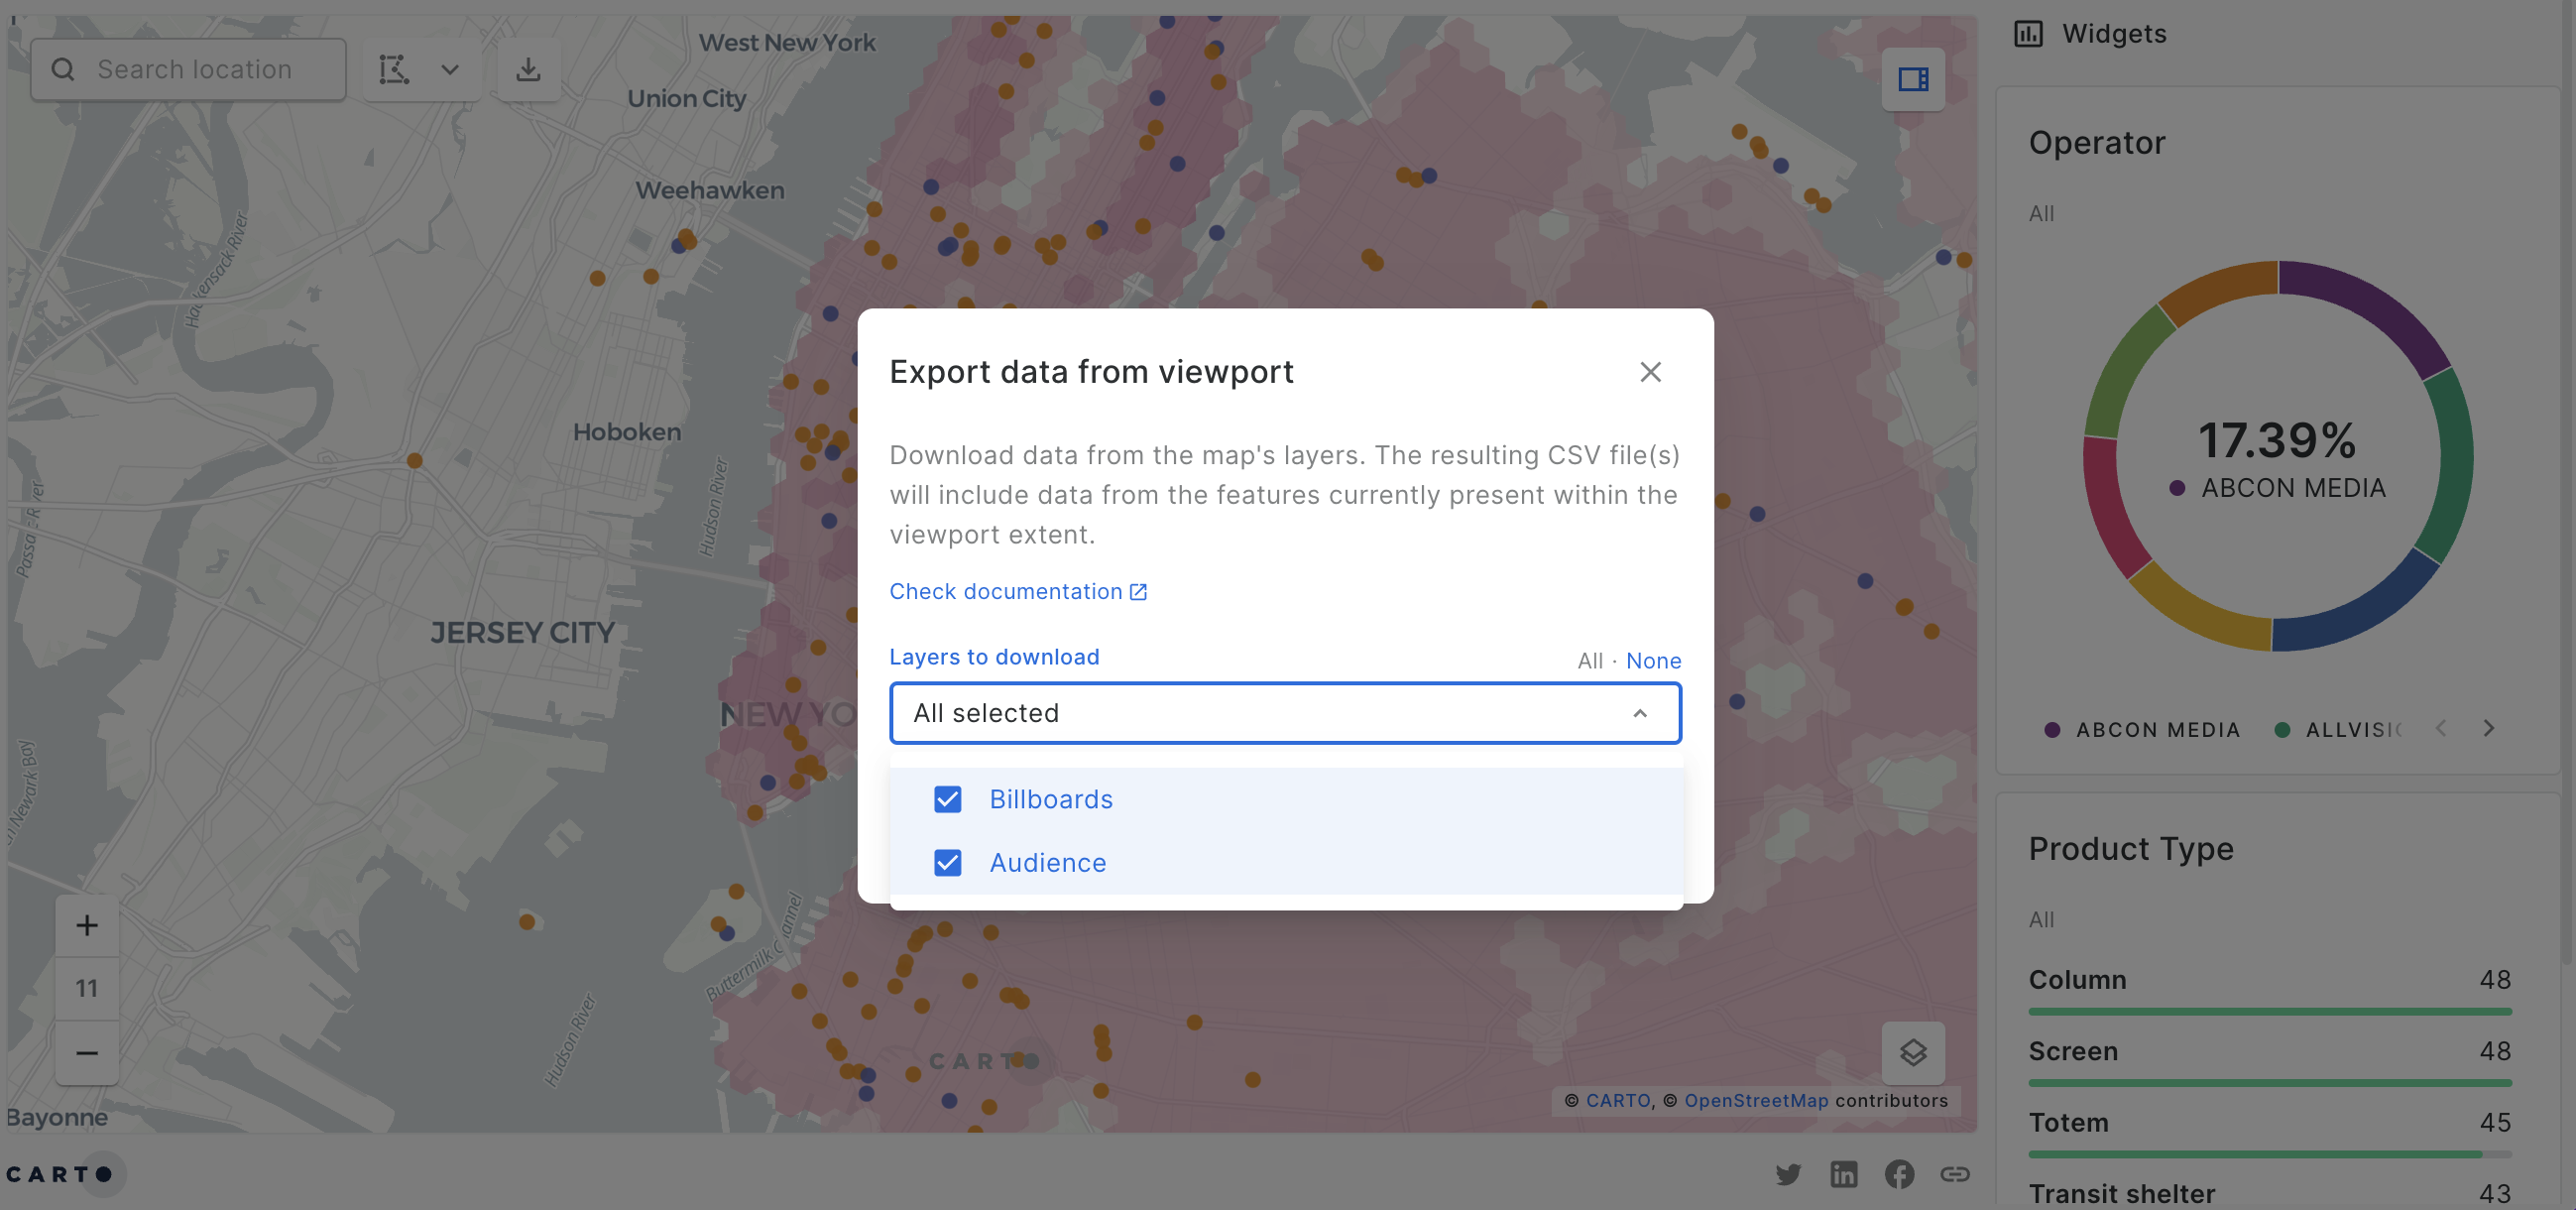
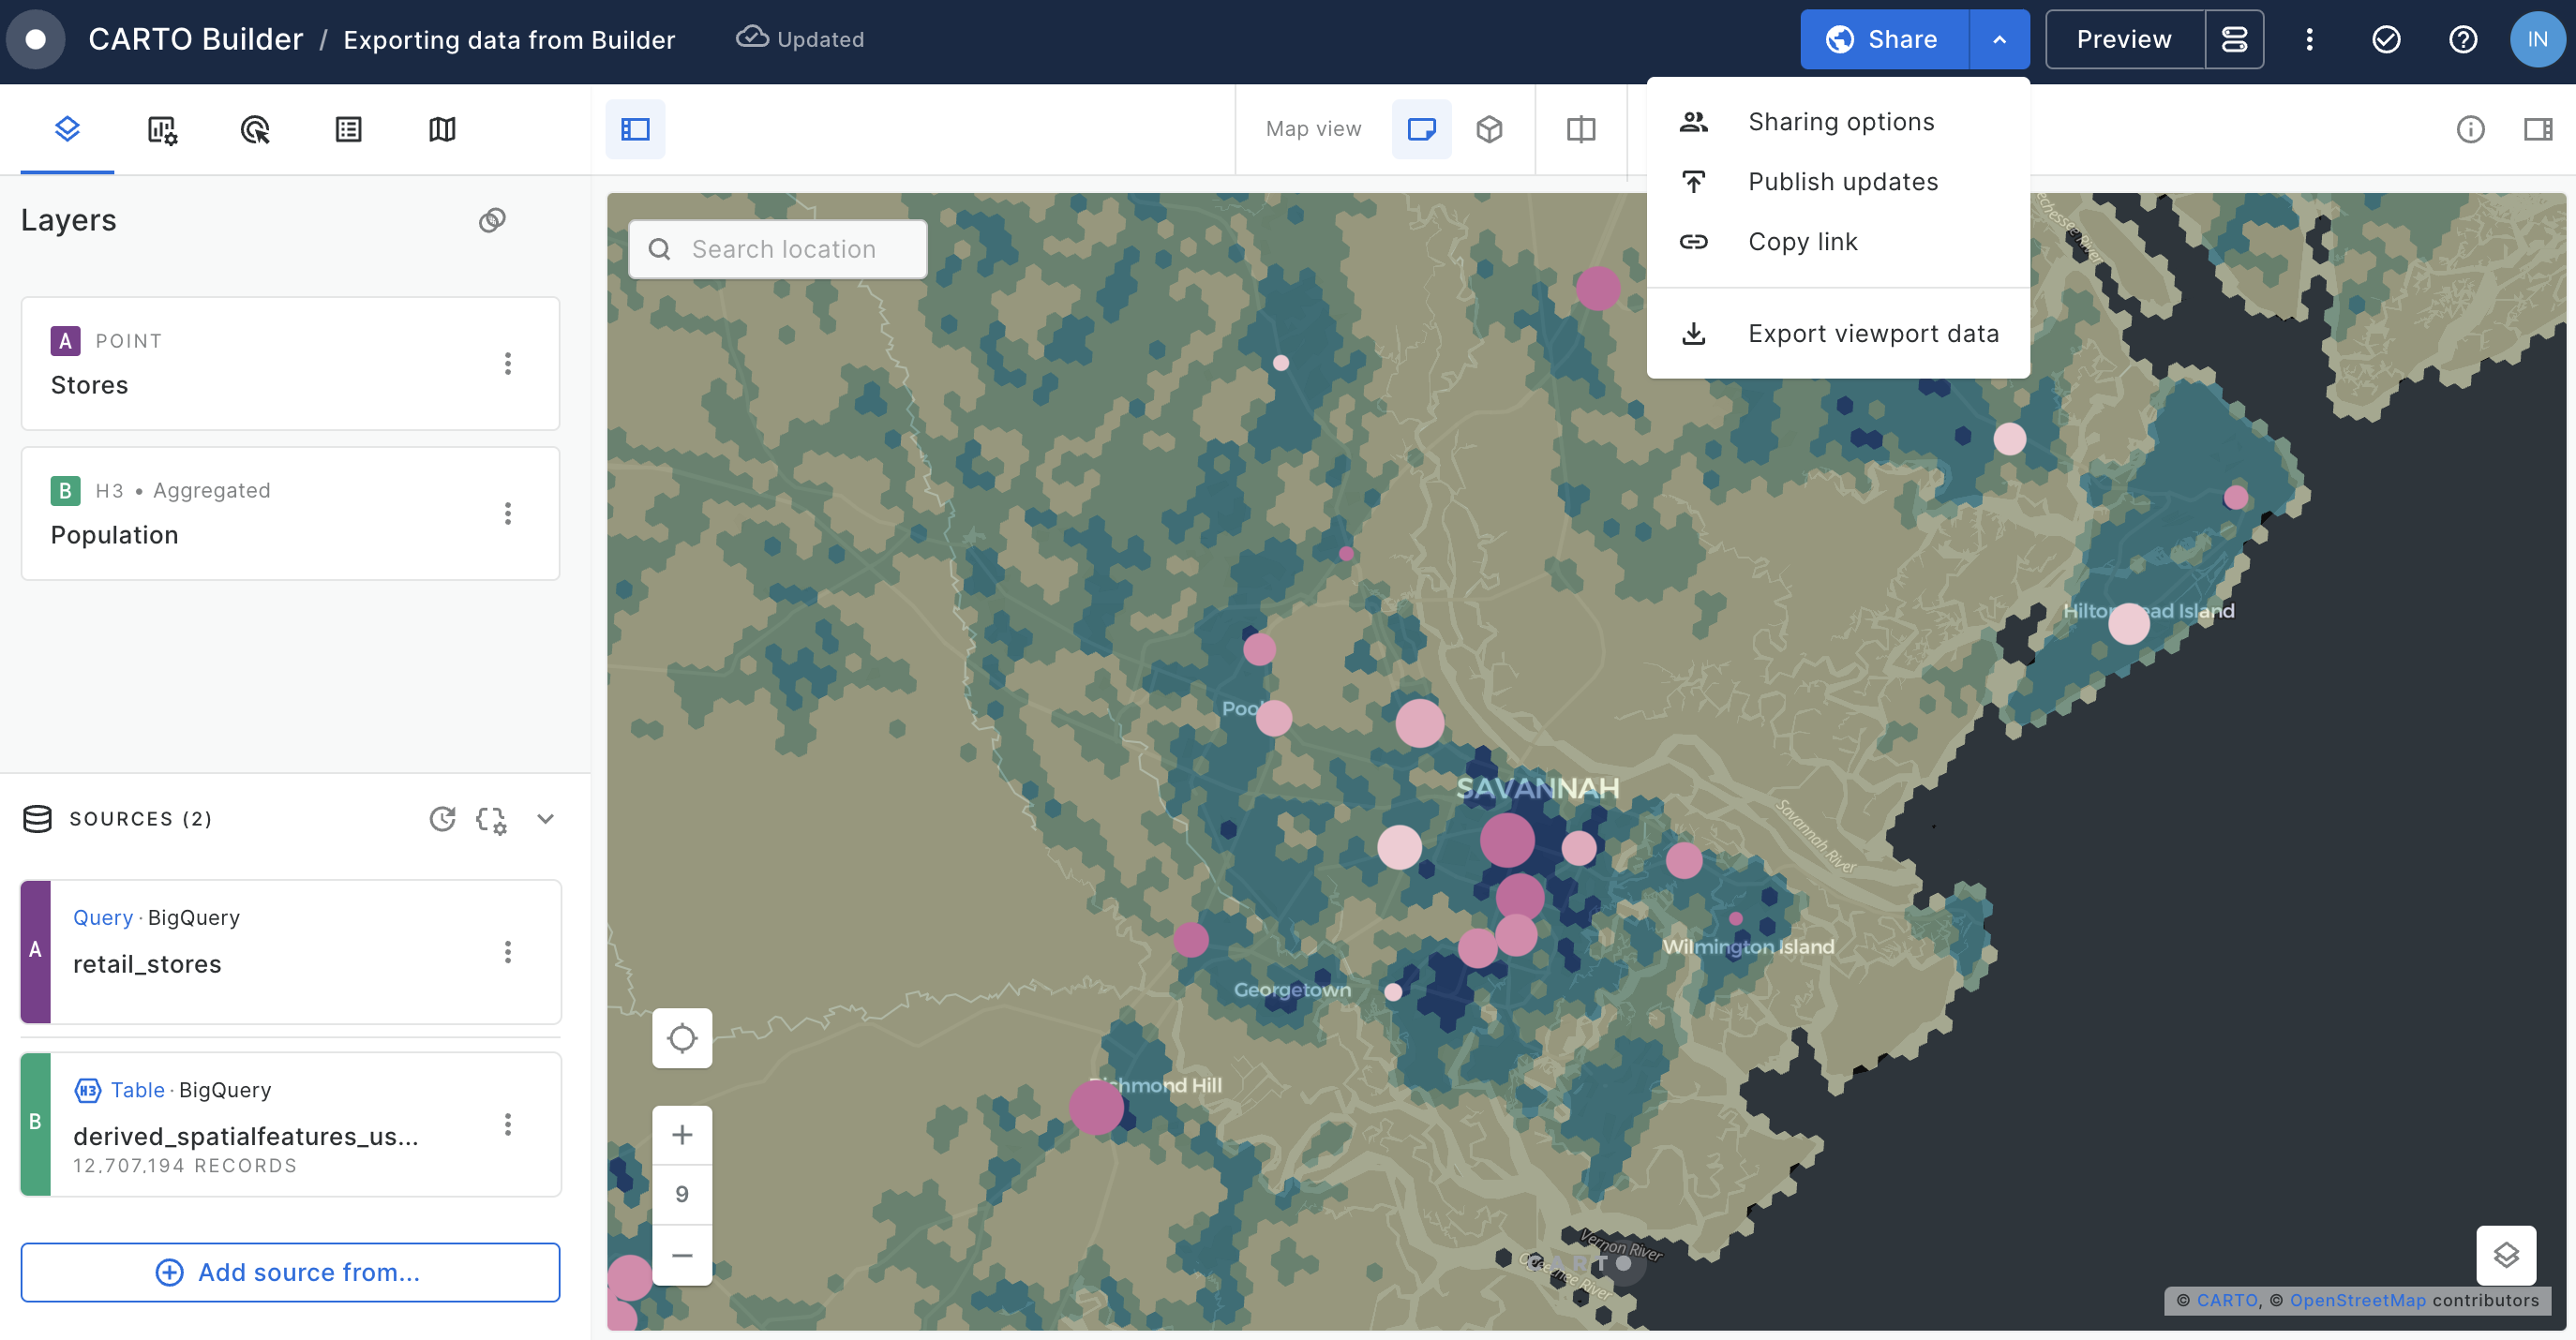
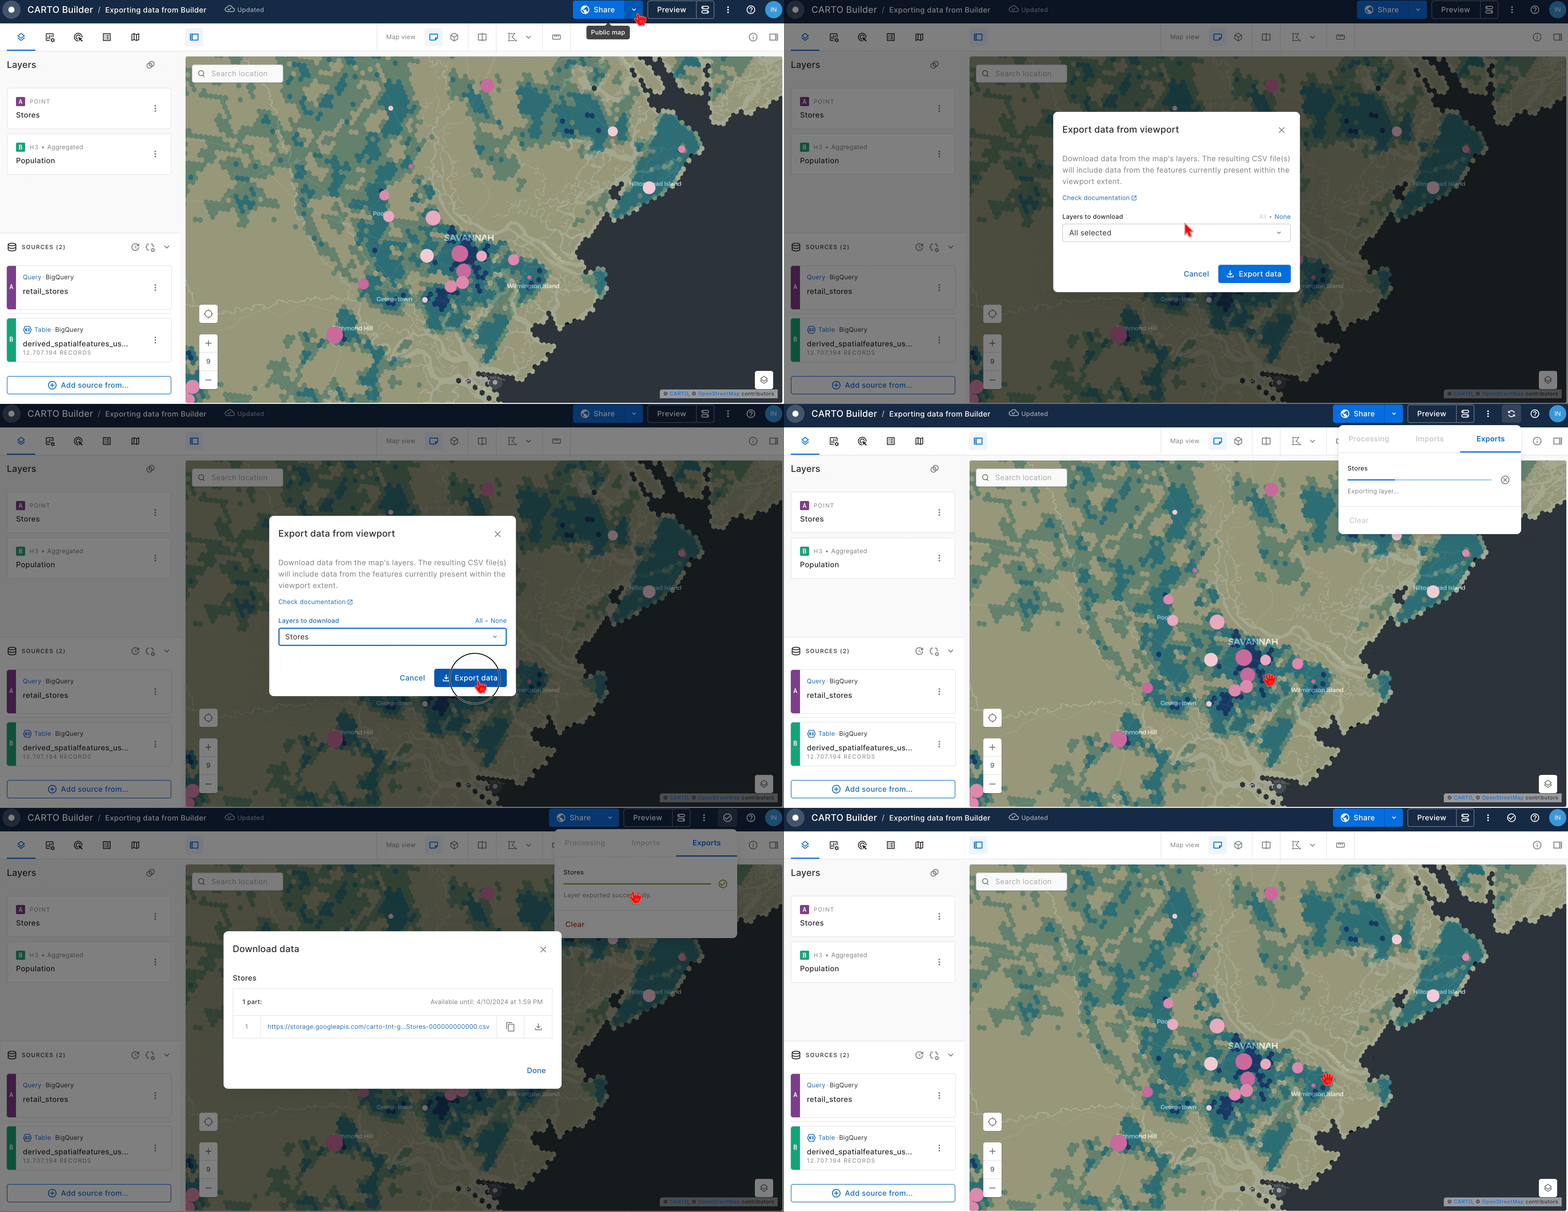
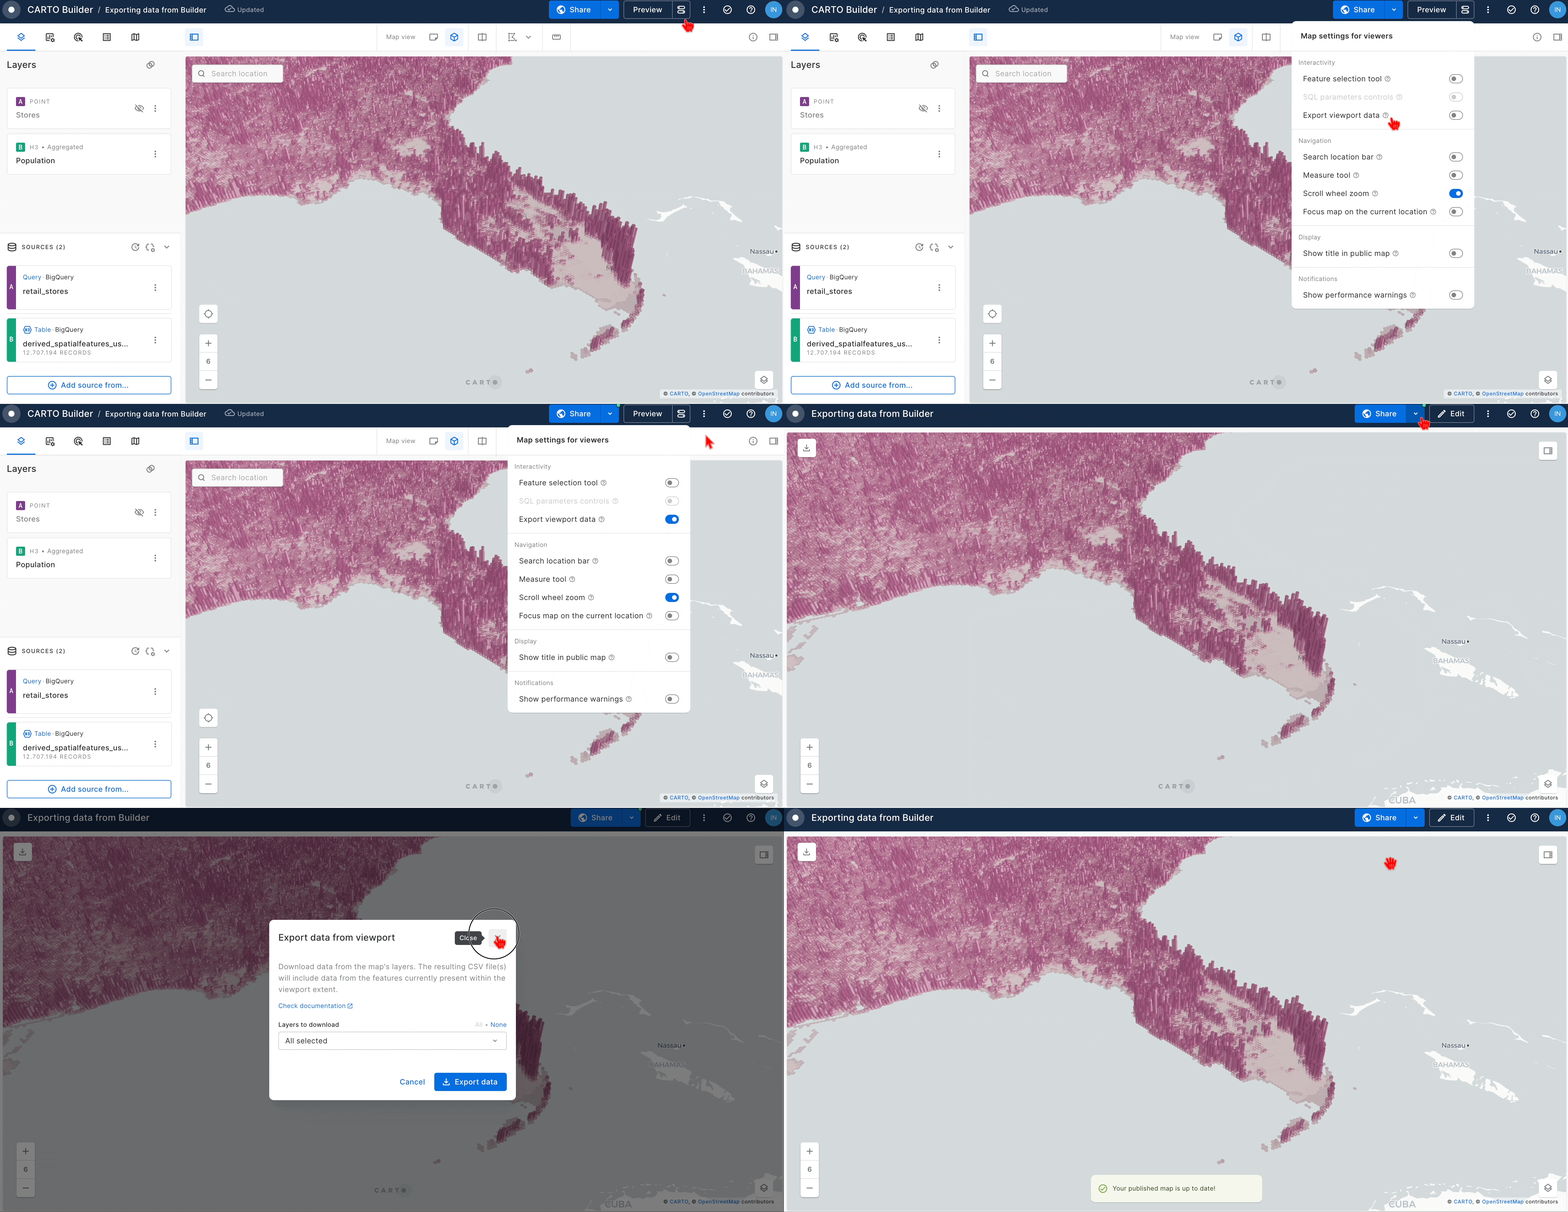
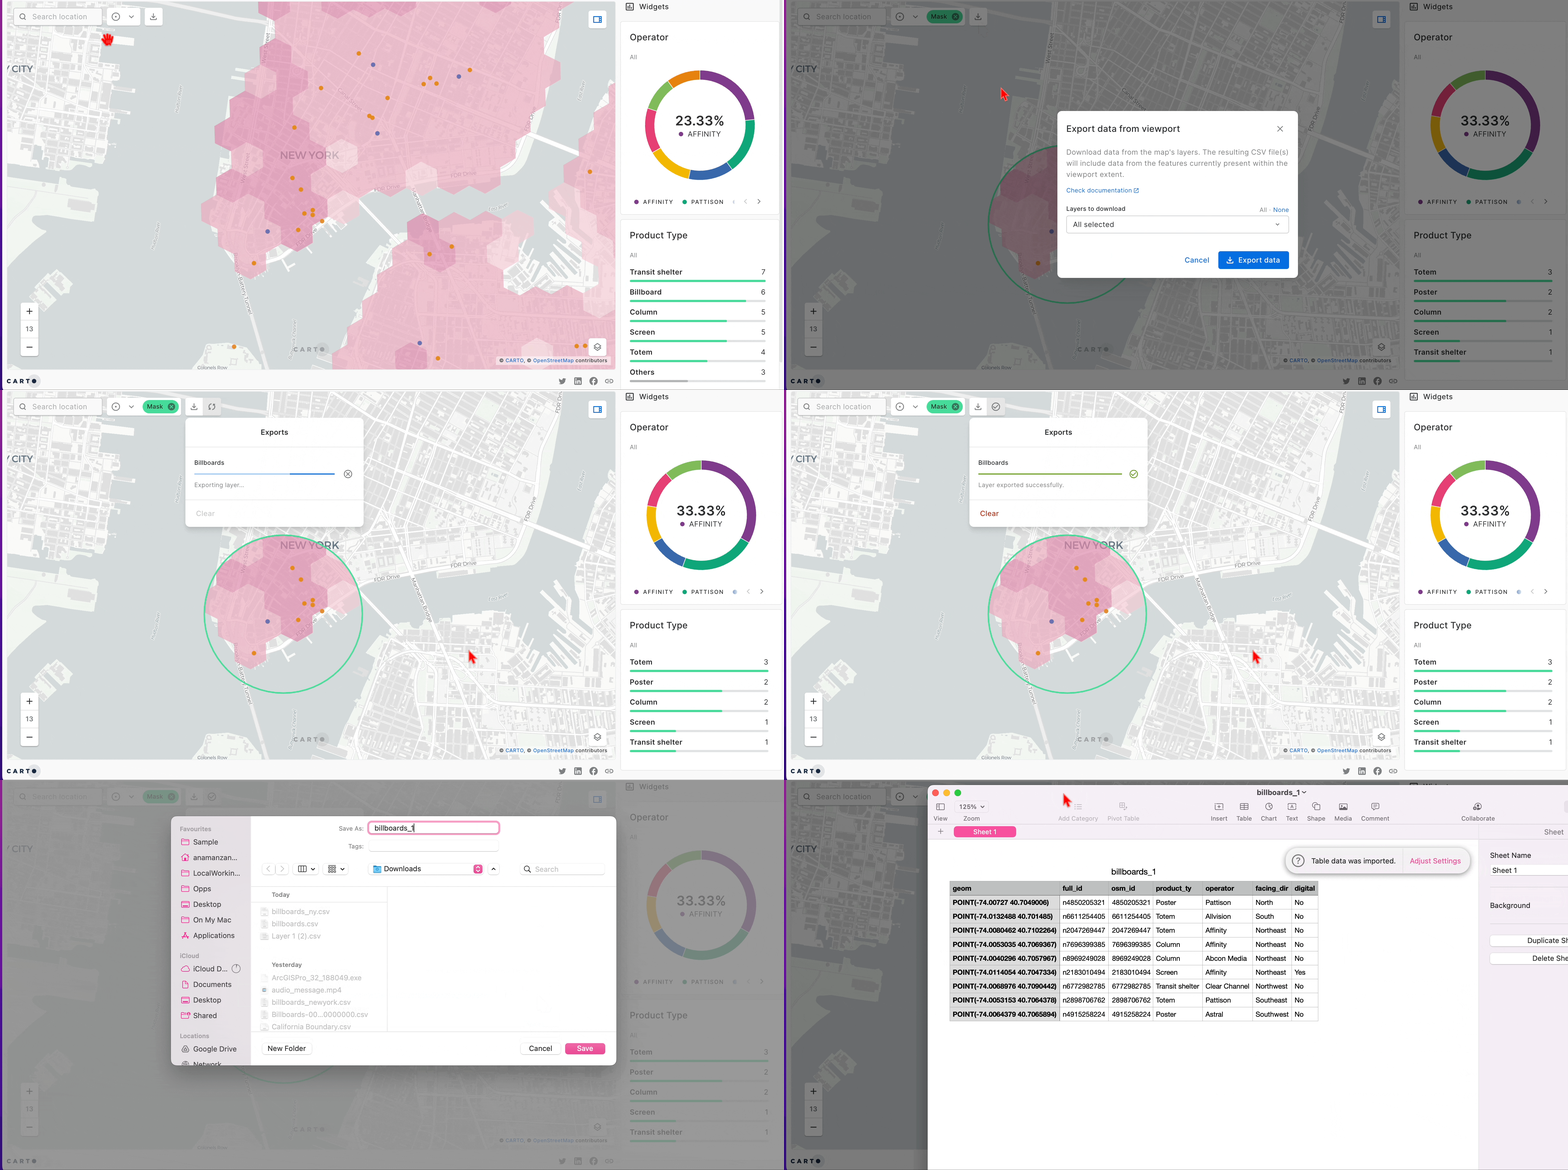
Data exports in Builder are now more flexible and more governed. Beyond CSV, you can export to **GeoJSON**, **Shapefile**, **GeoParquet** and **KML**, so you can take a filtered dataset straight into the tools you already use without any manual conversion.

As an Editor, you stay in control of what leaves your map: choose which sources are exportable, whitelist the columns that can be exported so sensitive attributes stay in your warehouse, and set the formats available per source. Every export honors the current map state, so filters, SQL parameters and the viewport are all respected.

Learn more in our [Exporting data documentation](/carto-user-manual/maps/exporting-data).

<figure><img src="/files/CjSzEVkU2kJMHg9yBLIP" alt=""><figcaption></figcaption></figure>
{% endupdate %}

{% update date="2026-07-03" tags="new,workspace" %}

## Organize your maps and workflows with projects and folders

You can now organize your maps and workflows into **projects and folders** instead of one flat list. Group related work together, nest folders as deep as you need, and move or create maps and workflows right where they belong.

Projects keep your Workspace tidy and make collaboration easier: share a project or folder once and everything inside inherits those access permissions. You set permissions in one place instead of doing it asset by asset. When an asset belongs in more than one project, add a shortcut instead of moving it.

Learn more in the [Projects](/carto-user-manual/projects) documentation.

<figure><img src="/files/HIOyvpbvkPc1BrBgl67z" alt=""><figcaption></figcaption></figure>
{% endupdate %}

{% update date="2026-07-03" tags="new,platform" %}

## More flexible sharing for maps and workflows

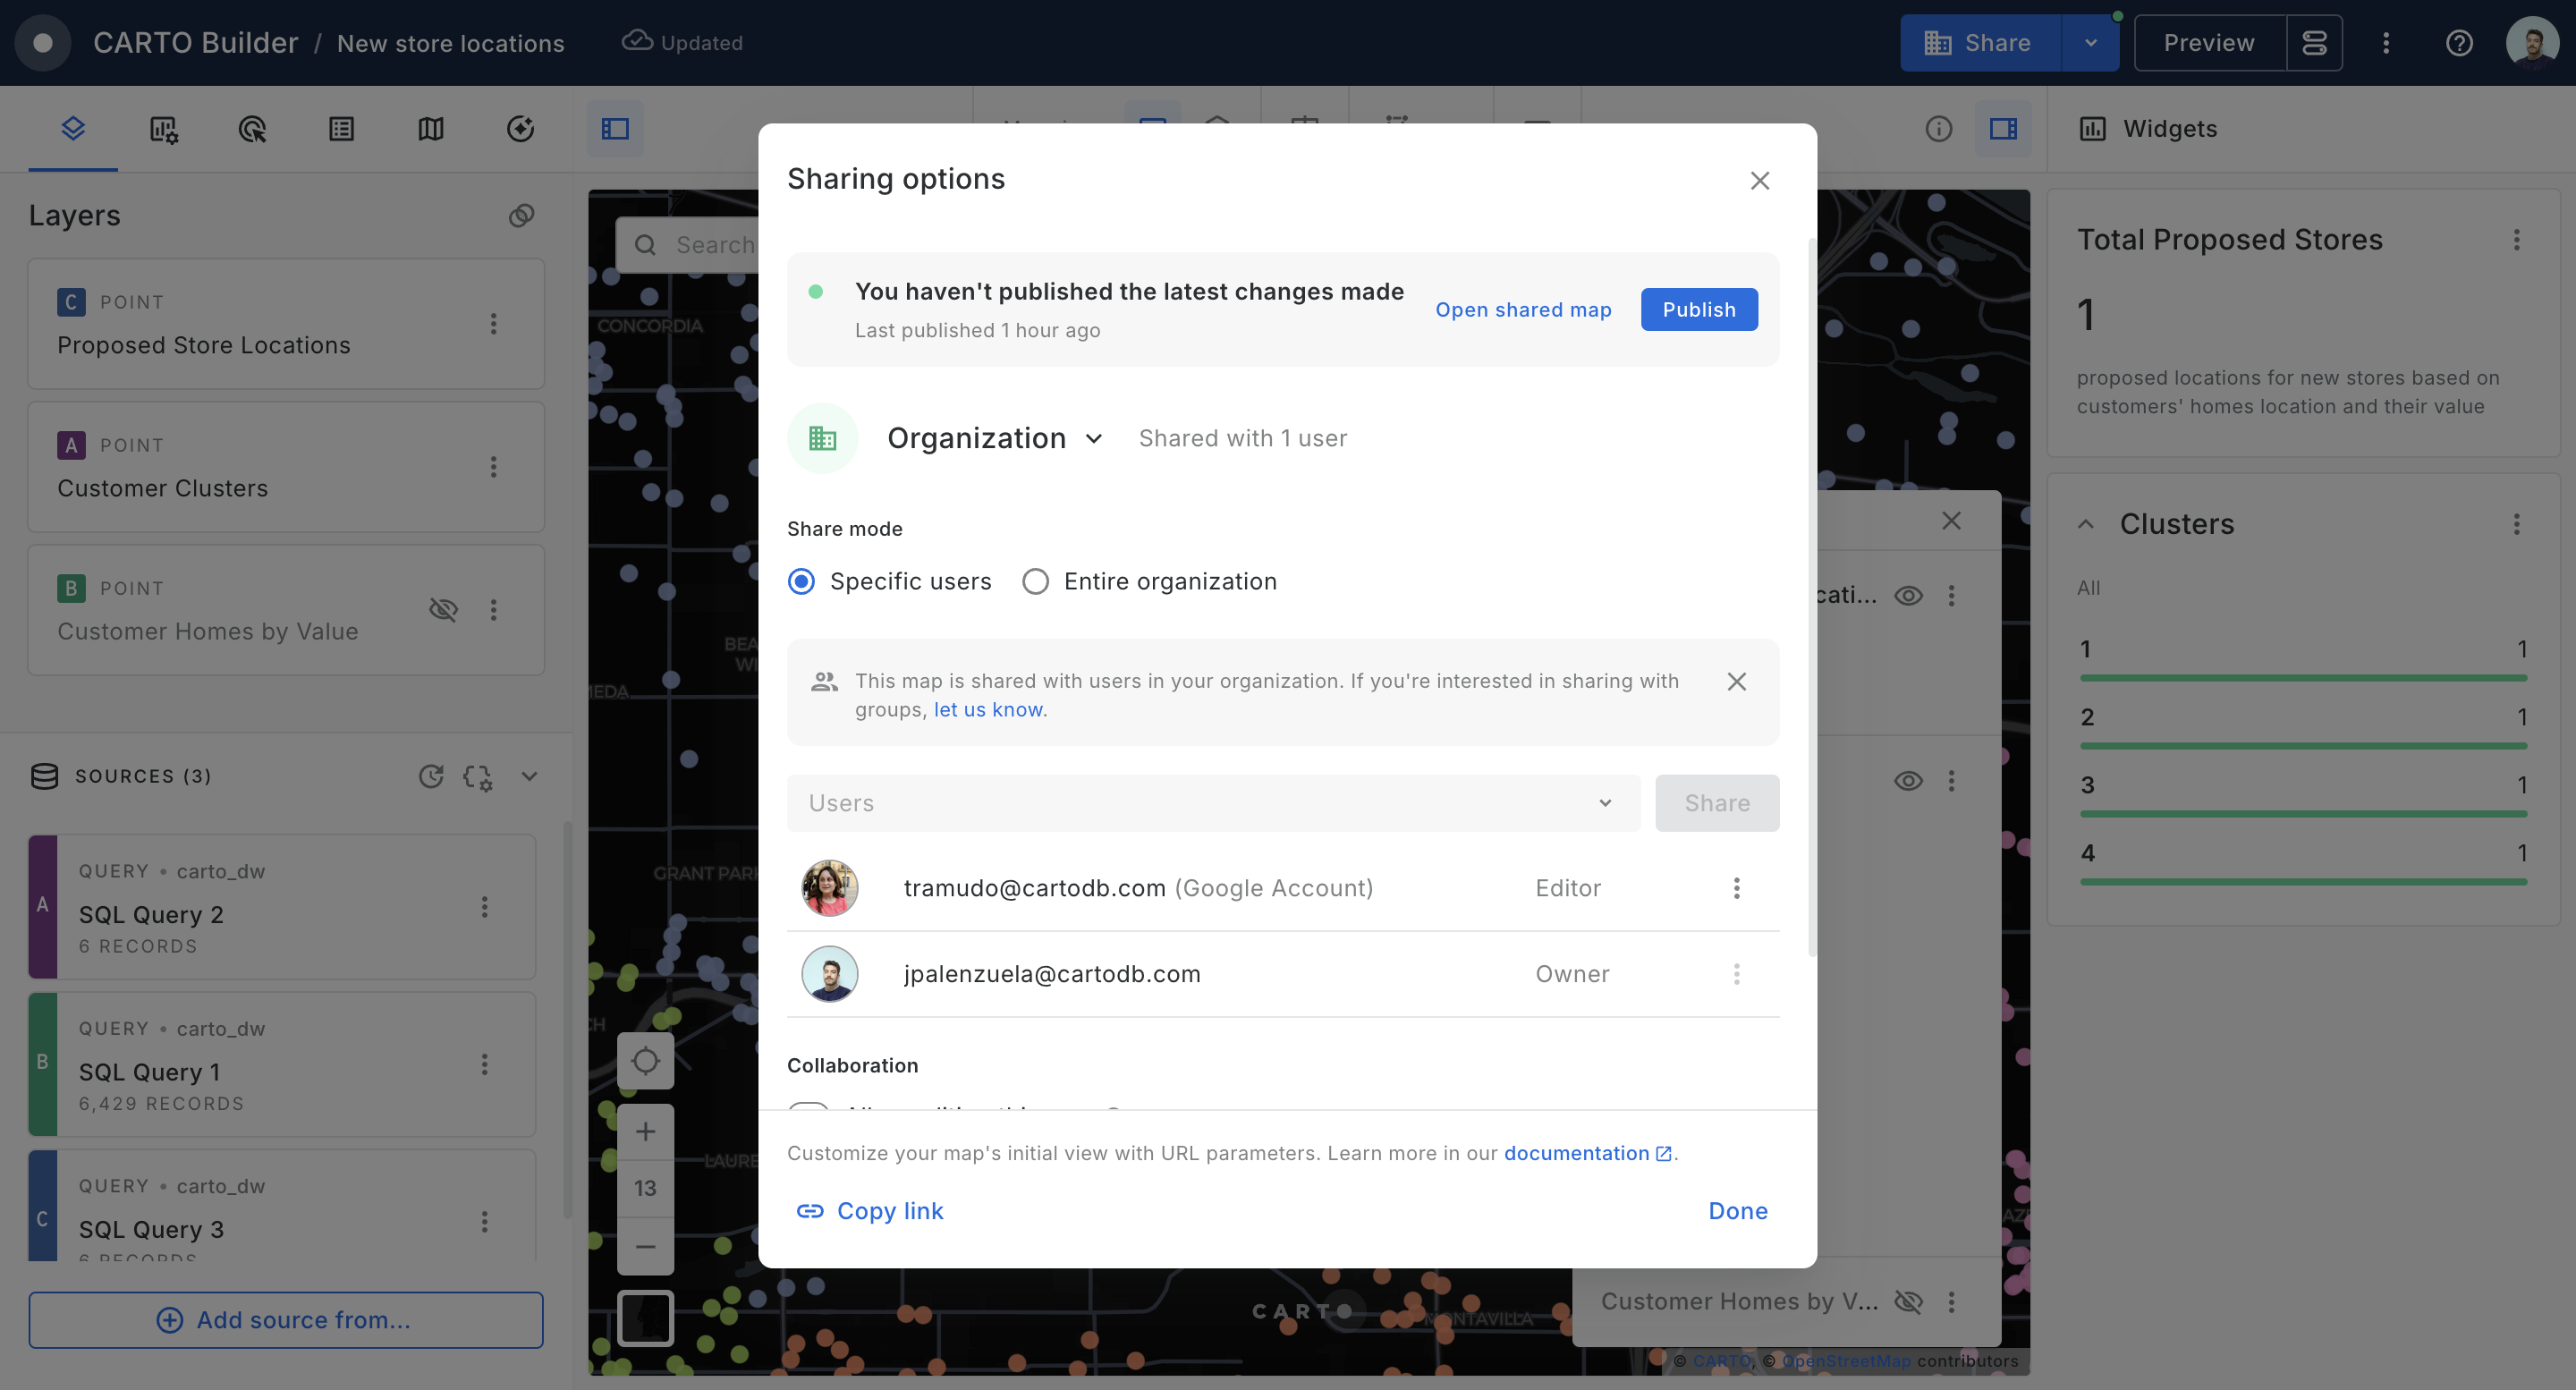
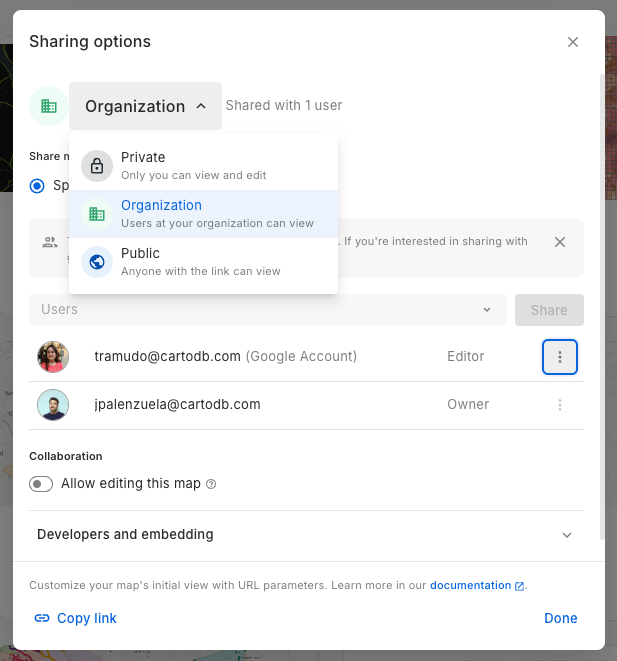
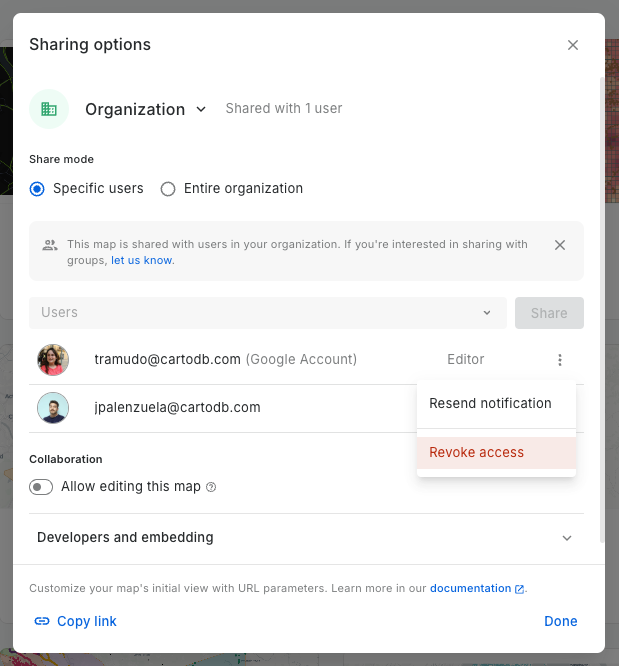
Sharing maps and workflows is now more flexible. Share assets with specific people or groups, with your whole organization, or publicly, and switch between those modes in a single click.

Switching keeps the people and groups you already added with the same access permissions, so you never set anything up twice. Projects and folders share the same flexiblity: share once, and every asset inside a project or folder inherits that access.

Learn more in the [map sharing](/carto-user-manual/maps/sharing-and-collaboration) and [workflow sharing](/carto-user-manual/workflows/sharing-workflows) documentation.

<figure><img src="/files/1uzWY1OMHOvQBD0m1sTi" alt=""><figcaption></figcaption></figure>
{% endupdate %}

{% update date="2026-07-02" tags="builder,improvement" %}

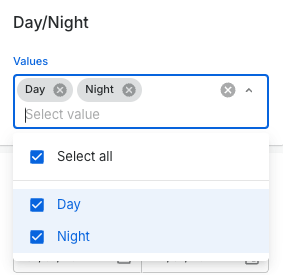
## Single-select mode for text parameters

Text parameters in Builder can now be set to single value instead of always allowing multiple selections. Viewers pick exactly one option from a radio list, and you decide which value is selected by default.

Single-select fits any map that should answer for one thing at a time: a single product line, region, store, audience segment, or scenario in a what-if comparison. The viewer picks one option and the map returns one clear, correct result.

Learn more in the [Text parameter](/carto-user-manual/maps/sql-parameters/text-parameter) documentation.

<figure><img src="/files/FvhvlyegGDDTuQhiS1tS" alt=""><figcaption></figcaption></figure>
{% endupdate %}

{% update date="2026-07-01" tags="builder,improvement" %}

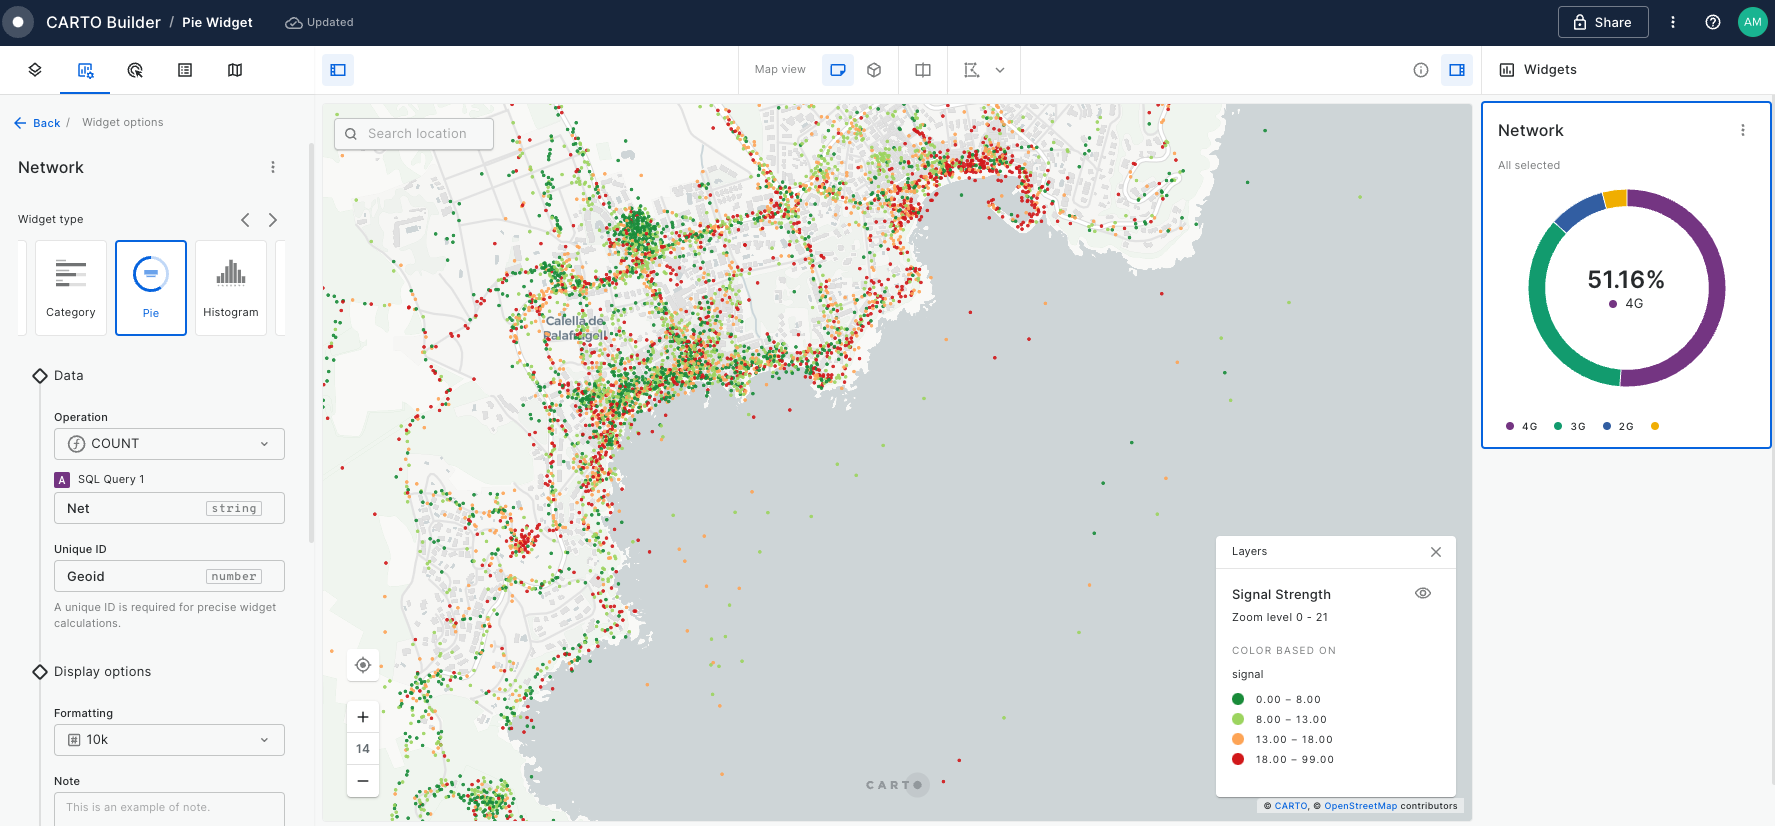
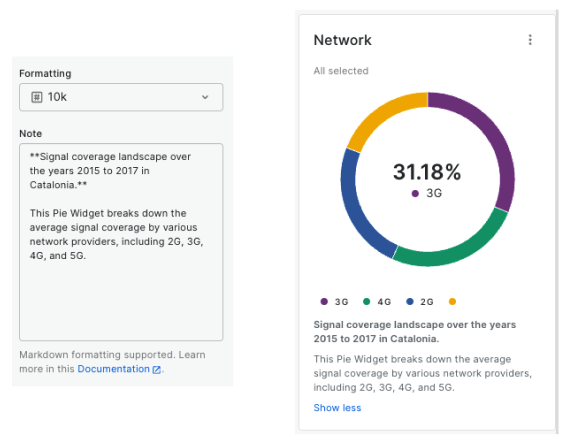
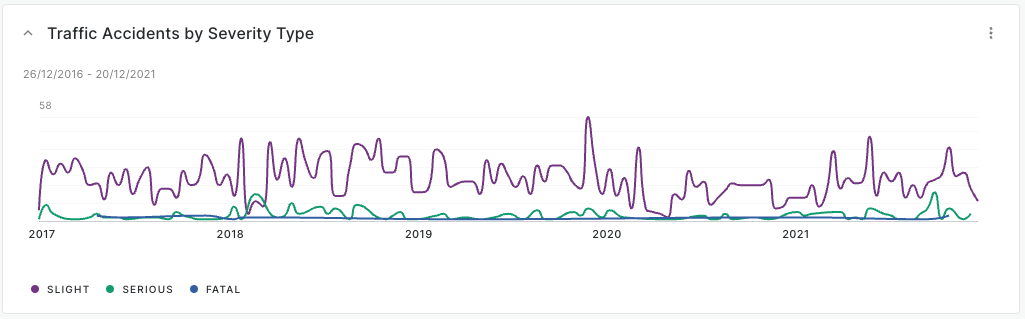
## Pie and Time Series widgets now sync with your layer colors

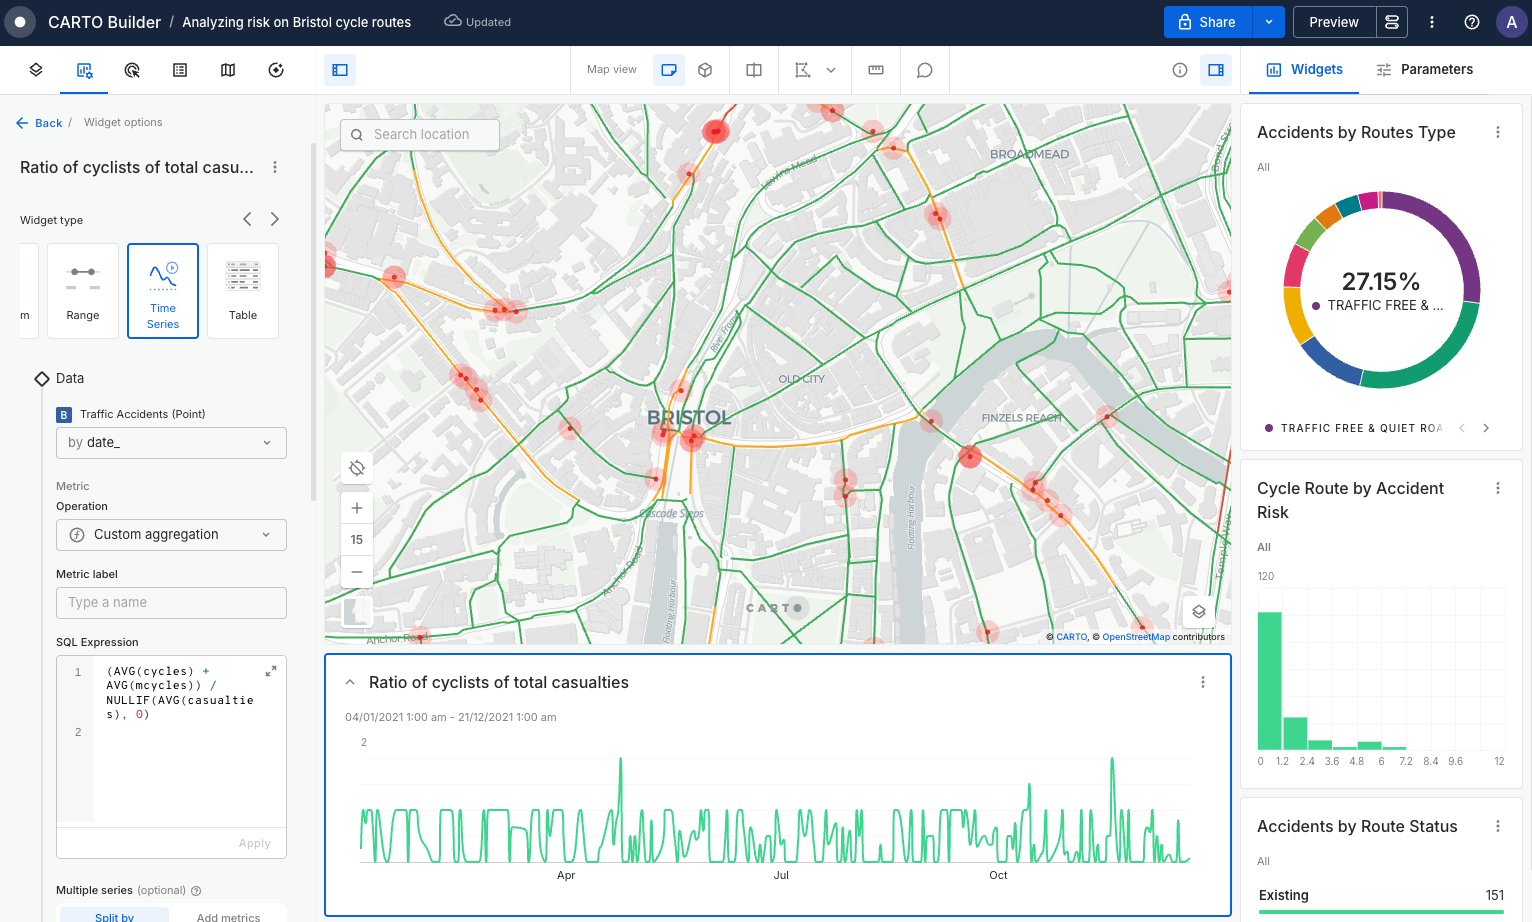
Pie and Time Series widgets in Builder can now inherit the colors of the layer they visualize. When a widget uses the same column your layer is styled by, it automatically picks up the layer's category colors, so the widget, the map, and the legend all match, with no extra setup. A category shown in purple on the map is purple in the widget too.

Colors are now stable within a session as well: even without a layer match, each category keeps its color as you zoom, pan, and filter, instead of shifting with the data order. This applies to the Pie widget and to the Time Series widget with Split by.

Learn more in the [Pie widget](/carto-user-manual/maps/widgets/pie-widget) and [Time Series widget](/carto-user-manual/maps/widgets/time-series-widget) documentation.

<figure><img src="/files/MEjjDb3UbjZ4U5ij4JEt" alt=""><figcaption></figcaption></figure>
{% endupdate %}

{% update date="2026-06-29" tags="new,builder" %}

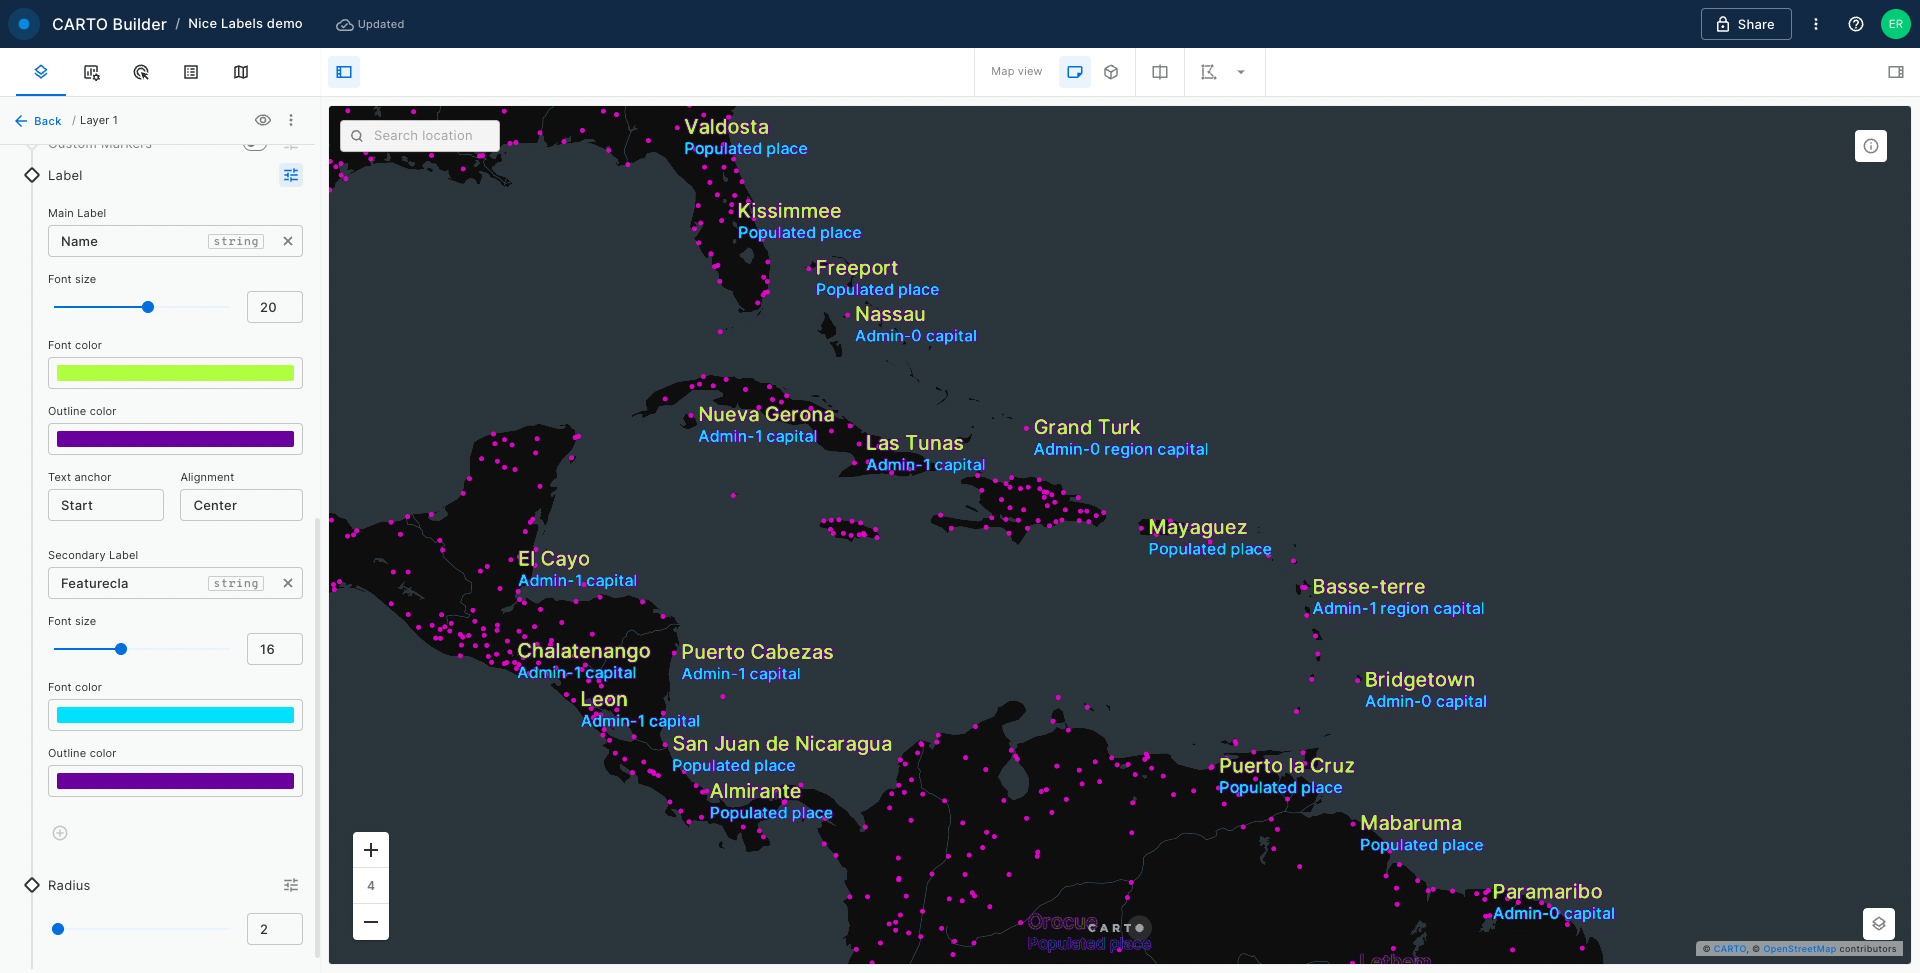
## Labels for polygons and lines in Builder

You can now add text labels directly to polygon and line layers, not just points. Turn labels on from the **Labels** section of the layer panel and choose the column to display. CARTO places each label automatically, at the center of every polygon and along the middle of every line. For lines, you can also pick a unique ID column so a feature that crosses several tiles, like a long road, shows a single label instead of one per tile.

Learn more in our [Layers documentation](/carto-user-manual/maps/layers#labels).

<figure><img src="/files/9KYk4tCb1TYeAbCDQfto" alt=""><figcaption></figcaption></figure>
{% endupdate %}

{% update date="2026-06-29" tags="new,platform" %}

## The latest AI models are now in CARTO

CARTO AI now offers the latest generation of models across every supported provider. The CARTO-managed set adds `claude-opus-4.8`, our most capable model for the hardest geospatial reasoning, and `gemini-3.5-flash` for fast, high-volume interactions.

If you bring your own provider, the newest models are available too: the GPT-5.5 and GPT-5.4 families on OpenAI, Azure, Snowflake and Databricks, `claude-opus-4.8` on Anthropic, Bedrock, Vertex AI, Snowflake and Databricks, `gemini-3.5-flash` on Vertex AI, Google AI Studio and Databricks, and xAI Grok 4.3 and 4.20 on Oracle.

Learn more in the [CARTO AI settings](/carto-user-manual/settings/carto-ai) documentation.

<figure><img src="/files/oPW1f1c9fMERhhbFwZno" alt=""><figcaption></figcaption></figure>
{% endupdate %}

{% update date="2026-06-25" tags="new,builder" %}

## Organize your layers into groups in Builder

You can now organize the layers in your map into named, collapsible **groups**. Related layers fold into tidy sections in the layer panel, so a map with a long list of layers stays easy to read and work with.

Group layers however makes sense for your map, collapse the ones you're not using, and turn a whole group's visibility on or off in one click.

Learn more in our [Layers documentation](/carto-user-manual/maps/layers#layer-groups).

<figure><img src="/files/hHoqFClcMxWsfUEjP4bZ" alt=""><figcaption></figcaption></figure>
{% endupdate %}

{% update date="2026-06-12" tags="improvement,ai-agents" %}

## AI Agents are more visible and accessible in your maps

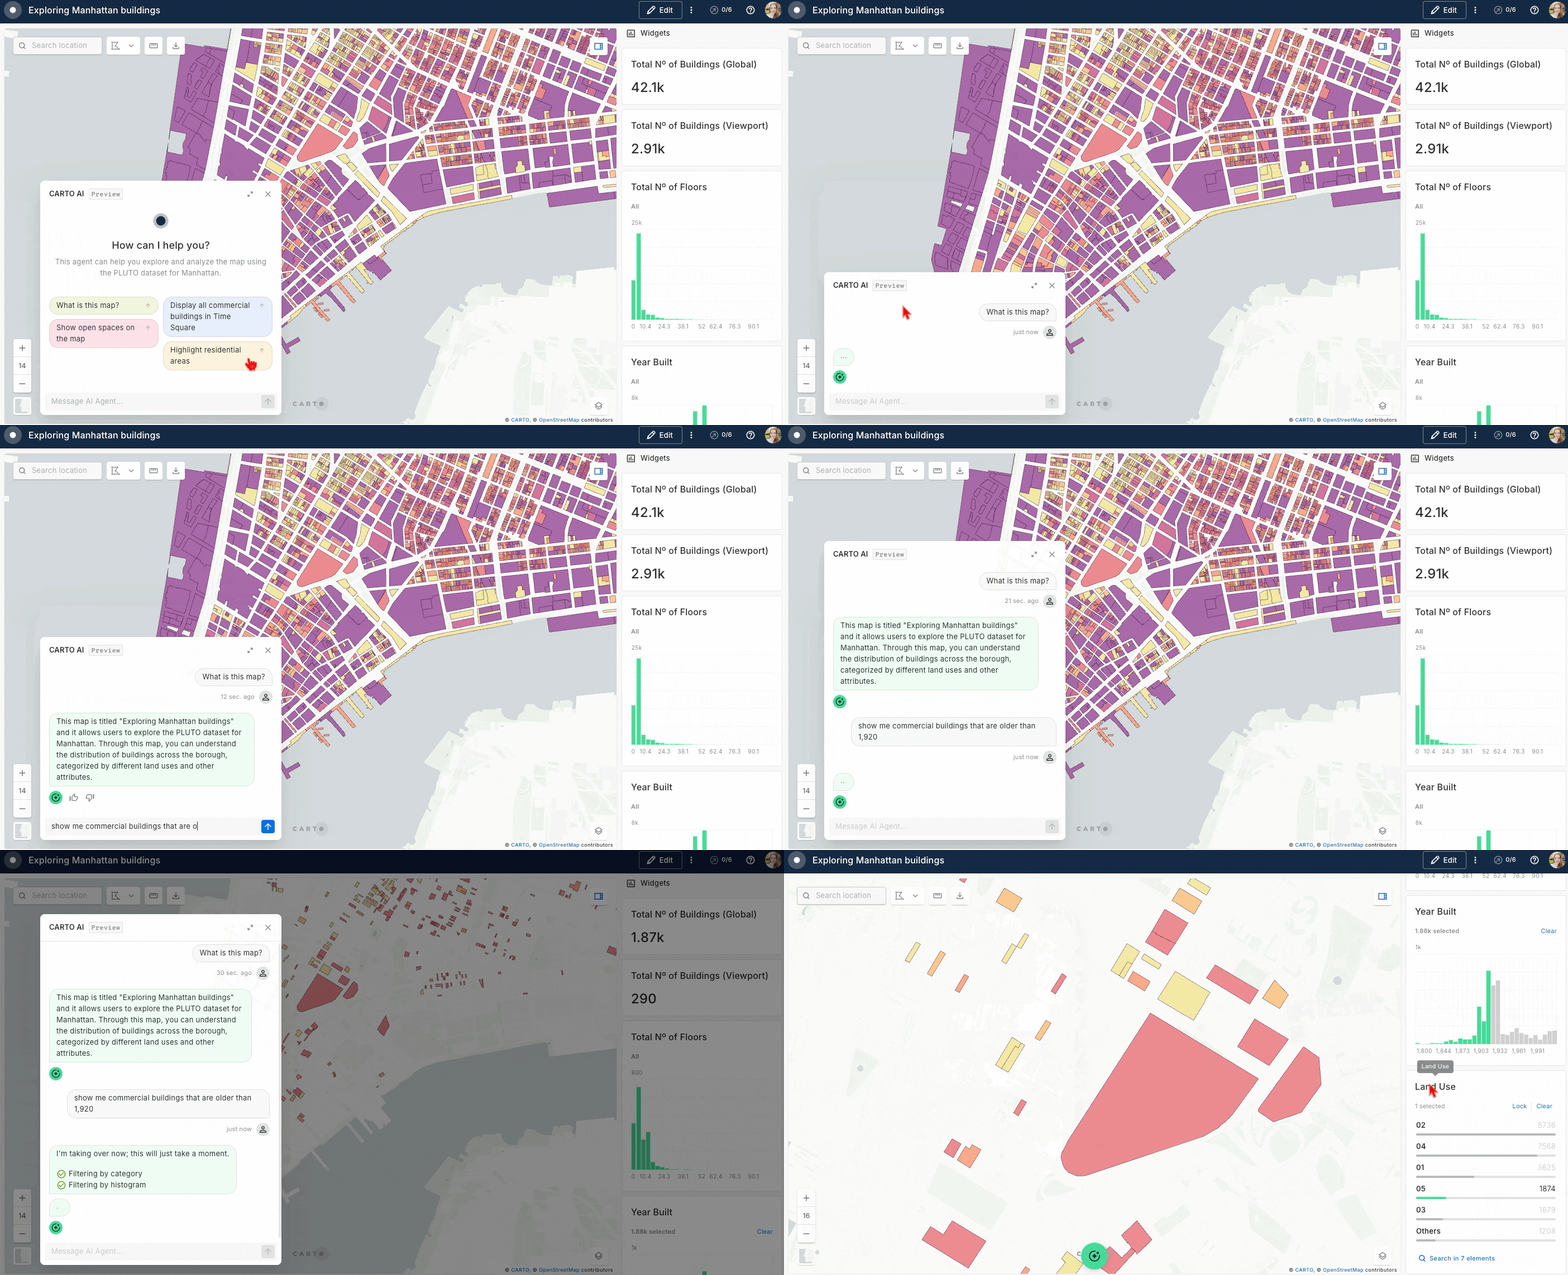
The AI Agent in your published maps now has a more prominent place in the interface. Instead of a button users had to find and click, the Agent is immediately visible alongside the map when it loads — making it easier for your users to start a conversation and get answers right away.

Users can also expand the Agent for a more focused conversation when they need it.

Learn more about [sharing your AI Agent](/carto-user-manual/ai-agents/sharing-your-agent) and [creating AI Agents](/carto-user-manual/ai-agents) in our documentation.

<figure><img src="/files/oNWqYoZd7XYulcToawNa" alt=""><figcaption></figcaption></figure>
{% endupdate %}

{% update date="2026-06-05" tags="new,platform" %}

## Bring any custom AI provider, proxy or gateway to CARTO

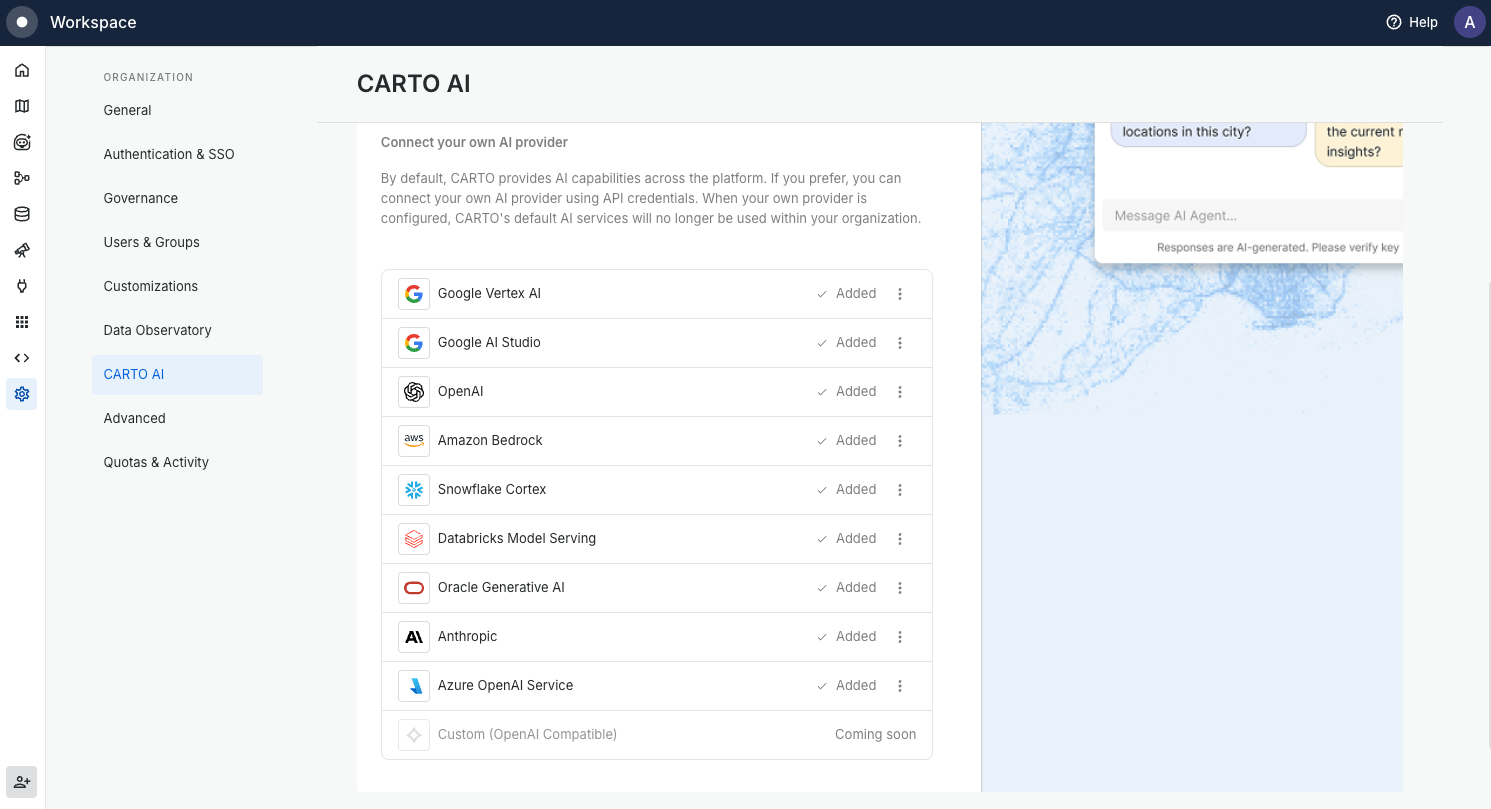
CARTO already supports nine AI providers out of the box — including Google Vertex AI, OpenAI, Anthropic, AWS Bedrock, Azure OpenAI, Snowflake, Databricks, and Oracle. Now you can connect any OpenAI-compatible endpoint as well, whether that's an LLM gateway or your own self-hosted models.

Connect one or more providers, and their models become available across CARTO's AI features — [AI Agents](/carto-user-manual/ai-agents), the [Agent Config Assistant](/carto-user-manual/ai-agents/agent-config-assistant), and the [AI Assistant in Data Observatory](/carto-user-manual/data-observatory/accessing-and-browsing-the-spatial-data-catalog).

Learn more in the [CARTO AI settings](/carto-user-manual/settings/carto-ai) documentation.

<figure><img src="/files/DqFHbiPc8O3L2vv7zZ88" alt=""><figcaption></figcaption></figure>
{% endupdate %}

{% update date="2026-06-03" tags="new,ai-agents" %}

## Full visibility into your AI Agent's behavior

Get full visibility into your AI Agent's actions with new **tool traceability**. You can now see which tools were executed, the parameters used, and their outputs, all directly in the conversation. Inspect the SQL generated by `execute_query`, the arguments passed to a [Workflows MCP Tool](/carto-user-manual/workflows/workflows-as-mcp-tools), or the inputs of any other tool the Agent ran, so you know exactly how the Agent reached its answer.

Learn more about the [tools available for AI Agents](/carto-user-manual/ai-agents/working-with-tools) in our documentation.

<figure><img src="/files/0cxtyuCH3kIrYD2xuodi" alt=""><figcaption></figcaption></figure>
{% endupdate %}

{% update date="2026-05-27" tags="new,analytics-toolbox" %}

## New modules in the Analytics Toolbox for Oracle

The [Analytics Toolbox for Oracle](/data-and-analysis/analytics-toolbox-for-oracle) (v1.1.0) expands its capabilities on Oracle Autonomous Database with three new modules. The new [`data`](/data-and-analysis/analytics-toolbox-for-oracle/sql-reference/data) module brings **data enrichment** to Oracle, with the [ENRICH\_POINTS](/data-and-analysis/analytics-toolbox-for-oracle/sql-reference/data#enrich_points), [ENRICH\_POLYGONS](/data-and-analysis/analytics-toolbox-for-oracle/sql-reference/data#enrich_polygons), [ENRICH\_POLYGONS\_WEIGHTED](/data-and-analysis/analytics-toolbox-for-oracle/sql-reference/data#enrich_polygons_weighted) and [ENRICH\_GRID](/data-and-analysis/analytics-toolbox-for-oracle/sql-reference/data#enrich_grid) procedures (plus their `_RAW` variants), so you can augment your spatial data with variables from other datasets directly in SQL.

This release also adds the [`h3`](/data-and-analysis/analytics-toolbox-for-oracle/sql-reference/h3) and [`quadbin`](/data-and-analysis/analytics-toolbox-for-oracle/sql-reference/quadbin) **spatial indexing** modules. The `h3` module brings the full set of H3 functions to Oracle, covering index conversion ([H3\_FROMGEOGPOINT](/data-and-analysis/analytics-toolbox-for-oracle/sql-reference/h3#h3_fromgeogpoint), [H3\_BOUNDARY](/data-and-analysis/analytics-toolbox-for-oracle/sql-reference/h3#h3_boundary), [H3\_CENTER](/data-and-analysis/analytics-toolbox-for-oracle/sql-reference/h3#h3_center)), hierarchy traversal ([H3\_TOPARENT](/data-and-analysis/analytics-toolbox-for-oracle/sql-reference/h3#h3_toparent) / [H3\_TOCHILDREN](/data-and-analysis/analytics-toolbox-for-oracle/sql-reference/h3#h3_tochildren)), neighborhood traversal ([H3\_KRING](/data-and-analysis/analytics-toolbox-for-oracle/sql-reference/h3#h3_kring)) and polygon-to-grid conversion ([H3\_POLYFILL](/data-and-analysis/analytics-toolbox-for-oracle/sql-reference/h3#h3_polyfill)), so you can index, aggregate and analyze your data on hexagonal grids natively in Oracle. The `quadbin` module provides the equivalent set of functions for the Quadbin grid.

Learn more in the [Analytics Toolbox for Oracle release notes](/data-and-analysis/analytics-toolbox-for-oracle/release-notes) and the [SQL reference](/data-and-analysis/analytics-toolbox-for-oracle/sql-reference).
{% endupdate %}

{% update date="2026-05-27" tags="new,analytics-toolbox" %}

## New capabilities in the Analytics Toolbox for Databricks

The [Analytics Toolbox for Databricks](/data-and-analysis/analytics-toolbox-for-databricks) (v2.4.0) extends its [`statistics`](/data-and-analysis/analytics-toolbox-for-databricks/reference/statistics) module with a new [HOTSPOT\_ANALYSIS](/data-and-analysis/analytics-toolbox-for-databricks/reference/statistics#hotspot_analysis) procedure. It locates hotspot areas by combining several variables' [Getis-Ord Gi\*](/data-and-analysis/analytics-toolbox-for-databricks/reference/statistics#getis_ord_h3) statistics using Stouffer's method, and works on either H3 or Quadbin grids.

The Analytics Toolbox for Databricks also includes a [`data`](/data-and-analysis/analytics-toolbox-for-databricks/reference/data) module for **data enrichment**, with the [ENRICH\_POINTS](/data-and-analysis/analytics-toolbox-for-databricks/reference/data#enrich_points), [ENRICH\_POLYGONS](/data-and-analysis/analytics-toolbox-for-databricks/reference/data#enrich_polygons), [ENRICH\_POLYGONS\_WEIGHTED](/data-and-analysis/analytics-toolbox-for-databricks/reference/data#enrich_polygons_weighted) and [ENRICH\_GRID](/data-and-analysis/analytics-toolbox-for-databricks/reference/data#enrich_grid) procedures (plus their `_RAW` variants), so you can augment your spatial data with variables from other datasets directly in SQL.

Learn more in the [Analytics Toolbox for Databricks release notes](/data-and-analysis/analytics-toolbox-for-databricks/release-notes) and the [SQL reference](/data-and-analysis/analytics-toolbox-for-databricks/reference).
{% endupdate %}

{% update date="2026-05-26" tags="new,workflows" %}

## Version history in Workflows

Workflows now keep a complete **version history**. CARTO automatically captures versions as you work, and you can also save named versions to mark important milestones. Each time you enable or update an execution method — a schedule, an API endpoint, an MCP Tool, or Viewer mode — that snapshot is recorded and marked as the **published version** for that method, so consumers keep running against a stable state while you keep editing.

From the Version History dialog you can browse, search, and filter past versions, preview each one on the canvas, restore the workflow to an earlier state, or duplicate a new workflow from any historical version.

Learn more in our [Version history documentation](/carto-user-manual/workflows/version-history).

{% embed url="<https://vimeo.com/1195581910?autoplay=1&share=copy>" %}
{% endupdate %}

{% update date="2026-05-26" tags="new,workspace" %}

## Usage attribution by map and workflow

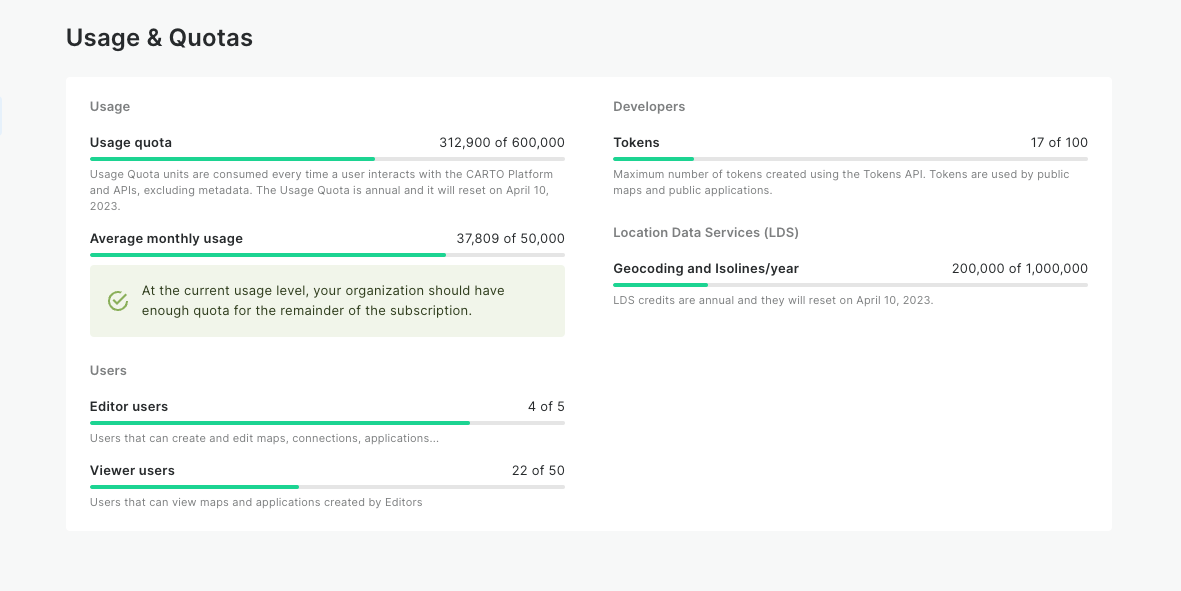
Admins can now see which specific **maps and workflows** are consuming their [Usage Quota](/carto-user-manual/settings/understanding-your-organization-quotas). The [Activity Data](/carto-user-manual/settings/activity-data) export now includes `map_id` and `workflow_id` columns in the API Usage table, making it easy to understand where your Usage Quota is going, identify high-cost maps and workflows, and tie consumption back to specific teams or projects.

Learn more in our [Activity Data reference](/carto-user-manual/settings/activity-data/activity-data-reference#api-usage).

<figure><img src="/files/hiQ8wgZbrGnPSXwNSG20" alt=""><figcaption></figcaption></figure>
{% endupdate %}

{% update date="2026-05-20" tags="new,workspace" %}

## Wildcard patterns in API Access Token grants

API Access Tokens now accept **wildcard patterns** in the **Table, Tileset, Raster source or Pattern** grant. Instead of listing resources one by one, you can use `*` to match multiple resources at once, for example `carto.shared.*` to cover everything under `carto.shared` or `carto.shared.CARTO_*` to cover only resources that share a naming convention. Patterns also match resources created after the token was issued, so you no longer need to re-issue tokens when new tables land.

Learn more in our [API Access Tokens documentation](/carto-user-manual/developers/managing-credentials/api-access-tokens#wildcard-patterns).

<figure><img src="/files/4nKb0t4kUmfAAobakSyf" alt=""><figcaption></figcaption></figure>
{% endupdate %}

{% update date="2026-05-21" tags="new,workspace" %}

## Granular controls for CARTO AI features

Organization Admins can now control CARTO AI at the feature level from **Settings > CARTO AI**. In addition to the organization-wide **Enable CARTO AI** toggle, each individual AI feature has its own switch and its own default model selector. The granular controls currently cover **AI Agents in Builder maps** and the new **AI Assistant in Data Observatory**, with more features to follow.

The per-feature default model overrides the organization-wide default for that specific feature, so different capabilities can run on different models. Newly introduced features are disabled by default, so Admins need to enable them explicitly before they become available to users.

Learn more in our [CARTO AI settings documentation](/carto-user-manual/settings/carto-ai#ai-features).

<figure><img src="/files/4ZKfR2rgOCXDboL5zM5b" alt=""><figcaption></figcaption></figure>
{% endupdate %}

{% update date="2026-05-21" tags="new,data-observatory" %}

## AI Assistant in Data Observatory

Finding the right dataset in the Spatial Data Catalog now takes a sentence instead of a series of filter clicks. The new **AI Assistant in Data Observatory** lets you describe what you need in natural language and applies the matching filters to the catalog for you.

Open the assistant with the **Ask AI** button at the top of the Data Observatory catalog, ask something like *"What datasets would help analyze consumer purchasing patterns in the UK?"*, and the sidebar will filter the catalog down to the datasets that fit. You can keep iterating in the same conversation to refine the results or change direction, and manual filters remain available at any time.

Learn more in our [Browsing the Spatial Data Catalog documentation](/carto-user-manual/data-observatory/accessing-and-browsing-the-spatial-data-catalog#ai-assistant-in-data-observatory).

<figure><img src="/files/bjmC3vXHTZt1GkB60Lvi" alt=""><figcaption></figcaption></figure>
{% endupdate %}

{% update date="2026-05-19" tags="new,builder" %}

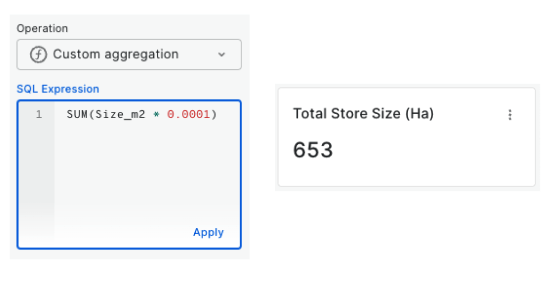
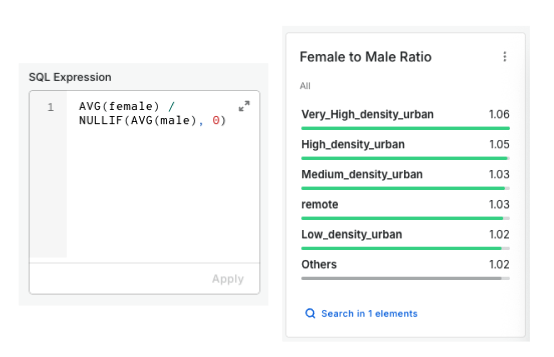
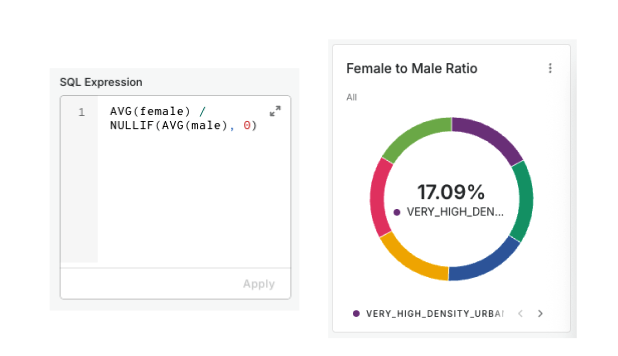
## Custom SQL aggregation expressions in Builder

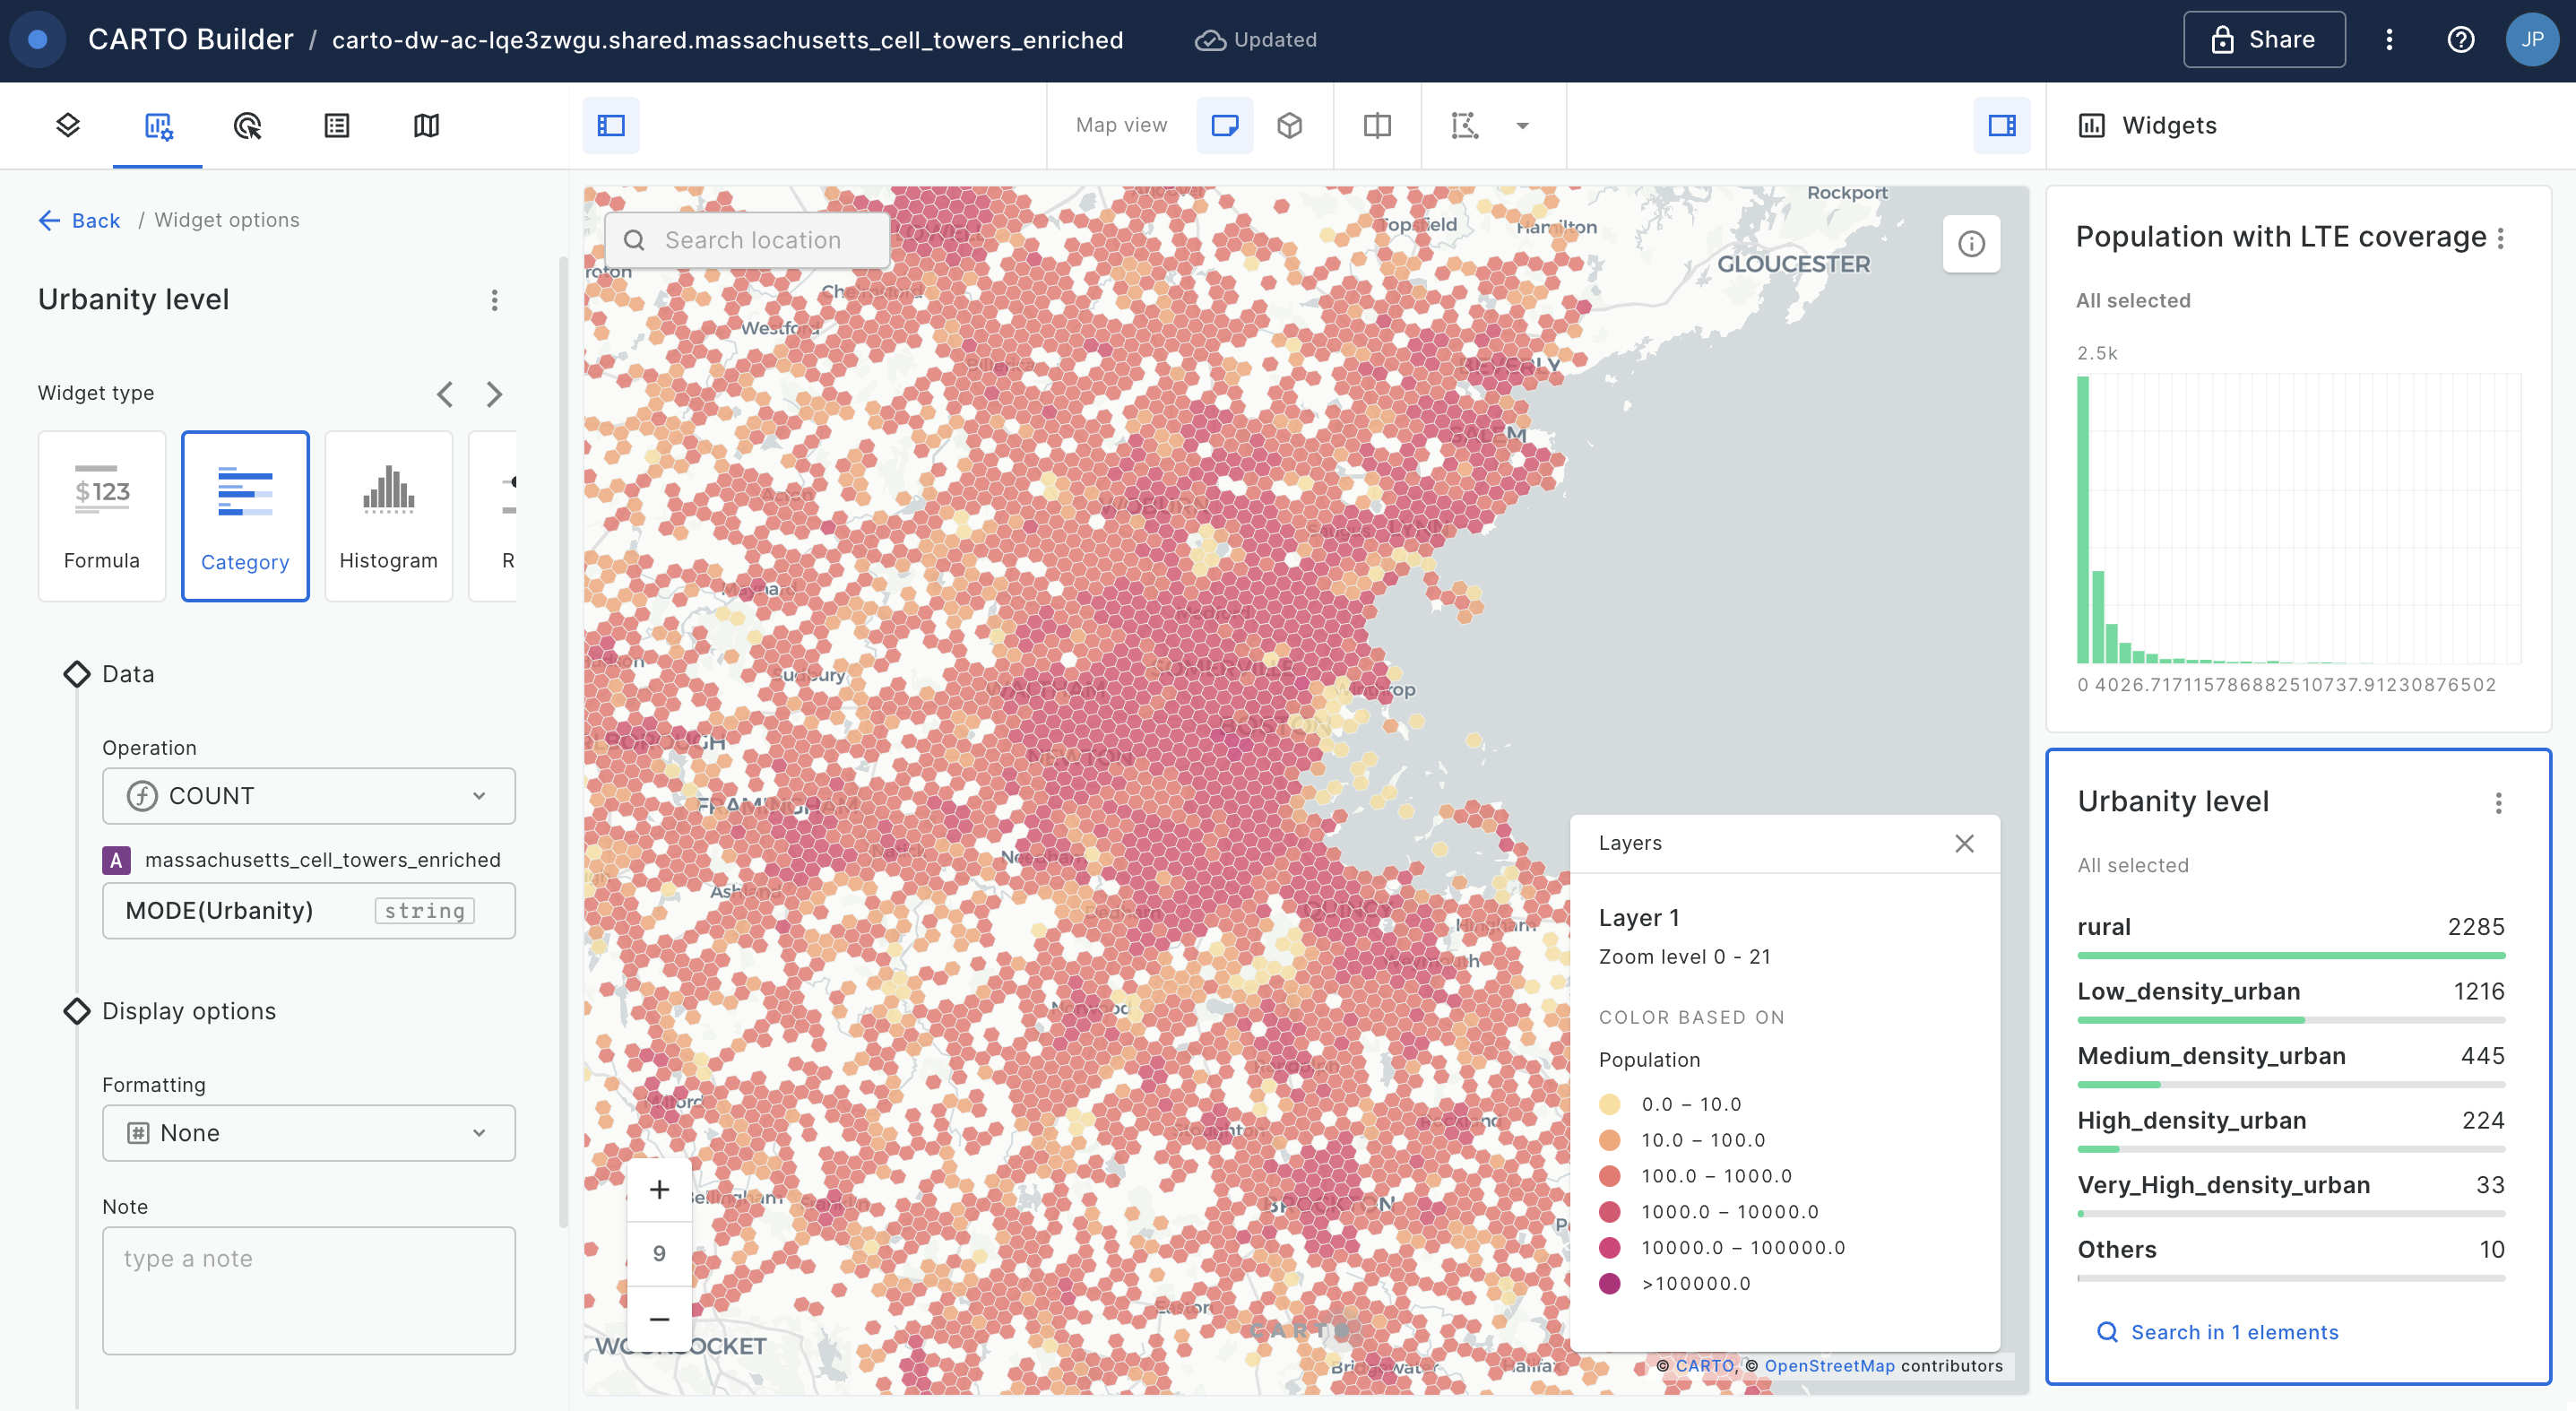
Spatial index layers (H3, Quadbin) and aggregated-by-geometry layers in Builder now support **custom SQL aggregation expressions** for styling and interactions. Apart from the predefined `avg`, `sum`, `min`, `max` set, you can write any aggregation expression that runs on your data warehouse. This is useful for derived metrics like rates, ratios and weighted averages.

```sql
SUM(female) / NULLIF(SUM(population), 0)
```

Learn more in our [H3 layer documentation](/carto-user-manual/maps/layers/h3#custom-aggregation-expressions).

<figure><img src="/files/rUHoFB56ytGul0v9Jx84" alt=""><figcaption></figcaption></figure>
{% endupdate %}

{% update date="2026-05-18" tags="improvement,builder" %}

## Scale point radius with zoom in Builder

Point layers in Builder now support a new **Scale with zoom level** option for radius. Instead of a fixed pixel size, points grow and shrink with the map zoom, staying visually proportional to context. A **Min / Max bounds** clamp keeps points readable at extreme zooms, and the option applies to both simple points and custom markers.

Learn more in our [Point layer documentation](/carto-user-manual/maps/layers/point#scale-with-zoom-level).

<figure><img src="/files/Cbrwt6Q66p5UpyA7Gmsd" alt=""><figcaption></figcaption></figure>
{% endupdate %}

{% update date="2026-05-14" tags="new,carto-for-agents" %}

## CARTO for Agents: bring the platform into your AI workflows

AI agents are quickly becoming part of how teams build with spatial data. We're launching **CARTO for Agents**, three new capabilities that put the entire CARTO platform within reach of the AI agents you already use: authoring Builder maps and Workflows, managing connections, browsing the Data Observatory, running imports and exports, and anything else you do day to day.

* [**CARTO CLI**](/carto-for-agents/cli). A script-friendly command-line for the platform that humans run in a terminal and agents call as a tool. The latest release adds first-class Builder map and Workflow authoring from JSON bundles.
* [**CARTO MCP Server**](/carto-for-agents/mcp-server). A hosted [Model Context Protocol](https://modelcontextprotocol.io/) server that exposes built-in CARTO tools, plus any workflow you publish, to web and desktop AI clients like Claude.ai, ChatGPT, and Gemini.
* [**CARTO Agent Skills**](/carto-for-agents/agent-skills). A public catalog of skill playbooks at [`CartoDB/agent-skills`](https://github.com/CartoDB/agent-skills) that teaches coding agents (Claude Code, Codex, Cursor, Gemini CLI) how to drive CARTO without re-discovering the API every session.

The three pieces work together depending on the scenario. A chat agent in Claude.ai, ChatGPT, or Gemini connects through the MCP Server. A coding agent in Claude Code, Cursor, or Codex combines the CLI with the Agent Skills, which teach it the right flags and patterns for each task. Learn more in our [CARTO for Agents documentation](/carto-for-agents/carto-for-agents).

<figure><img src="/files/LKJMNyc9BL3IPbgm8OUP" alt=""><figcaption></figcaption></figure>
{% endupdate %}

{% update date="2026-05-14" tags="new,workspace" %}

## CARTO AI Analytics for organization Admins

Organization Admins now have a dedicated **Analytics** tab in Settings > CARTO AI to see how CARTO AI is being used across the organization. The tab is split into three views: **All activity** with active users and consumption of your AI and agentic usage quotas, **CARTO Agents** with activity from AI Agents created in Builder, and **External Agents** with activity driven from external clients consuming CARTO through the MCP Server and the CARTO CLI.

Learn more in our [CARTO AI Analytics documentation](/carto-user-manual/settings/carto-ai/carto-ai-analytics).

<figure><img src="/files/2jhIP1ekwwLmGjMlGkNN" alt=""><figcaption></figcaption></figure>
{% endupdate %}

{% update date="2026-05-14" tags="new,workspace" %}

## Quota controls for organization Admins

Organization Admins can now cap how much of each quota a specific user or group is allowed to consume, directly from **Settings > Quotas & Activity > Quota Limits**. Limits can be set for the Usage quota, the Location Data Services quota, and the AI quota, and they are hard limits: once a user or group reaches the limit, they are blocked from consuming more of that quota until an Admin raises or removes the limit.

Learn more in our [Managing quotas documentation](/carto-user-manual/settings/managing-quotas).

<figure><img src="/files/HtAgnV2lvs3nHXqQw63U" alt=""><figcaption></figcaption></figure>
{% endupdate %}

{% update date="2026-05-08" tags="new,builder" %}

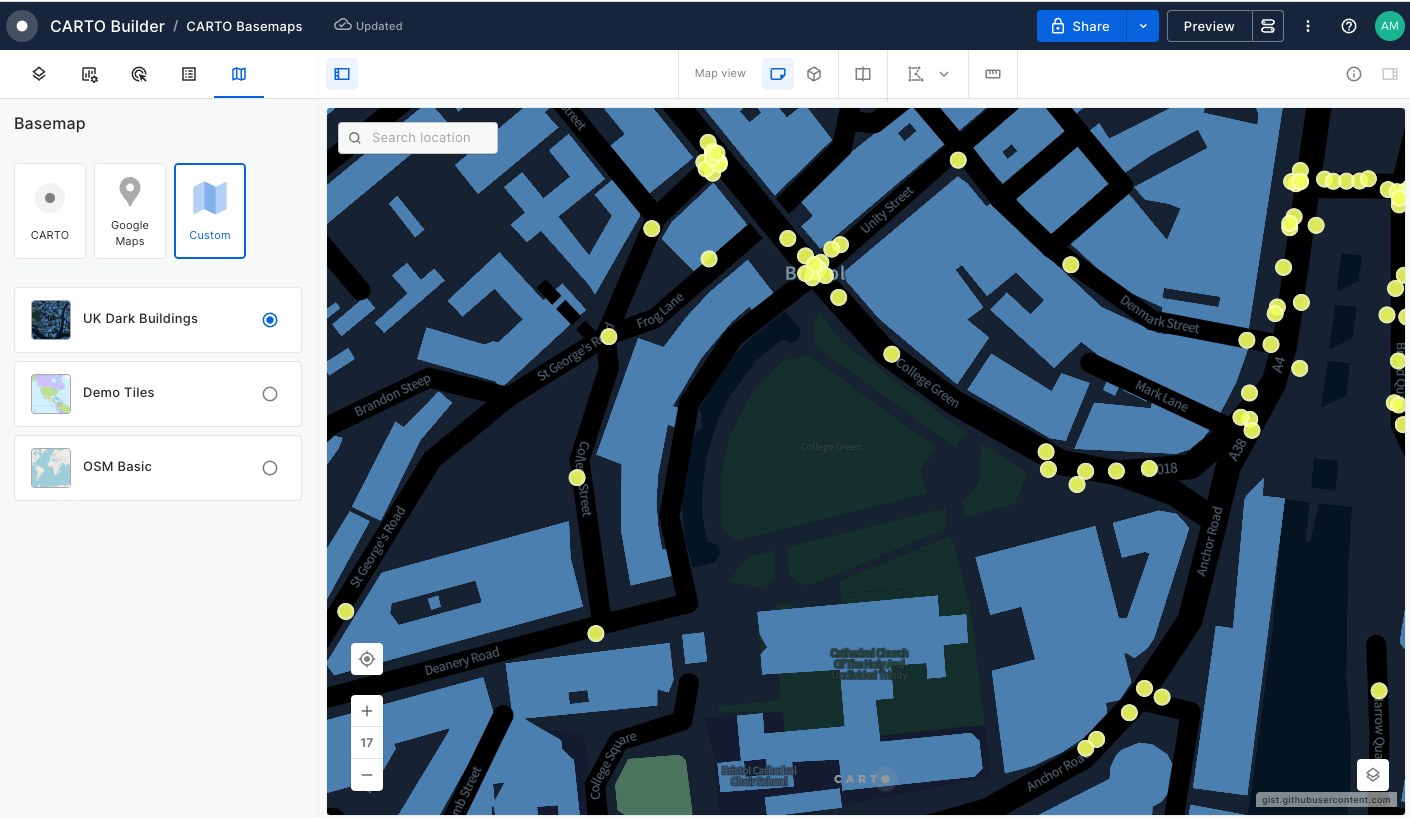
## Google Photorealistic 3D Tiles in Builder

Bring your maps to life with our new CARTO Builder basemap option: **Google Photorealistic 3D Tiles**. This high-fidelity representation of the world built from aerial and satellite imagery lets you explore your data on top of detailed 3D buildings and terrain.

Your data will automatically cover the surface of buildings and other 3D terrain features, allowing you to understand the data in real-world context. This can be incredibly useful for urban planning, real estate or insurance use cases.

Google Photorealistic 3D Tiles span over **2,500 cities across 49 countries.** See Google's [Photorealistic 3D Tiles coverage](https://developers.google.com/maps/documentation/tile/3d-tiles-overview) for the latest list of supported areas.

Ready to try it? Learn more in our [Basemaps documentation](/carto-user-manual/maps/basemaps).

<figure><img src="/files/me2bLvhypMPQIEOMeqHL" alt=""><figcaption></figcaption></figure>
{% endupdate %}

{% update date="2026-04-20" tags="improvement,builder" %}

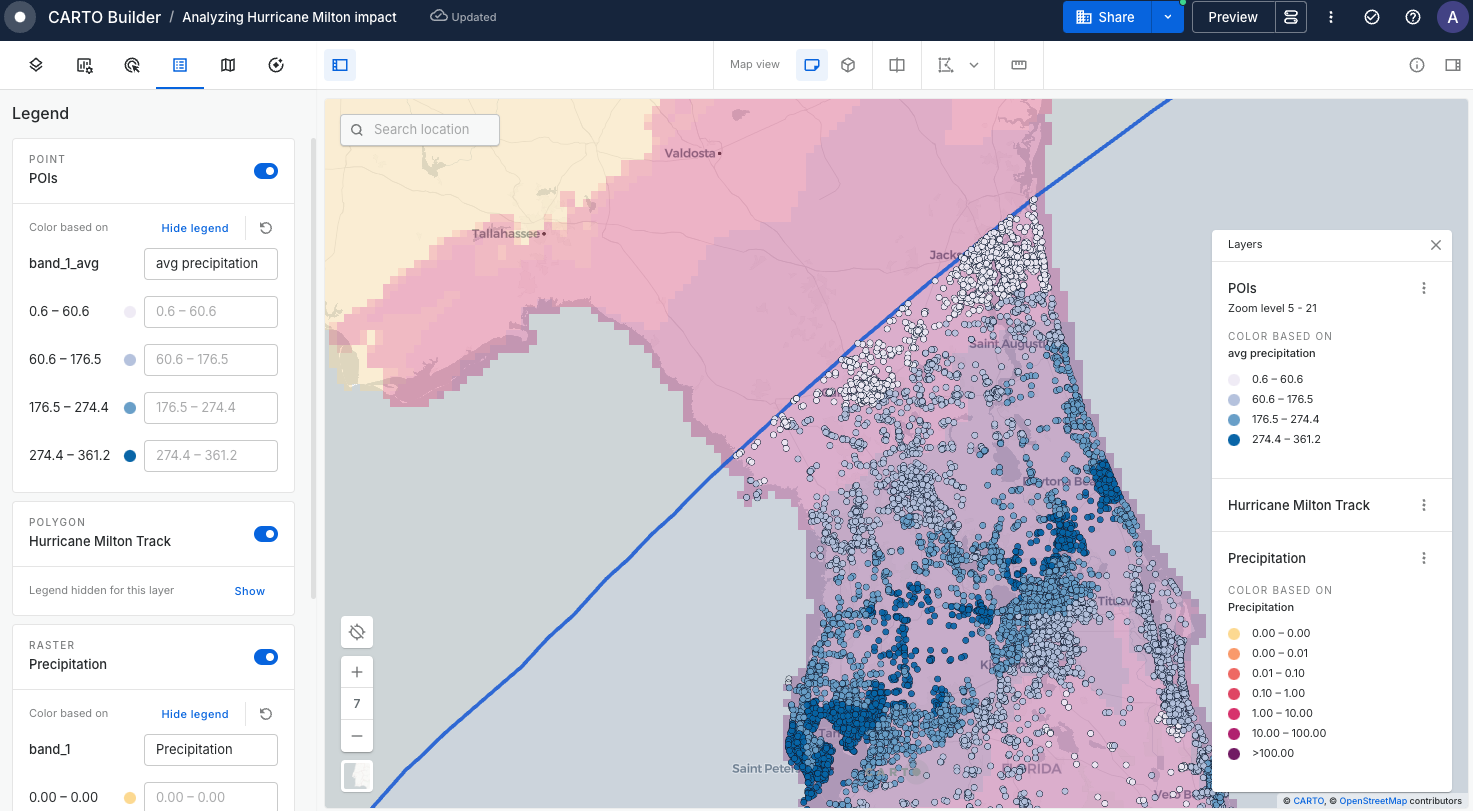
## Reorder categorical legend entries in Builder

Categorical and ordinal legend entries can now be reordered in Builder to improve map readability. Categories can be sorted by frequency or alphabetically, in ascending or descending order.\
\
Reordering only affects the legend’s reading order, colors remain fixed to each category, so the map visualization does not change.

Learn more in our [Legend documentation](/carto-user-manual/maps/legend).

<figure><img src="/files/OxVap1EUBtWbgPj6vucb" alt=""><figcaption></figcaption></figure>
{% endupdate %}

{% update date="2026-04-15" tags="improvement,builder" %}

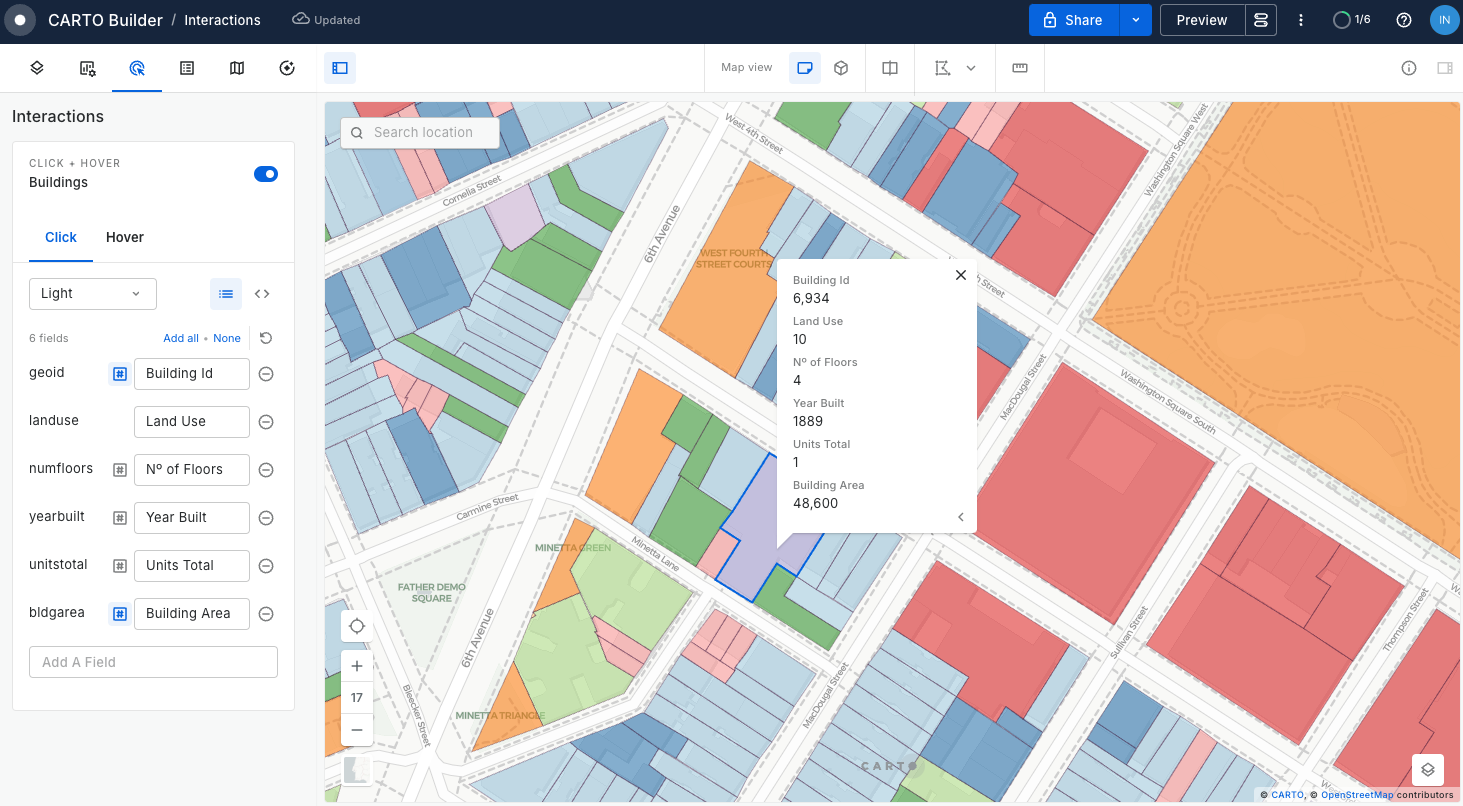
## Click interactions now show every overlapping feature

Click interactions in Builder now paginate across every feature at clicked location, in both pop-up and info panel modes. When overlapping polygons, overlapping lines, or multiple records sharing the same geometry sit at the same spot, you can step through all of them within a layer instead of only seeing the top one.\
\
Previously, clicking a stacked location surfaced only a single feature and the rest were unreachable without zooming in or filtering the data. The new prev/next controls let you browse all of them, with the map highlighting updating as you paginate.

Learn more in our [Click interactions documentation](/carto-user-manual/maps/interactions#click-type-interactions).

<figure><img src="/files/GOxsq6w3gGi9KLDdT6Wg" alt=""><figcaption></figcaption></figure>
{% endupdate %}

{% update date="2026-03-30" tags="new,carto-for-developers" %}

## Build AI-first spatial apps with CARTO Agentic Tools for developers

Building AI-powered apps with geospatial capabilities just got a lot easier. We're releasing `@carto/agentic-deckgl`, an open-source TypeScript library built on [CARTO + deck.gl](https://carto.com/blog/modern-spatial-app-development-carto/) that lets any AI Agent create and style map layers, run spatial analytics, and interact with the map through natural language — with one npm install. It's framework-agnostic, includes Zod-validated tool definitions, a geospatial system prompt builder, and SDK converters for major AI frameworks.

The library gives AI Agents full control over the map experience: creating and styling vector tile, H3, GeoJSON, and raster layers from any CARTO data source; navigating the globe with smooth transitions; switching basemaps; placing and managing markers; applying spatial filters from user-drawn areas or analytical workflows; and managing widgets, visual effects, and layer ordering.

Learn more about this new library in our [product announcement](https://carto.com/blog/carto-agentic-tools-for-developers/).

<figure><img src="/files/eJAl3JUuug6jBLwKFpM0" alt=""><figcaption></figcaption></figure>
{% endupdate %}

{% update date="2026-03-30" tags="new,builder" %}

## Create AI Agents through conversation with the new Configuration Assistant

Creating [AI Agents](/carto-user-manual/ai-agents) just got significantly easier. The new **Agent Configuration Assistant** lets you design, set up, and iterate on your agents using natural language.

Instead of manually defining instructions, selecting tools, and configuring capabilities step by step, you can now **simply describe what your agent should do**. The Assistant generates a complete configuration for you — including the use case, structured instructions, model selection, tool setup, capabilities, and a tailored introduction message.

The Assistant is context-aware, meaning its recommendations are grounded in your actual map. It understands your datasets, layers, widgets, and available tools, helping you create more accurate and relevant agents from the start. You can refine any part of the configuration through conversation or combine it with manual edits for full control.

[Learn more about the Agent Config Assistant in our documentation.](/carto-user-manual/ai-agents/agent-config-assistant)

<figure><img src="/files/Y735tL6knJWLymdWLb87" alt=""><figcaption></figcaption></figure>
{% endupdate %}

{% update date="2026-03-27" tags="new,workflows" %}

## Viewer Mode for Workflows

Workflows can now be shared with **Viewer Mode**, allowing editors to publish interactive workflows that other users can run without editing the canvas. This opens up new possibilities for delivering analytical tools and reports to stakeholders and business users.

* **Viewer parameters**: Editors define which variables are exposed to viewers as configurable parameters, with custom display names and helper text. Supported types include Number, String, and the new **Geo** type, which lets viewers draw geographic features on a map.
* **Viewer Result Output**: A new component that defines which node's output is displayed to viewers, giving editors full control over what results are visible.
* **Viewer settings**: Granular controls over the viewer experience, including toggling the canvas visibility, SQL preview, data export, result caching, and more.

[Learn more about Viewer Mode in our documentation](/carto-user-manual/workflows/viewer-mode).

{% embed url="<https://vimeo.com/1177627305?autoplay=1>" %}
{% endupdate %}

{% update date="2026-03-19" tags="improvement,platform" %}

## Claude 4.6 models now available for AI Agents

We've expanded the AI models available for AI Agents with the latest generation of Anthropic models.

* **More CARTO-managed models:** Claude Opus 4.6 and Claude Sonnet 4.6 are now available out of the box with no additional configuration.
* **Broader bring-your-own-model support:** You can now use Claude Opus 4.6 and Claude Sonnet 4.6 through any of our supported providers, including Vertex AI, AWS Bedrock, Azure OpenAI, Anthropic, Snowflake Cortex, and Databricks Serving Model.

The 4.6 models deliver better performance across reasoning, tool usage, and complex geospatial workflows.

Configure your models in **Settings > CARTO A**I — see the [CARTO AI documentation](/carto-user-manual/settings/carto-ai) for the full list of supported models and providers.

<figure><img src="/files/DblOJKi7oNDabMoGYWRE" alt=""><figcaption></figcaption></figure>
{% endupdate %}

{% update date="2026-02-17" tags="improvement,platform" %}

## Additional AI models to power your Agents

We've expanded the AI models available for AI Agents with more advanced models from Anthropic, Google, and OpenAI.

* **More CARTO-managed models:** Claude Opus 4.5, Claude Sonnet 4.5, Gemini 3 Pro, and Gemini 3 Flash are now available out of the box with no additional configuration.
* **Broader bring-your-own-model support:** You can now use Gemini 3, Claude Opus 4.5, and GPT-5.2 through any of our supported providers, including Vertex AI, Google AI Studio, Snowflake Cortex, Databricks Serving Model, AWS Bedrock, Azure OpenAI, OpenAI, and Anthropic.

We recommend upgrading to the newest models available — you'll see a significant improvement in agent performance, reasoning, and tool usage.

Configure your models in **Settings > CARTO AI** — see the [CARTO AI documentation](/carto-user-manual/settings/carto-ai) for the full list of supported models and providers.

<figure><img src="/files/NKszySuO7FejCpIuj2Nn" alt=""><figcaption></figcaption></figure>
{% endupdate %}

{% update date="2026-02-09" tags="improvement,builder" %}

## AI Agents now create interactive charts

[AI Agents](/carto-user-manual/ai-agents) can now generate and render interactive charts directly inside the conversation. Users can ask for data visualizations and see charts rendered inline — no need to leave the chat.

Charts expand the way AI Agents can communicate insights, complementing map layers with statistical visualizations like bar charts for comparisons, line charts for trends, or histograms for distributions. Combined with other tools, AI Agents can query your data, analyze it, and present findings in the format that best fits the question.

[Learn more about AI Agent tools in our documentation](/carto-user-manual/ai-agents/working-with-tools).

<figure><img src="/files/M6Du9eyrHxELGKYYVRqJ" alt=""><figcaption></figcaption></figure>
{% endupdate %}

{% update date="2026-01-29" tags="new,platform" %}

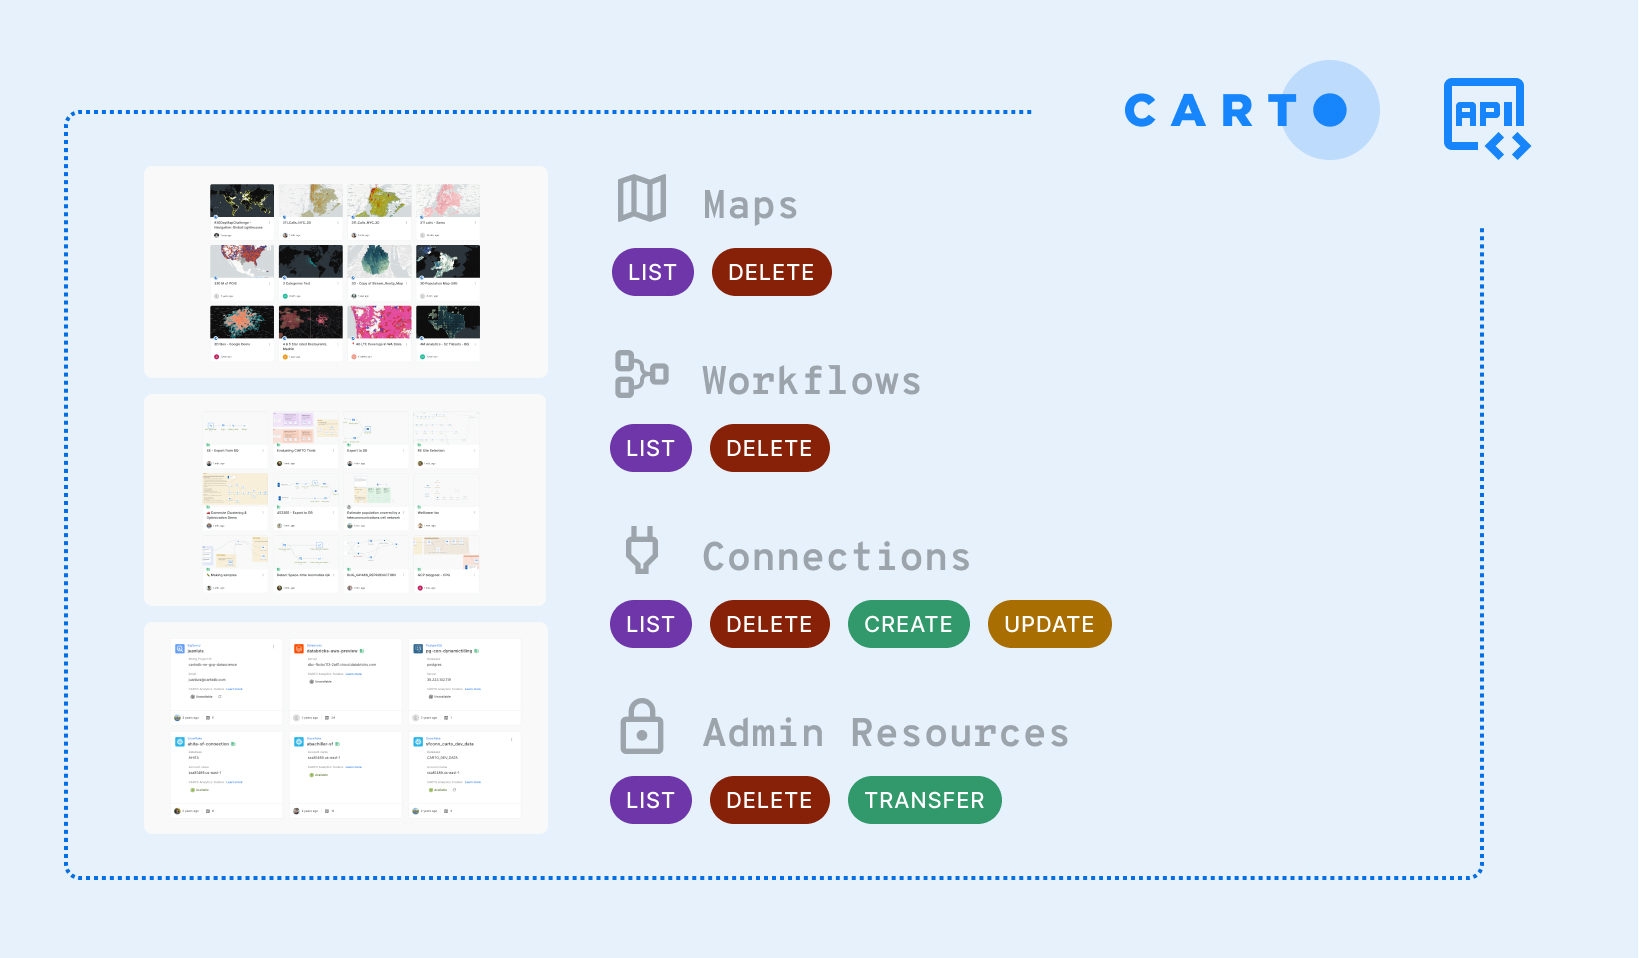
## Introducing our new Command-line Interface

We're excited to announce the [CARTO CLI](https://carto.com/blog/carto-cli-automateed-carto-management-build-for-ai-agents), which brings command line power to your CARTO organization. Manage Maps, Workflows, connections and credentials; transfer assets between organizations, and query your organization's activity data; all from the terminal!

The CLI supports structured JSON output, non-interactive execution, and headless authentication, making it a natural interface to script and automate. To get started, head over to our [CARTO CLI documentation](/carto-for-agents/cli).

<figure><img src="/files/GsJ7J8aWwjWrICnj5Cz7" alt="" width="375"><figcaption></figcaption></figure>
{% endupdate %}

{% update date="2026-01-29" tags="improvement,workspace" %}

## Tracking activity data from public maps

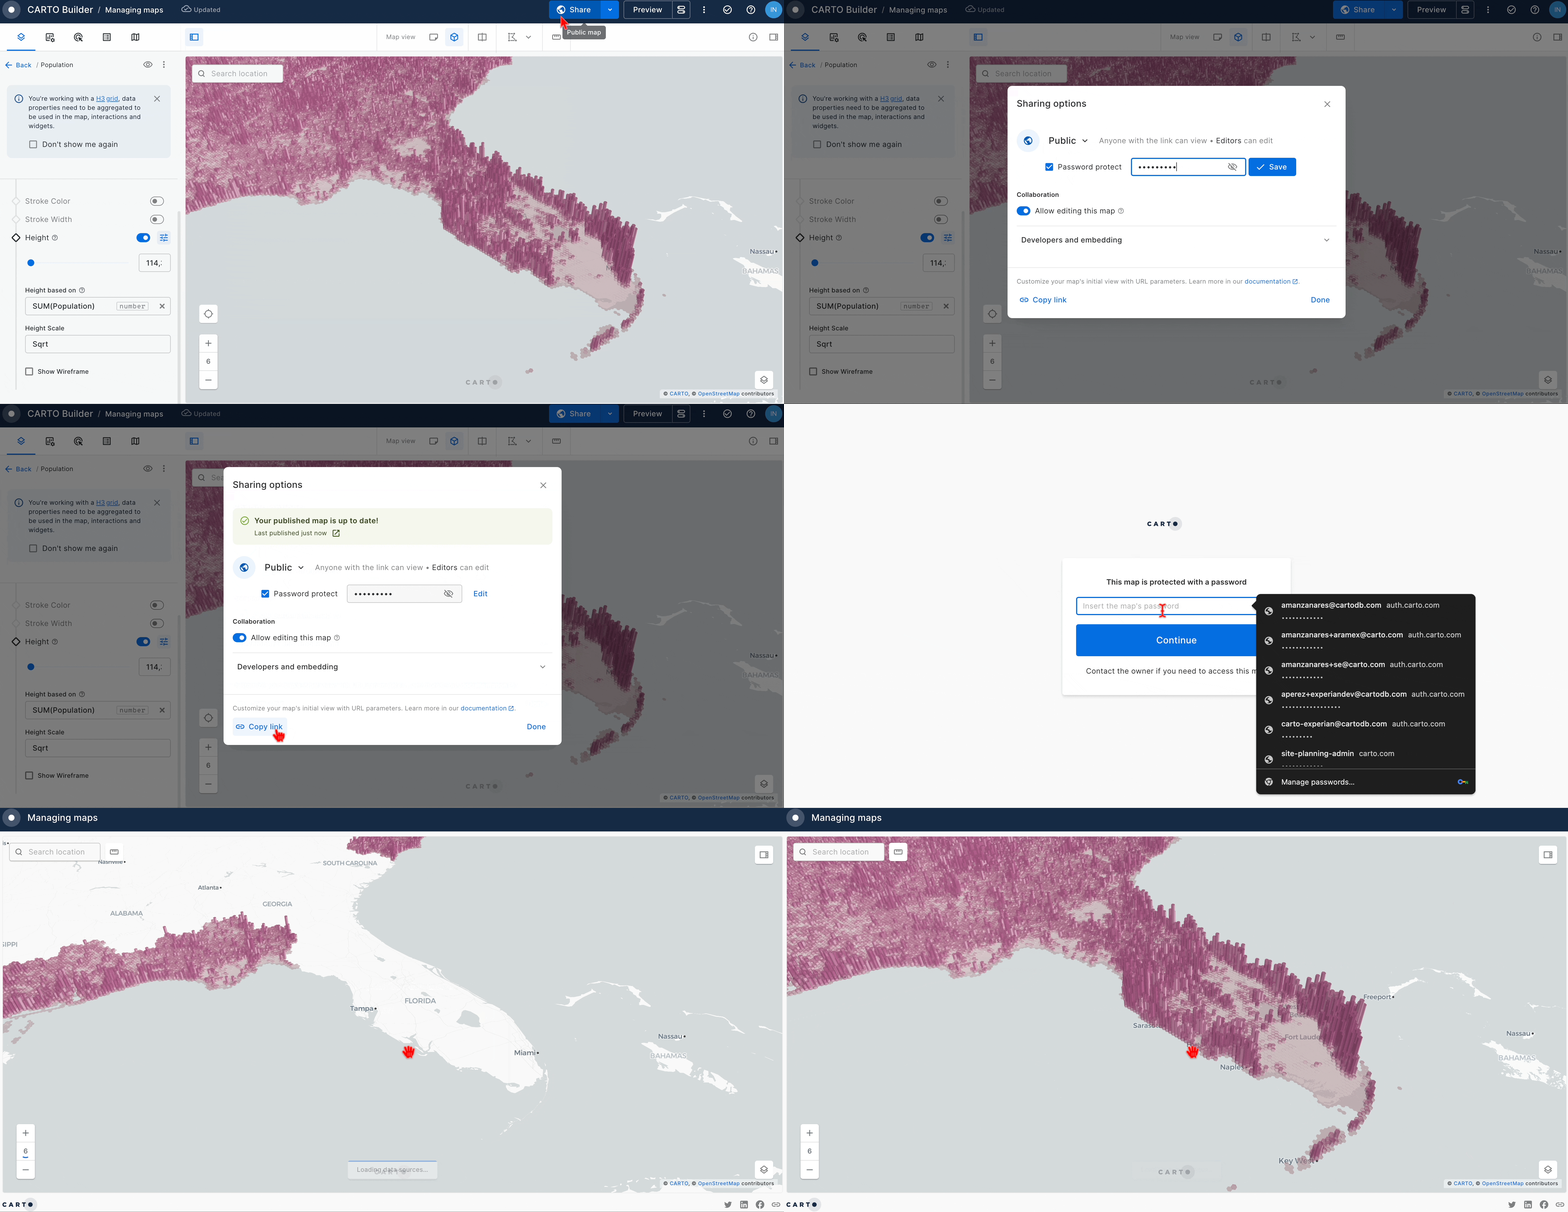
Public maps are the way to distribute geospatial data and insights across wider audiences outside your organization. From coverage maps to deforestation storytelling, many geospatial dashboards are making an impact on public websites thanks to CARTO.

Starting now, CARTO administrators can measure that impact, and answer questions like:

* **How many times my public maps have been viewed**
* **Which are my most active public maps**
* **How many exports from public maps last month...**

We've automatically added to our [Activity Data](/carto-user-manual/settings/activity-data) the data coming from your public maps thanks to a robust, secure, event pipeline that can track millions of events coming from unauthenticated users.

To get started, simply [export your Activity Data](/carto-user-manual/settings/activity-data) or [integrate it via API](/carto-user-manual/settings/activity-data#access-via-api).

<figure><img src="/files/UcriAHklKcuxX19epnfp" alt=""><figcaption></figcaption></figure>
{% endupdate %}

{% update date="2026-01-20" tags="new,platform" %}

## New AI provider and LLM integrations to power your AI Agents

CARTO now supports seven additional AI providers, expanding the AI and LLM integrations available to power **AI Agents**.

Previously limited to **OpenAI** and **Google AI Studio**, you can now connect AI Agents to models hosted on your preferred cloud or data platform:

* **Google Vertex AI**: Enterprise GCP deployments with service account authentication.
* **Amazon Bedrock**: Claude models through AWS infrastructure.
* **Snowflake Cortex**: AI models within your Snowflake environment.
* **Databricks Model Serving**: Models through Databricks endpoints.
* **Oracle Generative AI**: Access to models via OCI.
* **Anthropic**: Direct access to Claude models.
* **Azure OpenAI Service**: OpenAI models through Azure.

These new integrations allow AI Agents to run on your preferred cloud or data platform, leverage existing cloud contracts, meet data residency requirements, and access the latest large language models available from each provider.

Configure providers in **Settings > CARTO AI**. See the [CARTO AI documentation](/carto-user-manual/settings/carto-ai) for setup instructions.

<figure><img src="/files/cX1oOWWaRkmFsMFB2aja" alt=""><figcaption></figcaption></figure>
{% endupdate %}

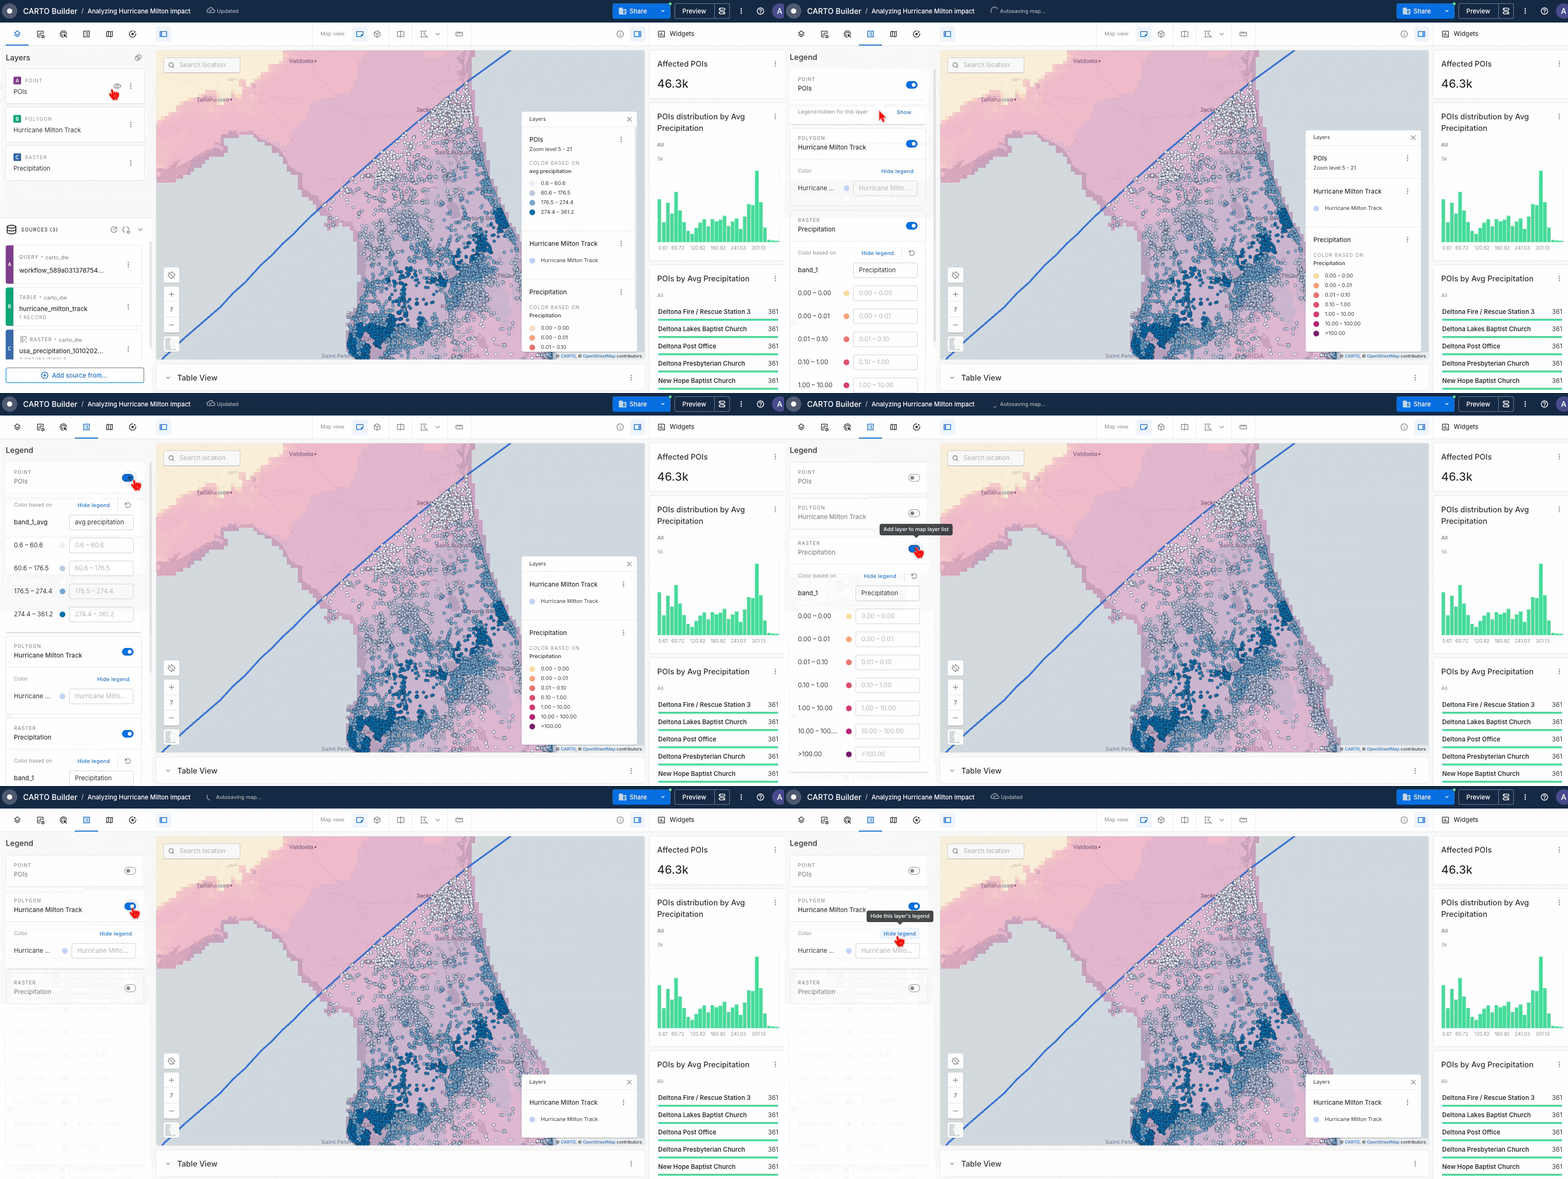
{% update date="2026-01-14" tags="improvement,builder" %}

## CARTO Basemap labels now stay on top of your layers

When using CARTO Basemaps, labels (like city and street names) now automatically appear on top of your map layers instead of being hidden underneath them.

This makes it easier to read your maps, especially when working with multiple overlapping layers. You can still turn labels off in the basemap settings if you prefer a cleaner look.

<figure><img src="/files/lBW1ROv5sdtMuCSOeMaG" alt=""><figcaption></figcaption></figure>
{% endupdate %}

{% update date="2026-01-12" tags="new,workflows,analytics-toolbox" %}

## H3-based isochrones powered by TravelTime

A new capability is now available for generating **H3-based isochrones** using [TravelTime](https://docs.traveltime.com/api/reference/h3), expanding how accessibility and travel-time analysis can be performed in CARTO.

This release introduces a new endpoint in the **Location Data Services (LDS) API** that leverages TravelTime’s H3 isochrone support. In addition, corresponding functions are available in the **Analytics Toolbox** (for [BigQuery](/data-and-analysis/analytics-toolbox-for-bigquery/sql-reference/lds#create_h3_isolines), [Snowflake](/data-and-analysis/analytics-toolbox-for-snowflake/sql-reference/lds#create_h3_isolines), [Databricks](/data-and-analysis/analytics-toolbox-for-databricks/reference/lds#create_h3_isolines) and [Redshift](/data-and-analysis/analytics-toolbox-for-redshift/sql-reference/lds#create_h3_isolines)), along with a new [Create H3 Isolines](/carto-user-manual/workflows/components/spatial-constructors#create-h3-isolines) component in **Workflows**, enabling low-code and programmatic access to this functionality.

Customers can now generate H3-indexed isochrones directly, with support for the same configuration options provided by the underlying TravelTime API, including **departure time** and **transport mode**. Using H3 as the output format simplifies downstream analysis, aggregation, and visualization, particularly for workflows that already rely on hexagonal indexing.

{% embed url="<https://vimeo.com/1153538127?autoplay=1>" %}
{% endupdate %}

{% update date="2026-01-07" tags="new,platform" %}

## Full support for new Databricks Spatial SQL functions and data types

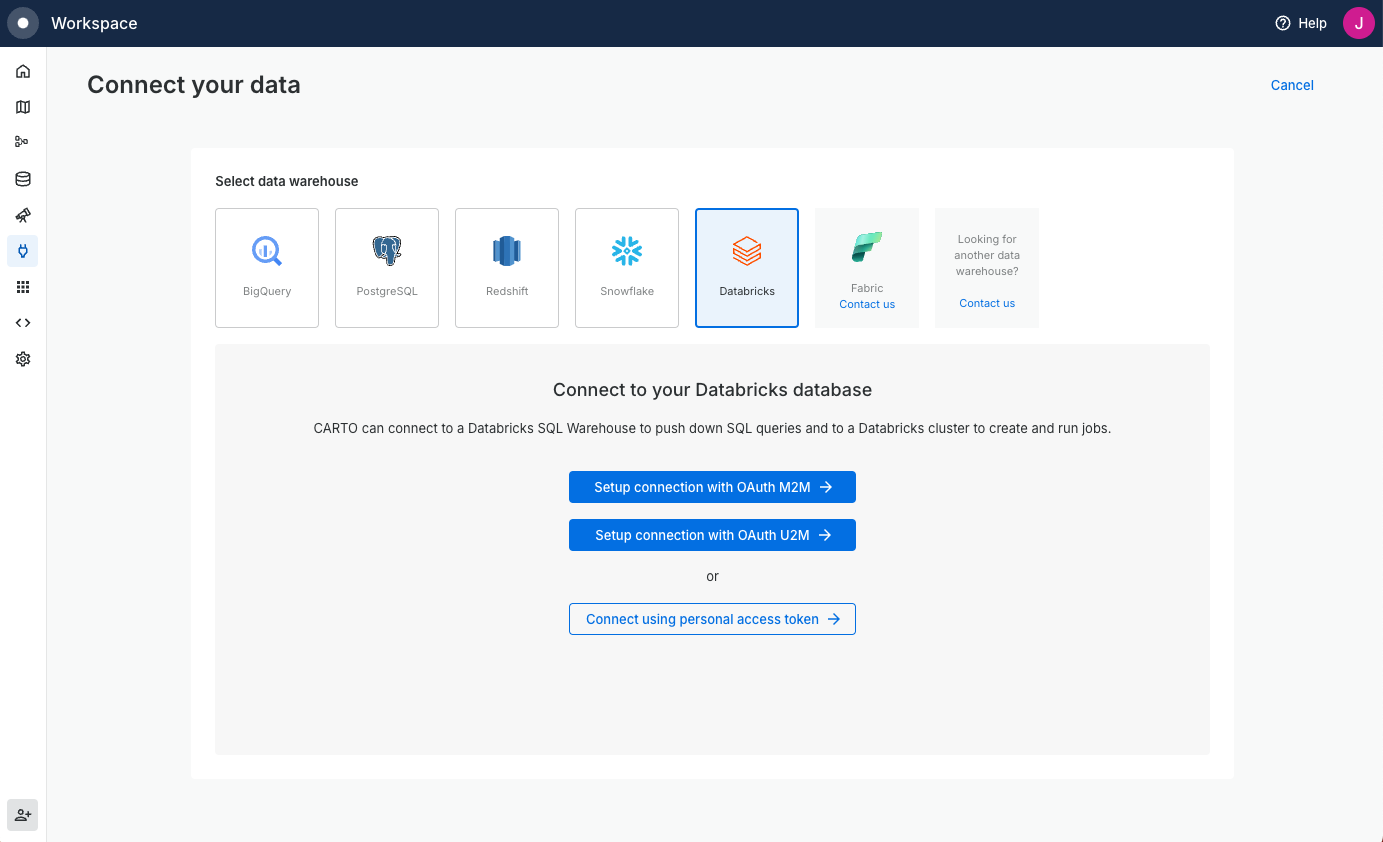
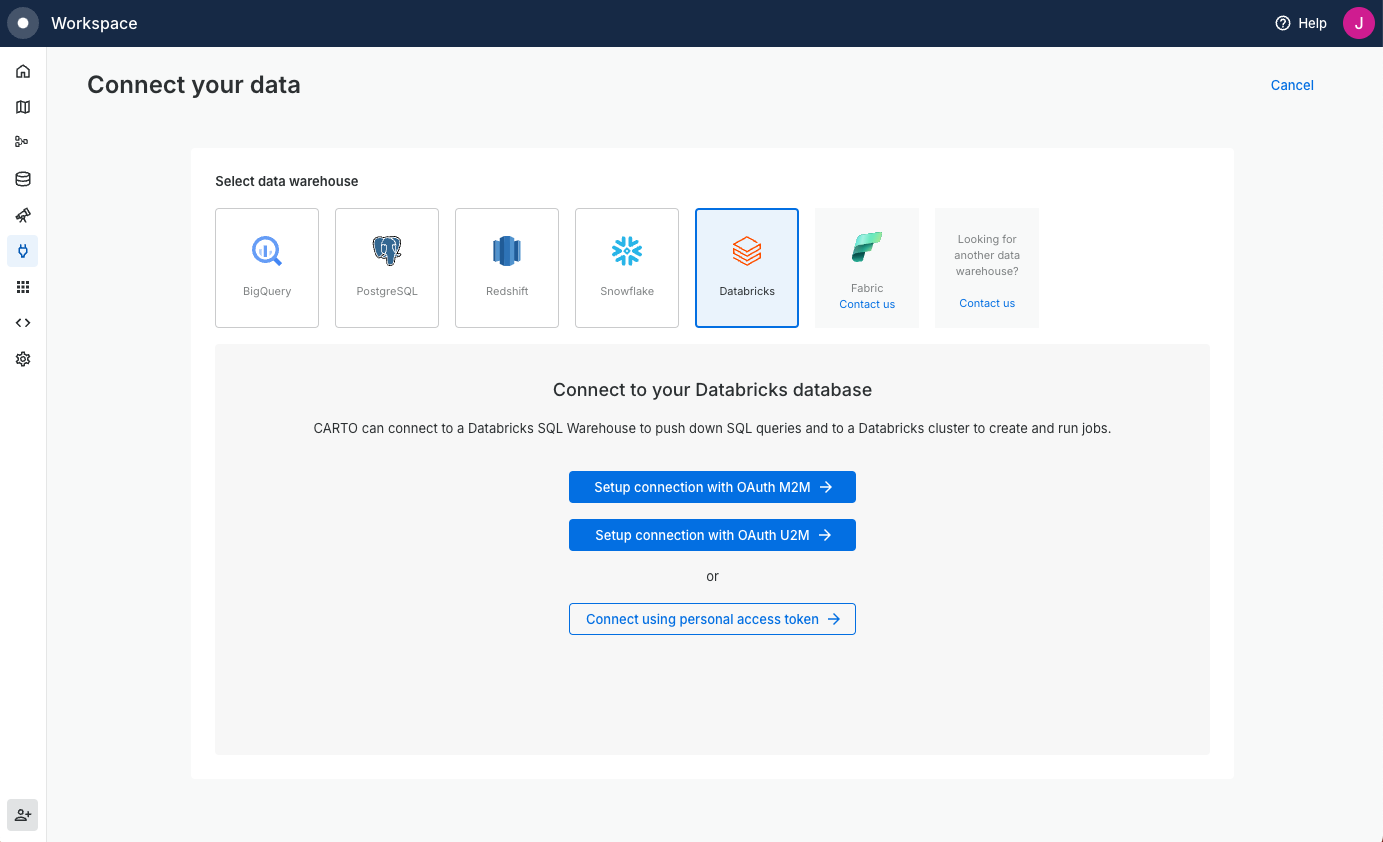
A new [Databricks connection](/carto-user-manual/connections/databricks) type is now generally available across all CARTO accounts, delivering deeper and more modern support for Databricks as a data warehouse and compute platform.

This integration adopts **Databricks SQL Warehouses** as the sole compute resource, providing a serverless, cloud-native experience without the need to manage traditional compute clusters. It also leverages Databricks’ [**native spatial capabilities**](https://www.databricks.com/blog/introducing-spatial-sql-databricks-80-functions-high-performance-geospatial-analytics?utm_source=chatgpt.com), including the GEOMETRY data type and Spatial SQL functions documented by Databricks, enabling efficient storage and processing of spatial data directly in SQL without external libraries.

Connectivity options include **Personal Access Tokens (PAT), M2M, and U2M integrations**, offering flexibility in how authentication and access are managed. Builder and Workflows fully support Databricks tables with geometry types out of the box, including query sources, SQL parameters, Location Data Services, and Create Builder Map workflows — no additional data preparation is required to work with spatial columns.

The [**Analytics Toolbox**](/data-and-analysis/analytics-toolbox-for-databricks) now installs directly into the Databricks Unity Catalog with no external dependencies, simplifying governance and deployment. Older Databricks connection types remain available for existing accounts that used them previously. This release represents a significant step in CARTO’s support for major cloud data warehouse providers and extends CARTO’s capabilities for spatial analytics on modern data platforms.

<figure><img src="/files/DzqA9Fo5izo1L94Ar6tk" alt=""><figcaption></figcaption></figure>
{% endupdate %}

{% update date="2025-12-29" tags="new,builder" %}

## Track map changes over time with Version history

We've introduced **Version history** in Builder, giving you the ability to track and manage different versions of your maps over time.

CARTO automatically saves versions as you work, and you can also manually save named versions to mark important milestones. You can view the full history of changes, restore any previous version to undo unwanted changes, or duplicate from a historical version to create variations without affecting the current map.

Version history works seamlessly with collaborative maps—all changes are tracked with the collaborator's name and timestamp, providing a complete audit trail. When you publish a map, the published version is marked with a badge so you always know which version is live.

[Learn more in our documentation](/carto-user-manual/maps/version-history).

<figure><img src="/files/52T5JNSER6yaz2lAT8GQ" alt=""><figcaption></figcaption></figure>
{% endupdate %}

{% update date="2025-12-12" tags="new,workflows" %}

## **New components to run spatial analytics techniques on embeddings from Geospatial Foundation Models**

We’re introducing the **Analytics on Embeddings** extension package for **CARTO Workflows**, a new set of components that bring high-dimensional vector embedding analytics into spatial workflows. This extension enables users to analyze, cluster, compare, and visualize embedding representations (whether derived from geospatial foundation models, satellite data, or other spatial sources) directly within their Workflows pipelines.

Key capabilities in this package include:

* [**Change Detection**](/carto-user-manual/workflows/components/embedding-analytics#change-detection): Quantifies temporal changes in embedding vectors to monitor dynamics over time.
* [**Clustering**](/carto-user-manual/workflows/components/embedding-analytics#clustering): Groups locations based on similarity in embedding space, with optional dimensionality reduction to improve performance.
* [**Similarity Search**](/carto-user-manual/workflows/components/embedding-analytics#similarity-search): Identifies regions with similar spatial or contextual characteristics relative to one or more reference locations.
* [**Visualization**](/carto-user-manual/workflows/components/embedding-analytics#visualization): Converts high-dimensional embeddings into RGB colors for intuitive mapping and pattern discovery.

These components work seamlessly with embedding vectors stored as table columns and support integration with the [**Geospatial Foundation Models**](/carto-user-manual/workflows/components/google-pdfm-embeddings) extension, enabling richer insights from learned representations without leaving the low-code Workflows environment.
{% endupdate %}

{% update date="2025-12-09" tags="improvement,workspace" %}

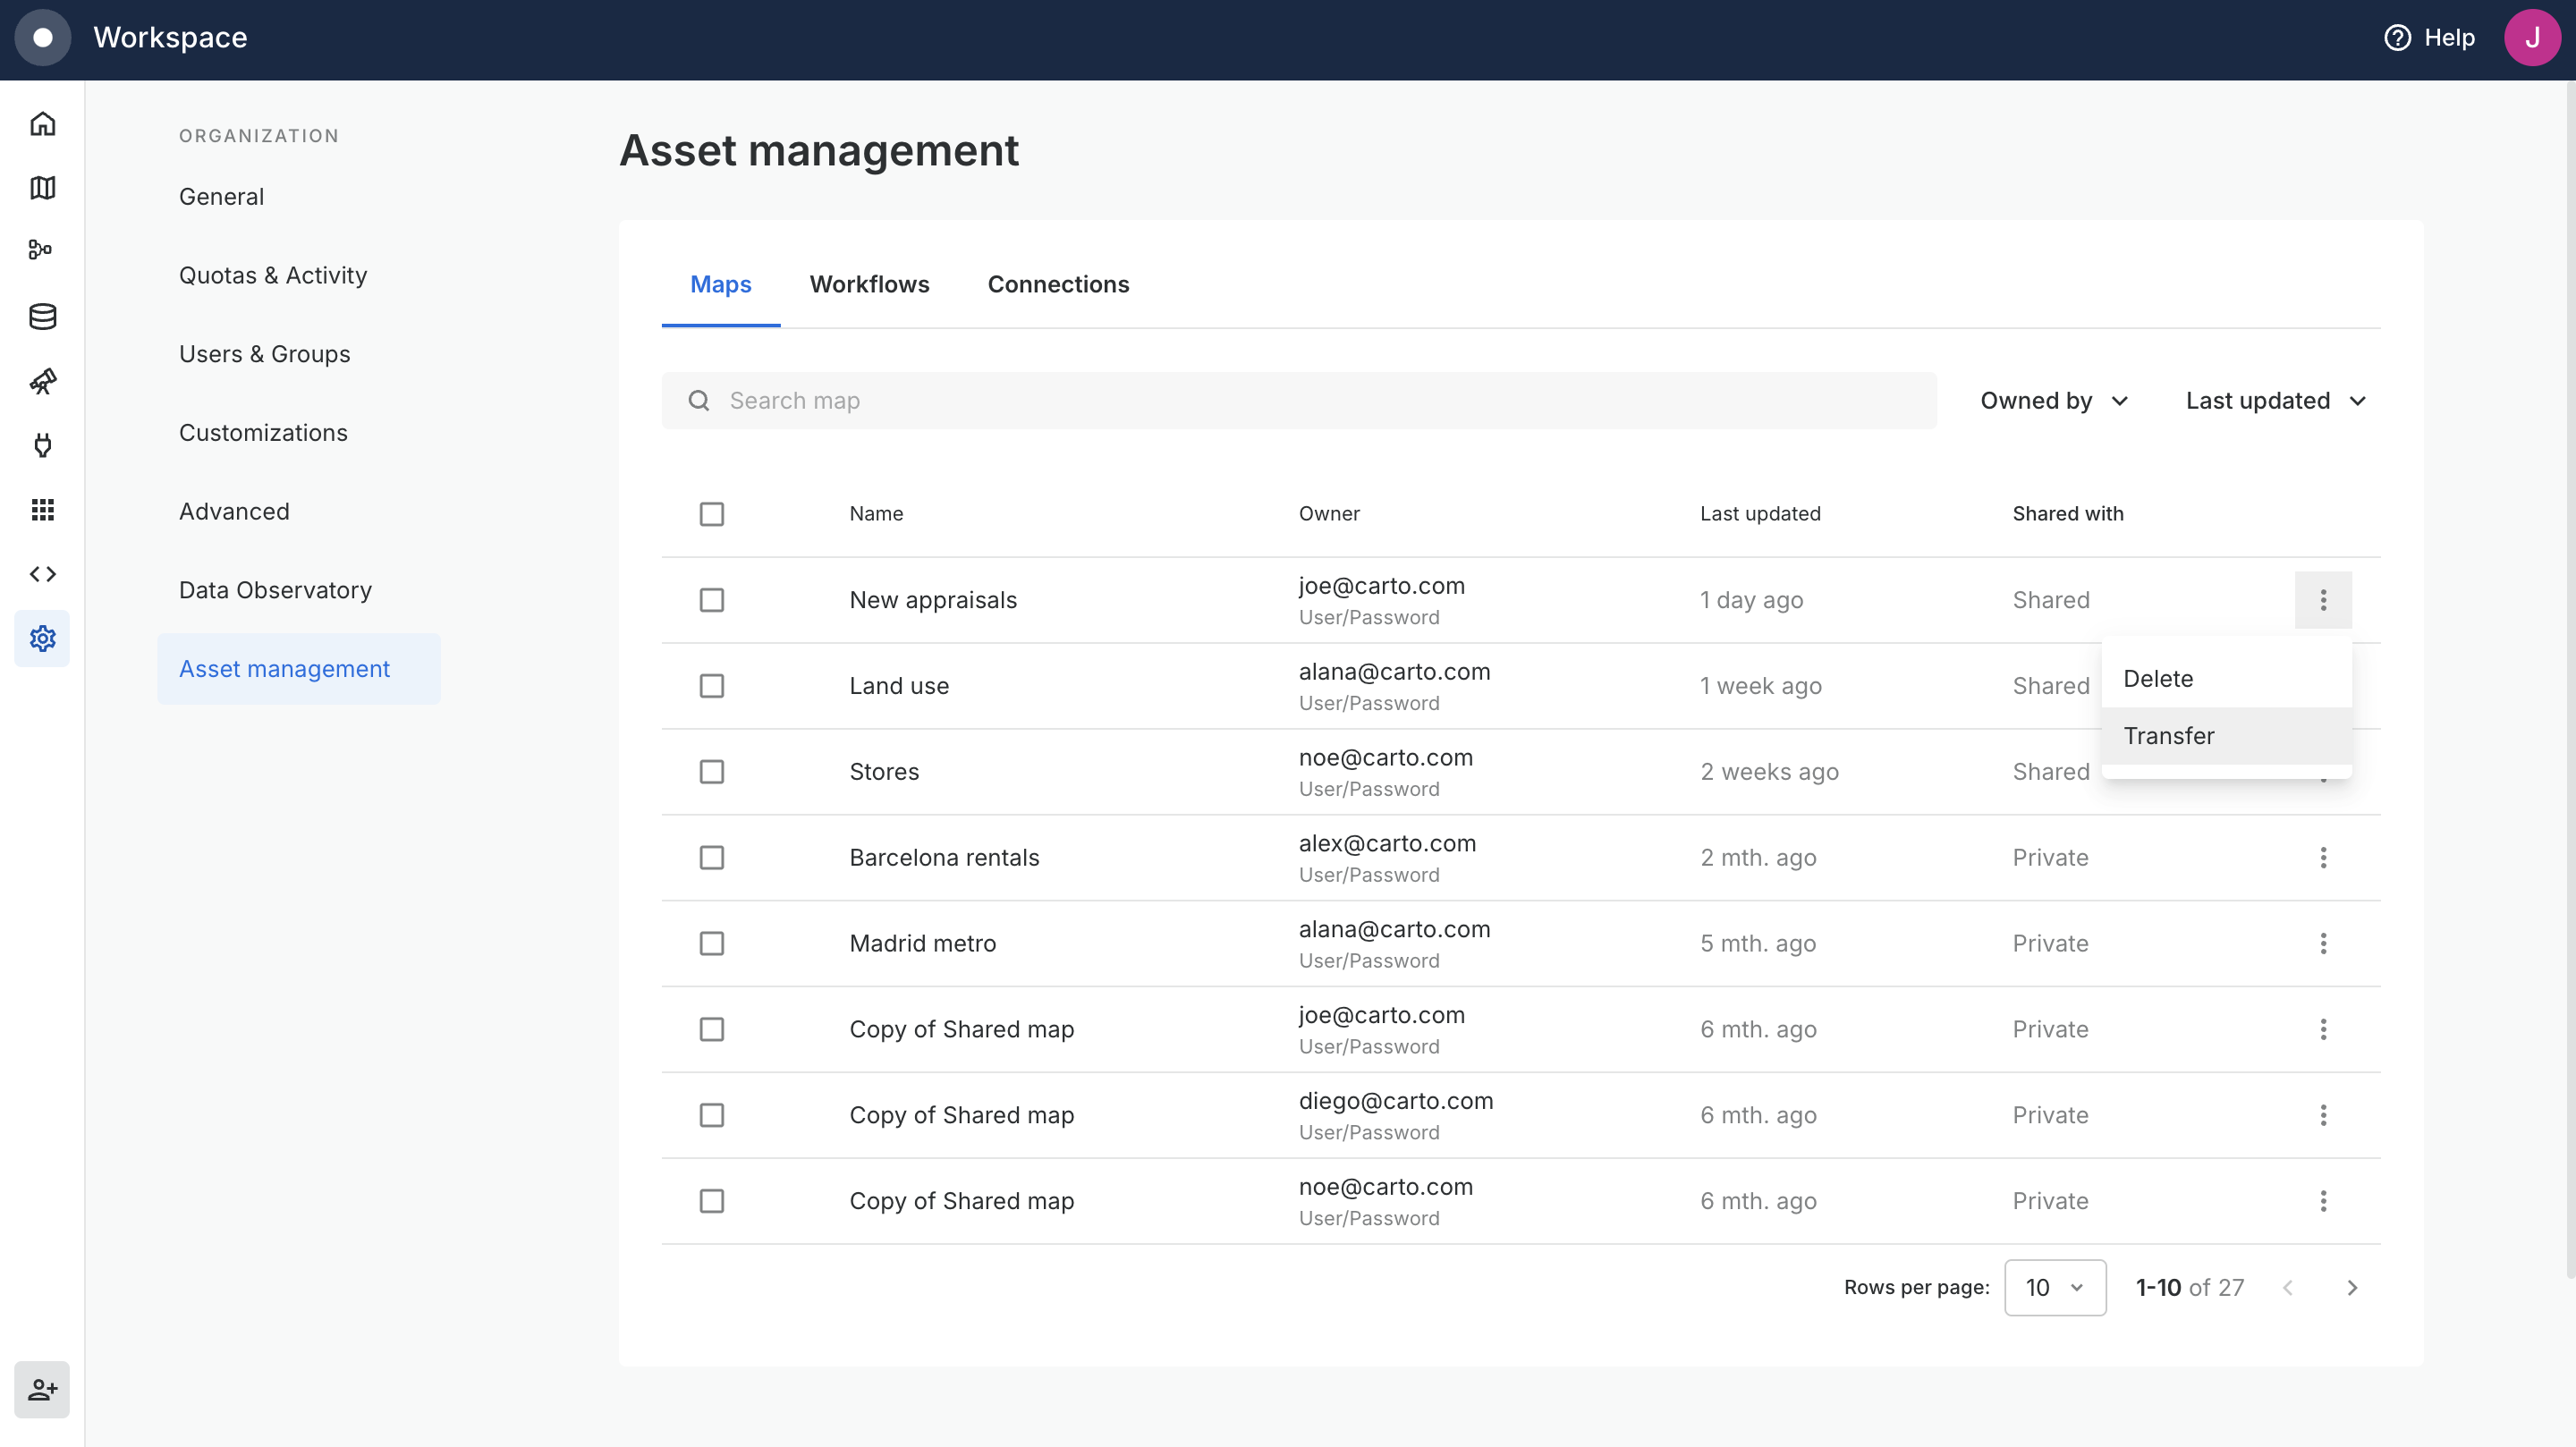
## Manage developer credentials from the asset management table

Superadmin users can now view and manage all developer credentials in their organization, including **API Access Tokens**, **SPA OAuth Clients**, and **M2M OAuth Clients**. From the Asset Management table of the settings, Superadmins now can:

* Find credentials by type, name and owner
* Transfer credentials to another user (only available for API Access Tokens and SPA OAuth Clients)
* Delete credentials

This improvement simplifies team collaboration by allowing credentials to be transferred between users seamlessly, preventing disruptions if the credential owner is unavailable or leaves.

For more information, see our section on the [Superadmin role](/carto-user-manual/settings/users-and-groups/managing-user-roles#superadmin).

<figure><img src="/files/v1vOnsO0muF2PN7ptGZb" alt=""><figcaption></figcaption></figure>
{% endupdate %}

{% update date="2025-11-18" tags="improvement,workspace" %}

## Unified access to Data Observatory subscriptions and improved subscription management

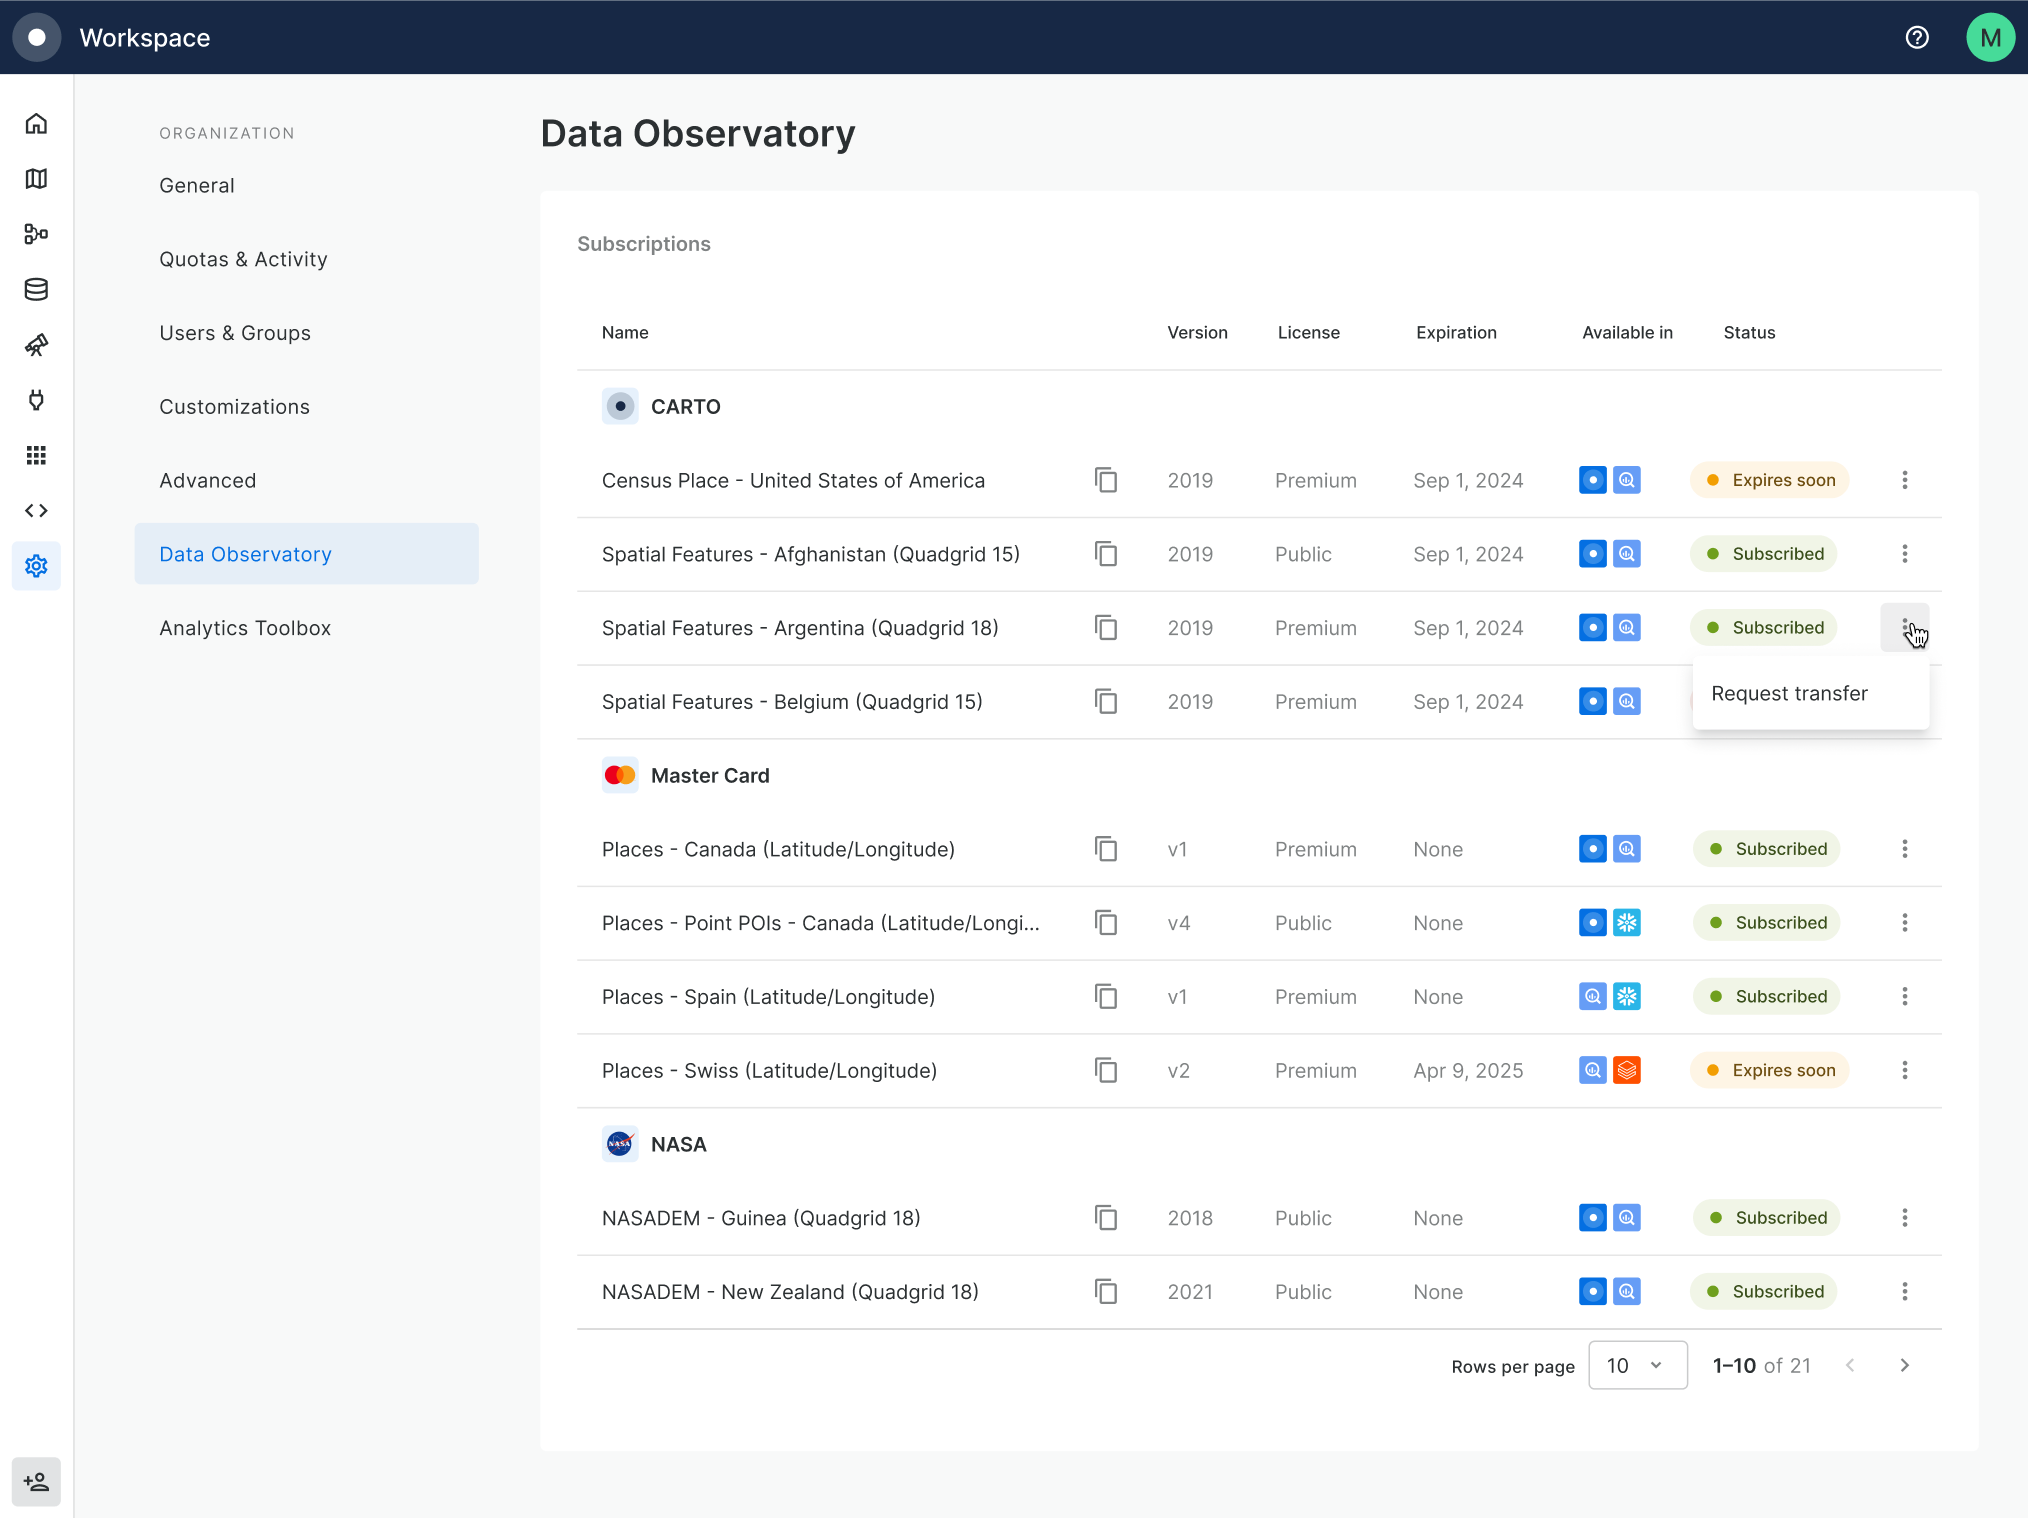
With this release, we’re making it simpler and more consistent for users to access and work with data from their Data Observatory subscriptions. Access to data has now been fully unified to always be via your own data warehouse connections. Additionally we've also improved the way Admin users can manage the organization's Data Observatory subscriptions from the Settings section in the CARTO Workspace.

* We’ve unified access to the data from Data Observatory subscriptions to always be rom the end-user data warehouse connections. As announced earlier this year, we have **deprecated the Data Observatory tab in Data Explorer, Builder, and Workflows**. This tab previously exposed subscriptions only through a small set of connections (i.e. CARTO Data Warehouse and BigQuery US multi-region). Since all subscriptions are now available directly via data warehouse connections, the tab has been removed to avoid confusion.
* The [Data Observatory section](/carto-user-manual/settings/data-observatory) in Settings has been significantly improved. It now serves as the central place to manage your organization’s subscriptions, showing to which data warehouse each subscription has been transferred, and allowing users to request new transfers so the data is available directly in their data warehouses.

<figure><img src="/files/ZohHHveObtiJfACJrjHp" alt=""><figcaption></figcaption></figure>
{% endupdate %}

{% update date="2025-11-18" tags="improvement,workspace" %}

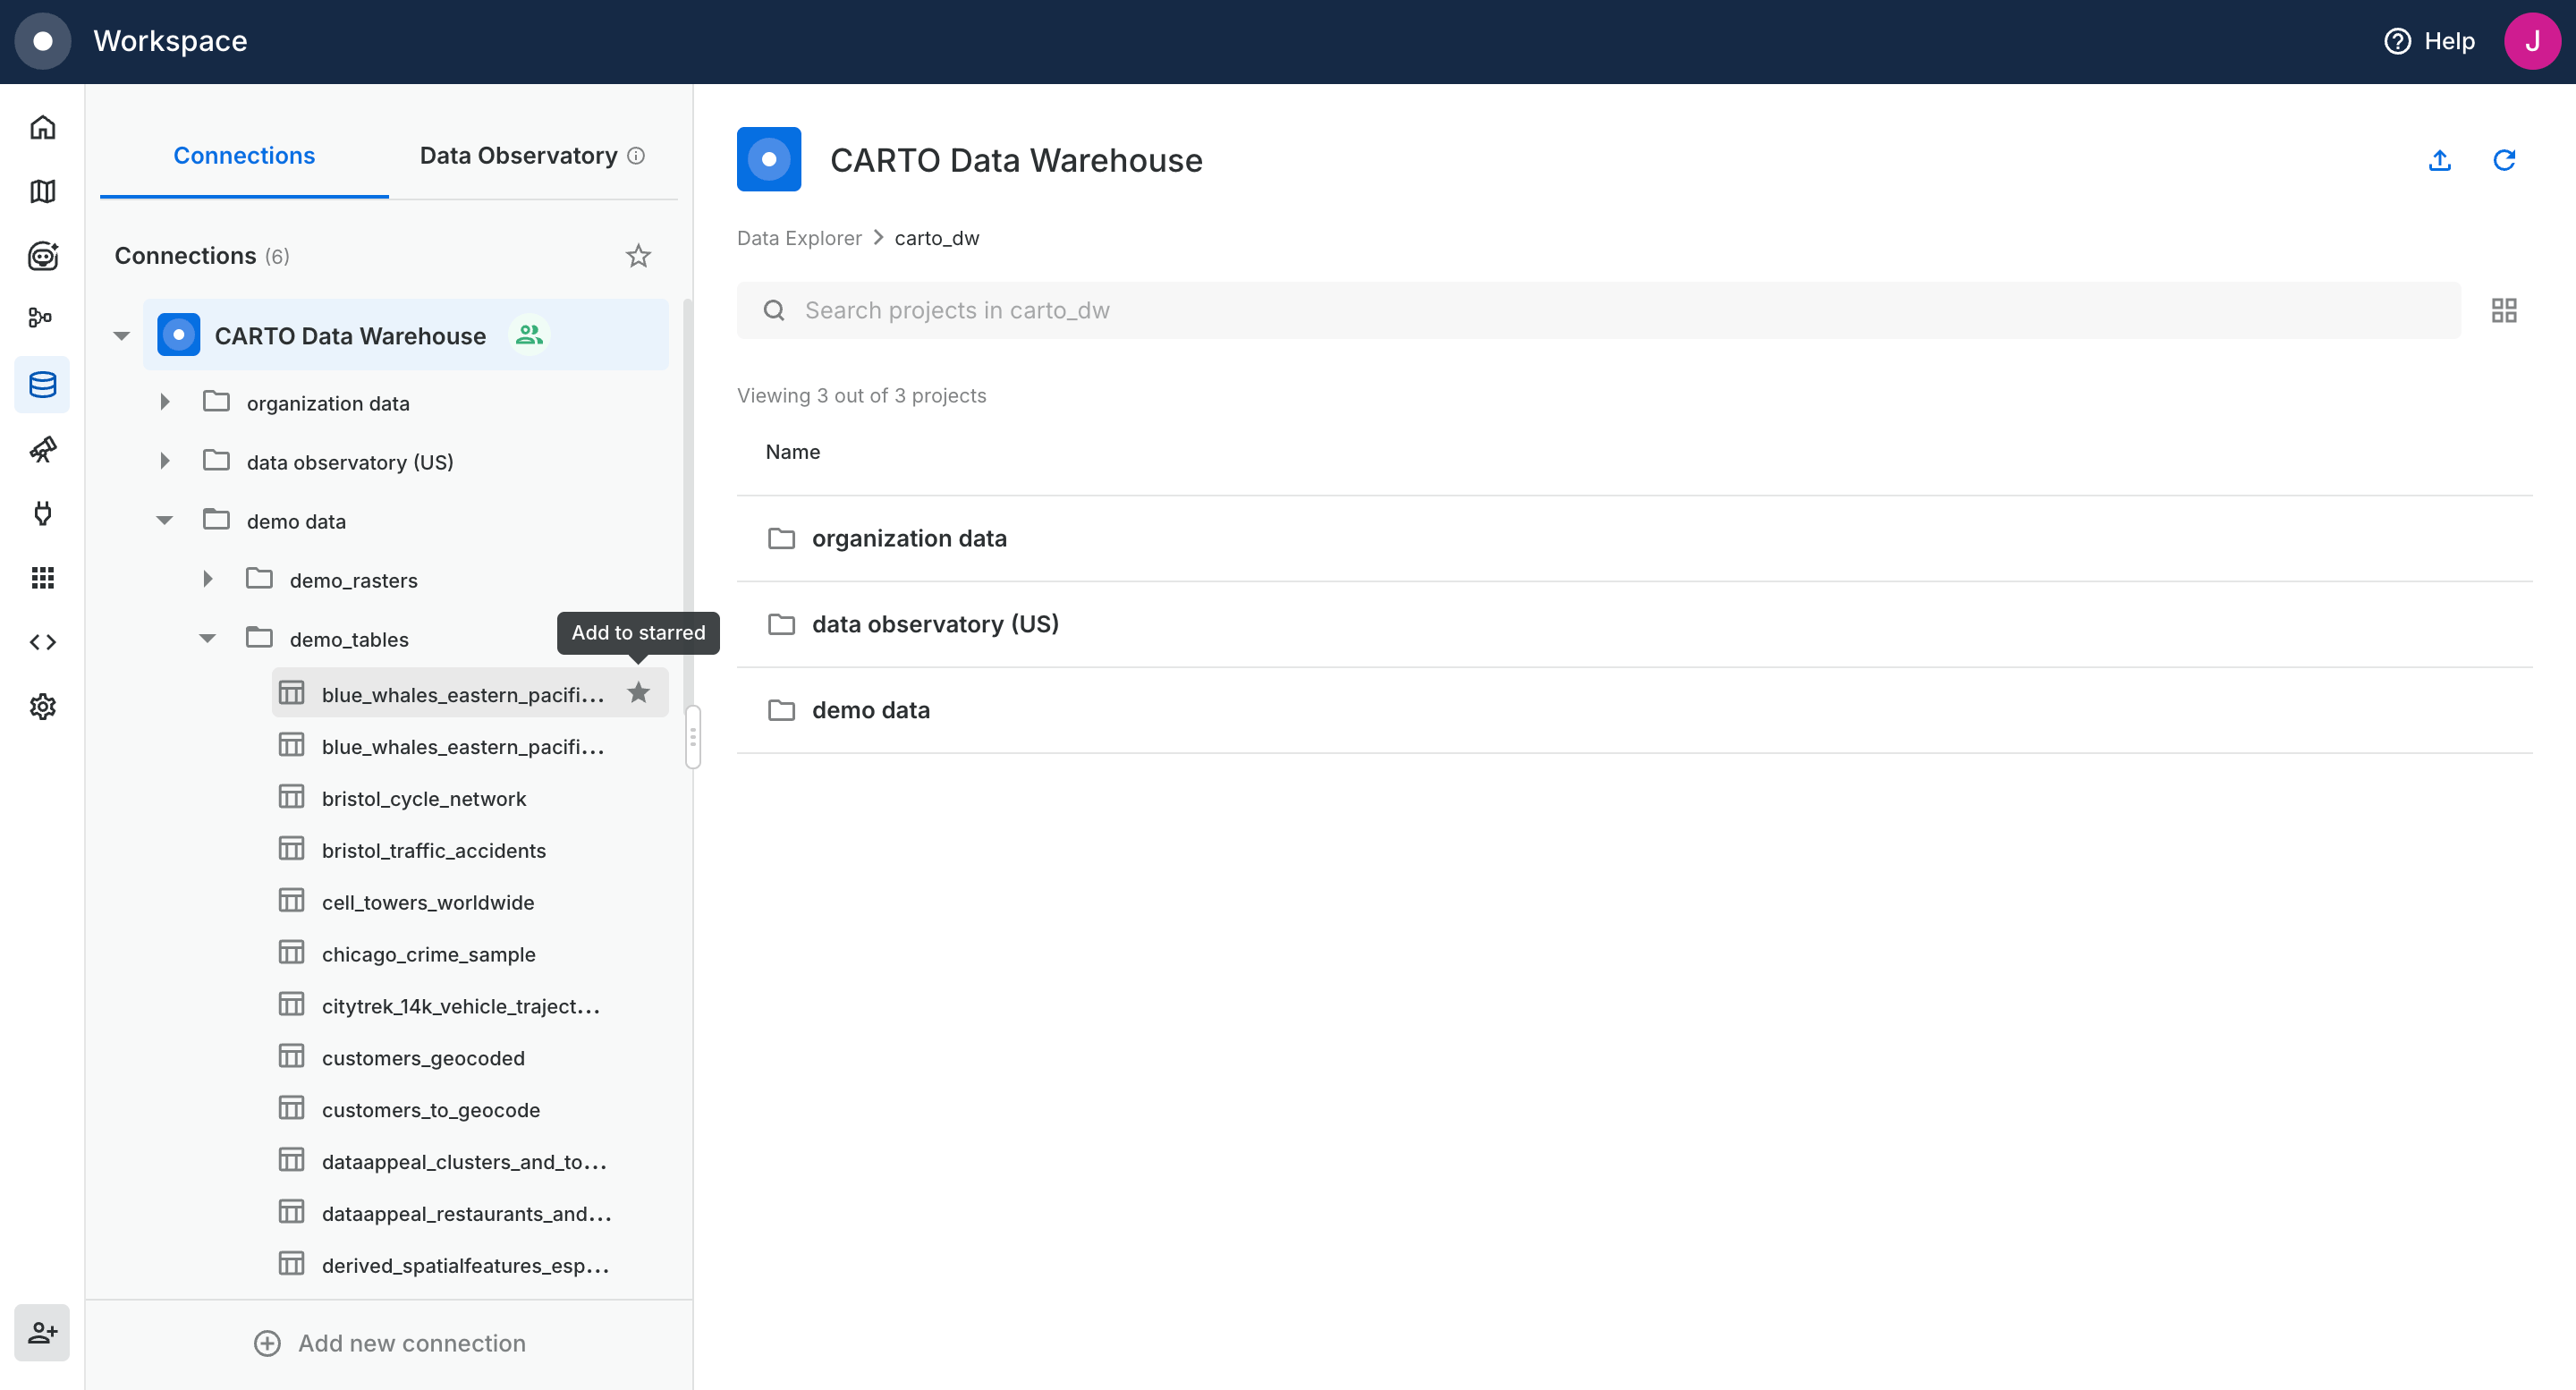
## Starring data assets for quicker access

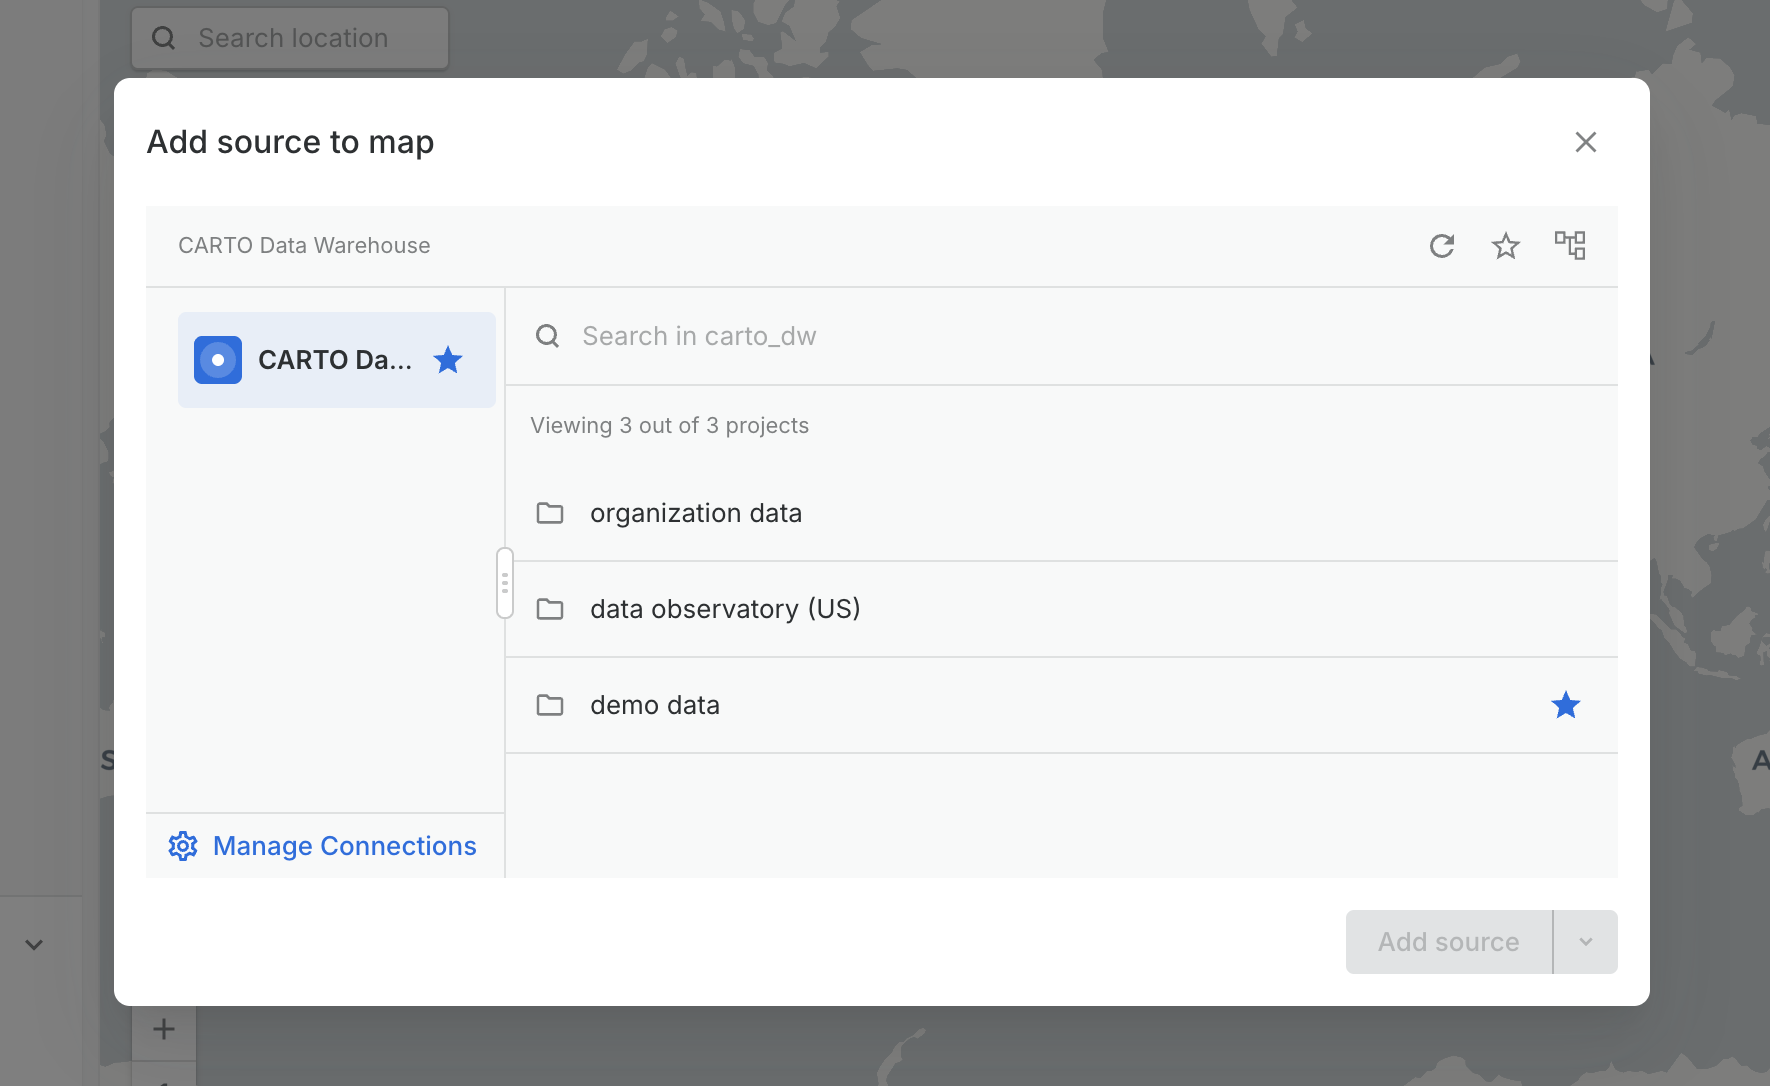
Users are now able to star items at any level in the Data Explorer, including connections, projects/databases/schemas, and the data tables themselves. Simply click on the star icon next to any item in the Data Explorer and then use the *Starred only* filter to show just your starred items.

This is especially helpful to users that have connections or data assets that are recurrently used in their maps and workflows. No more browsing the data tree until you find what you need!

Your starred items are now also easily accessible from the "Add data source" flow in CARTO Builder and from the data sources panel in CARTO Workflows.

To learn more about starring items and the Data Explorer in general, check out our [documentation](/carto-user-manual/data-explorer).

<figure><img src="/files/Qd2qiyeStKYXZmpXPJSM" alt=""><figcaption></figcaption></figure>
{% endupdate %}

{% update date="2025-11-07" tags="improvement,builder" %}

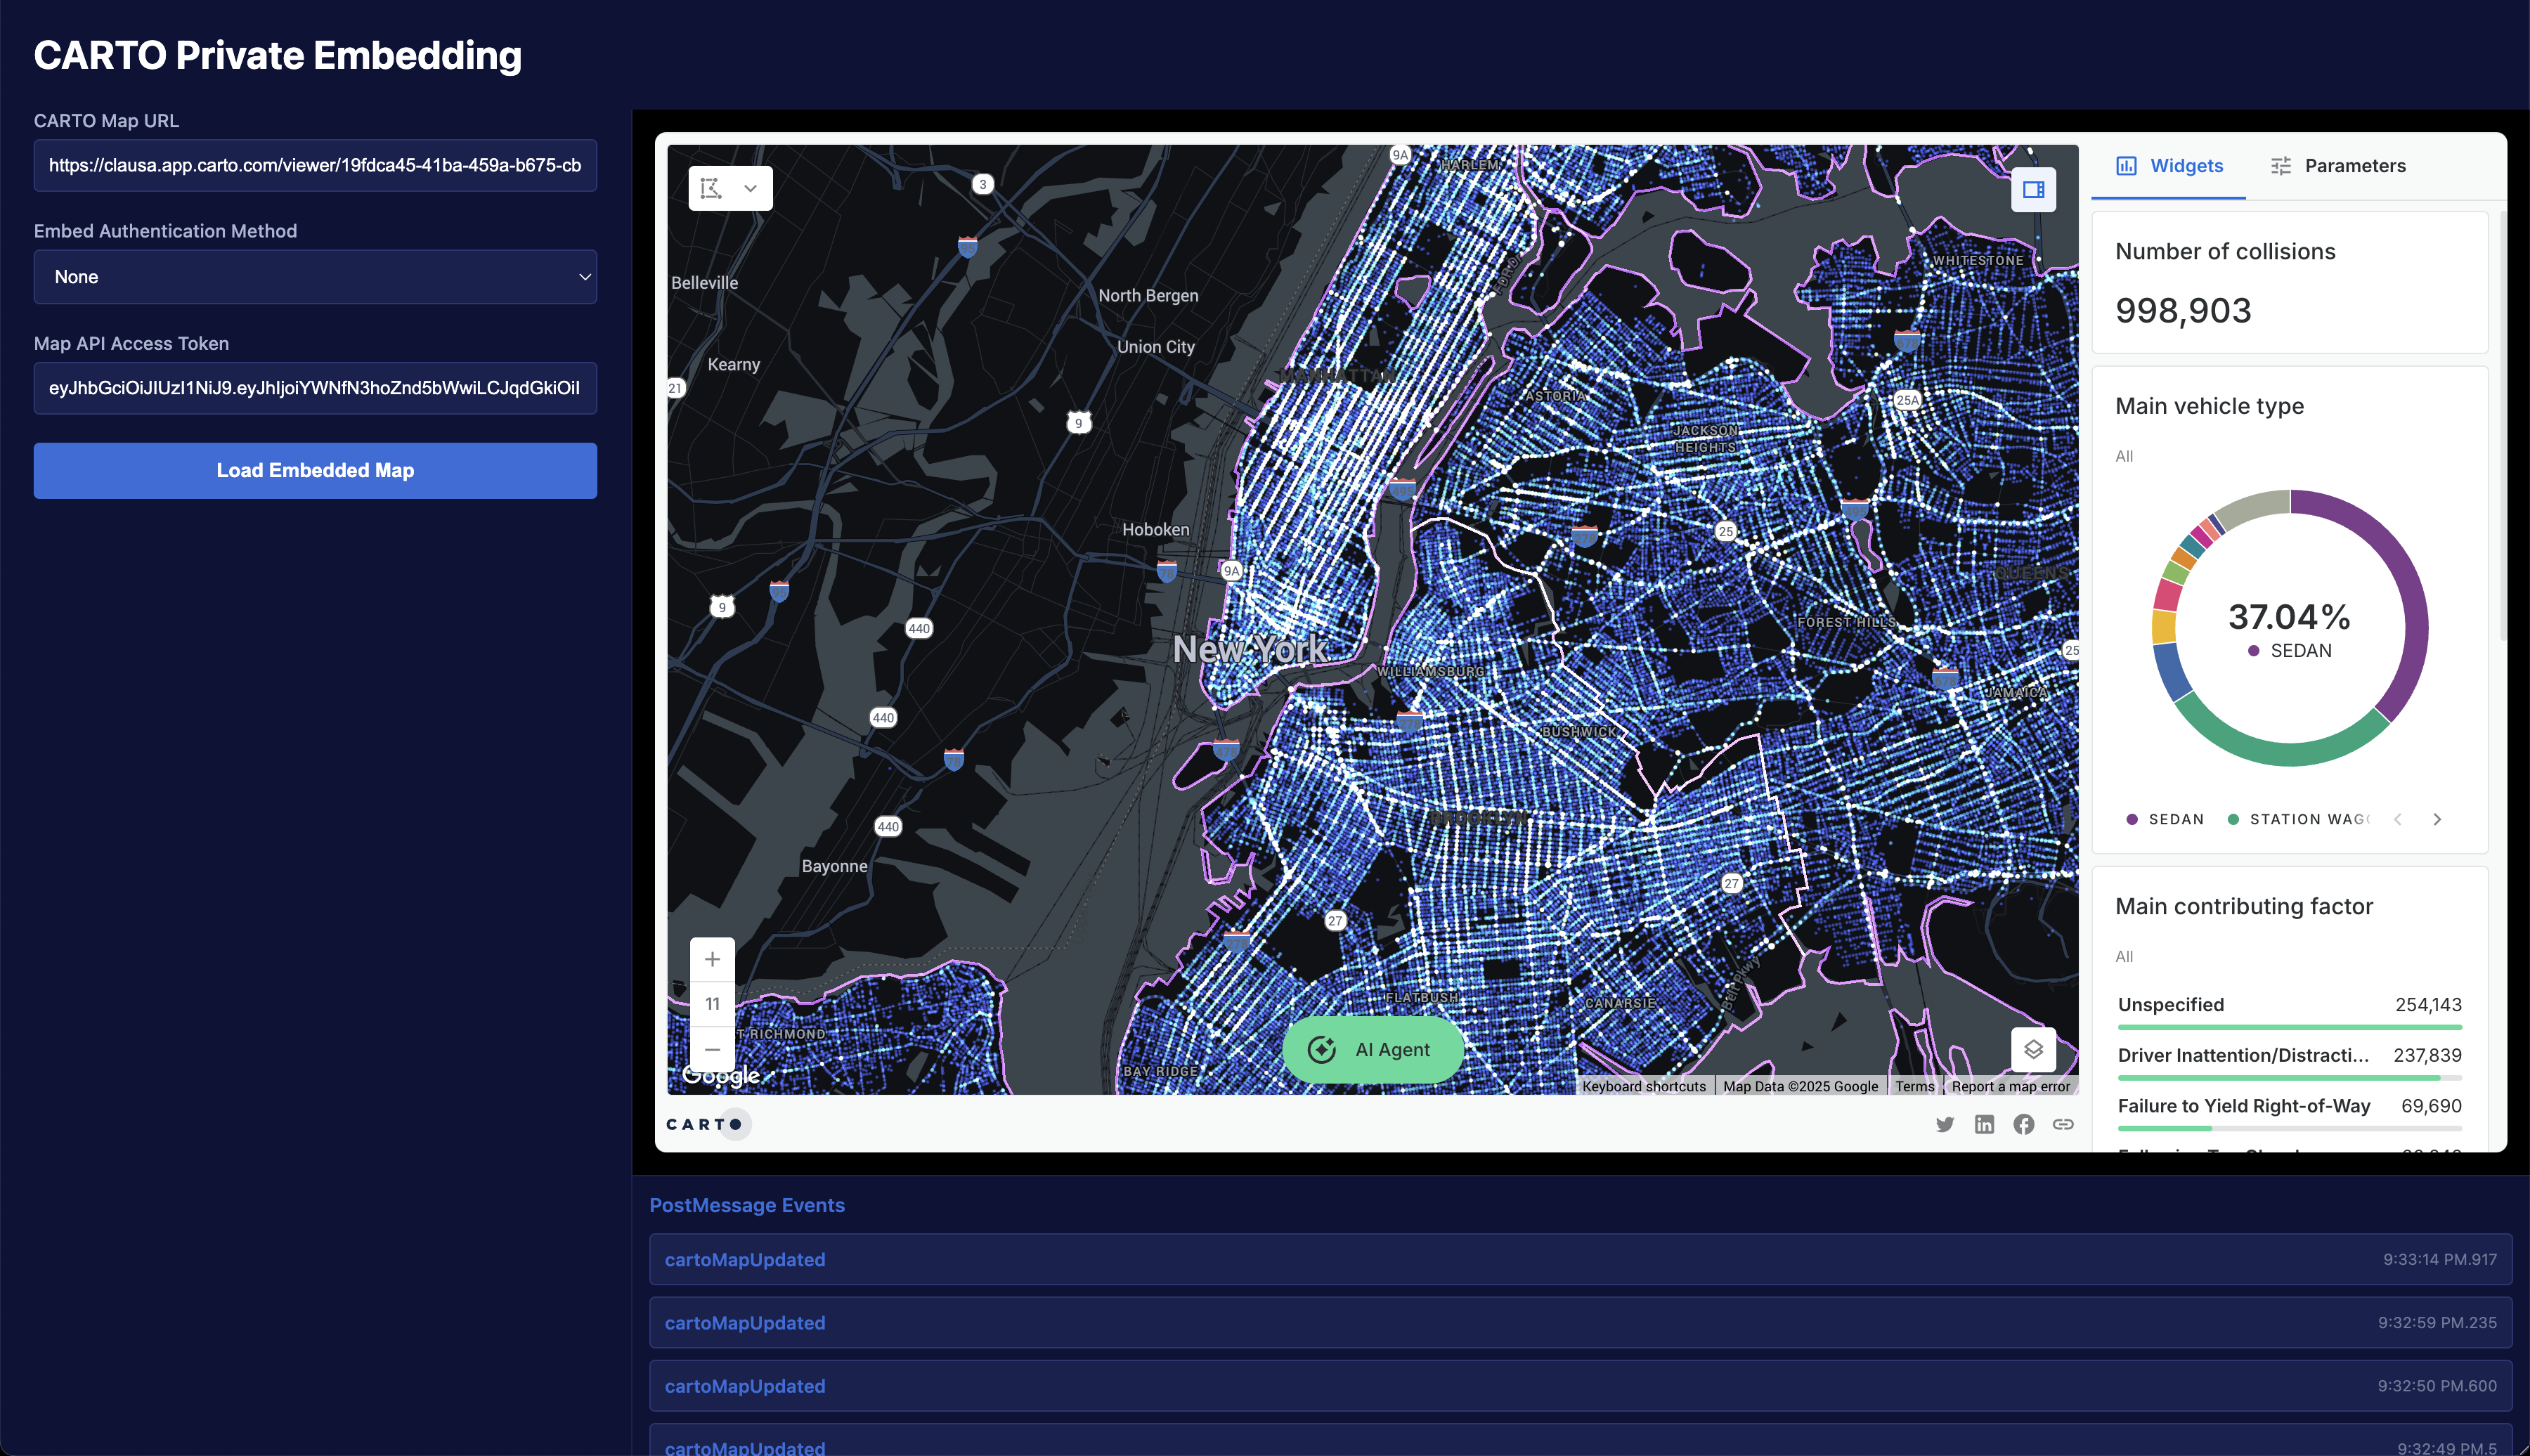
## Integrate CARTO maps anywhere with the new authenticated embeds and reactive map events

Embedding maps from CARTO in other webpages and applications just became exponentially easier and more powerful thanks to two additions to our platform:

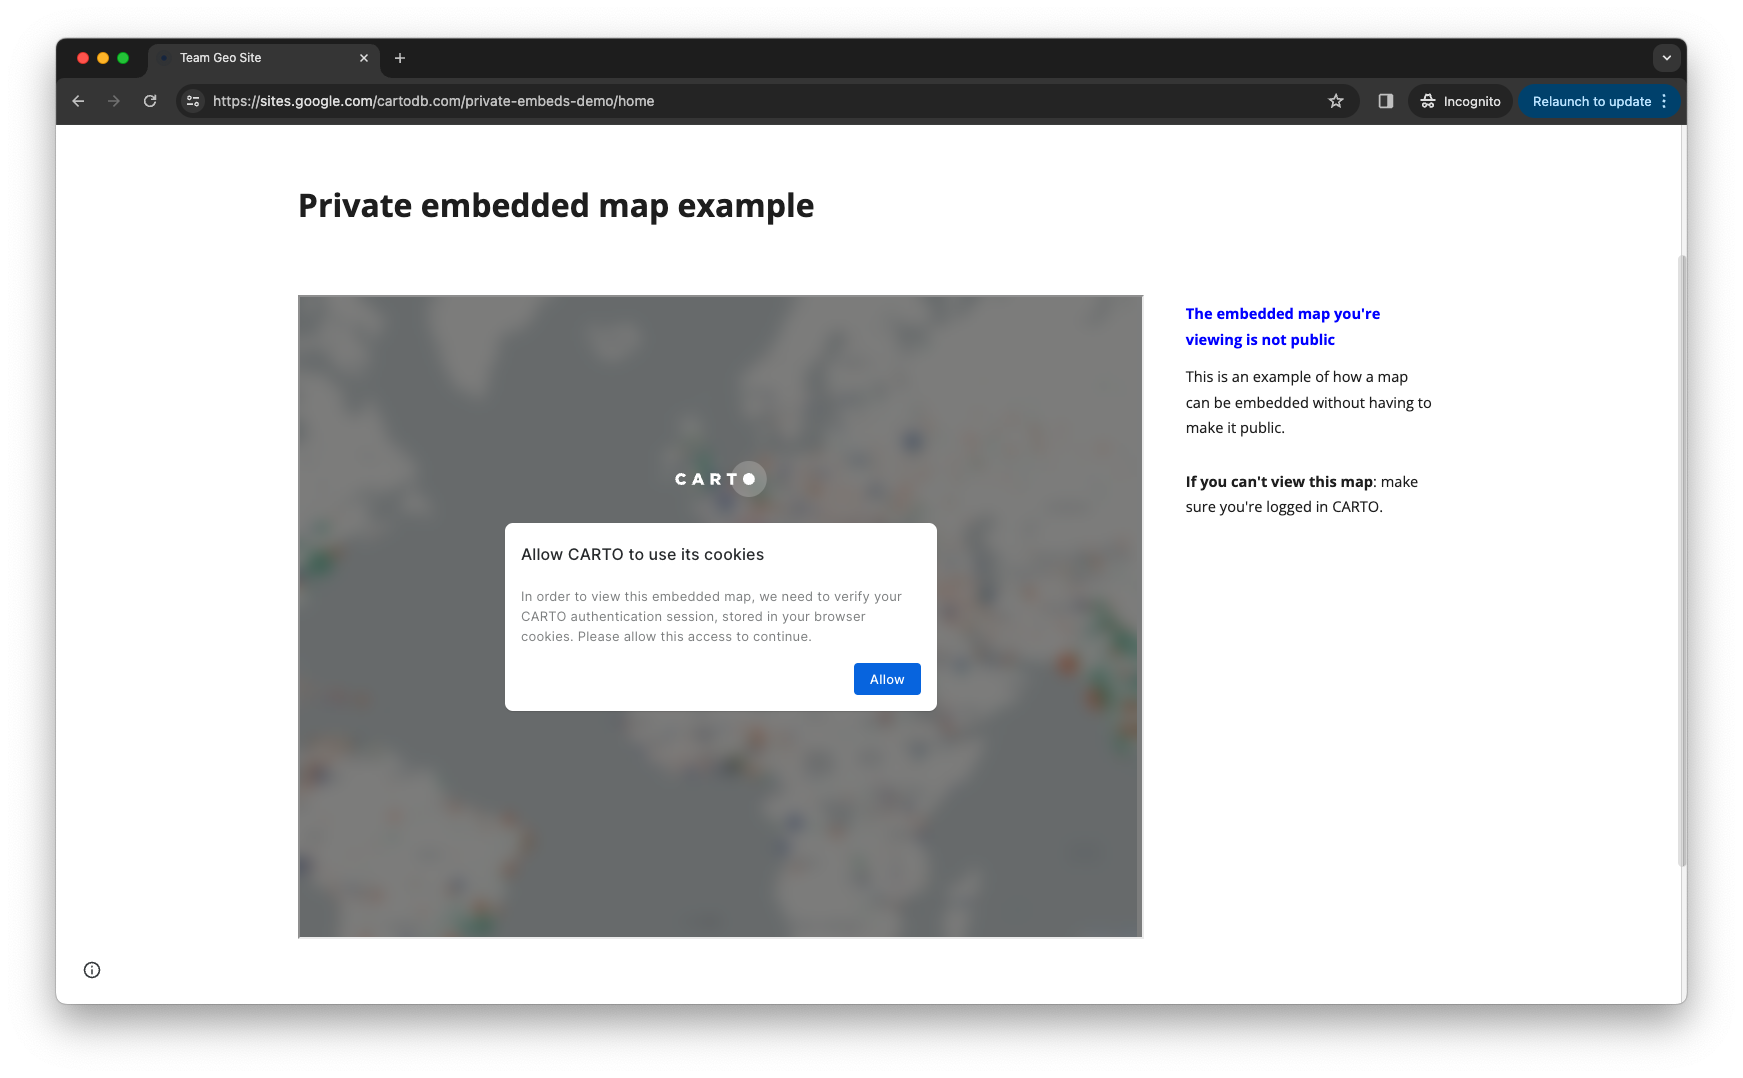
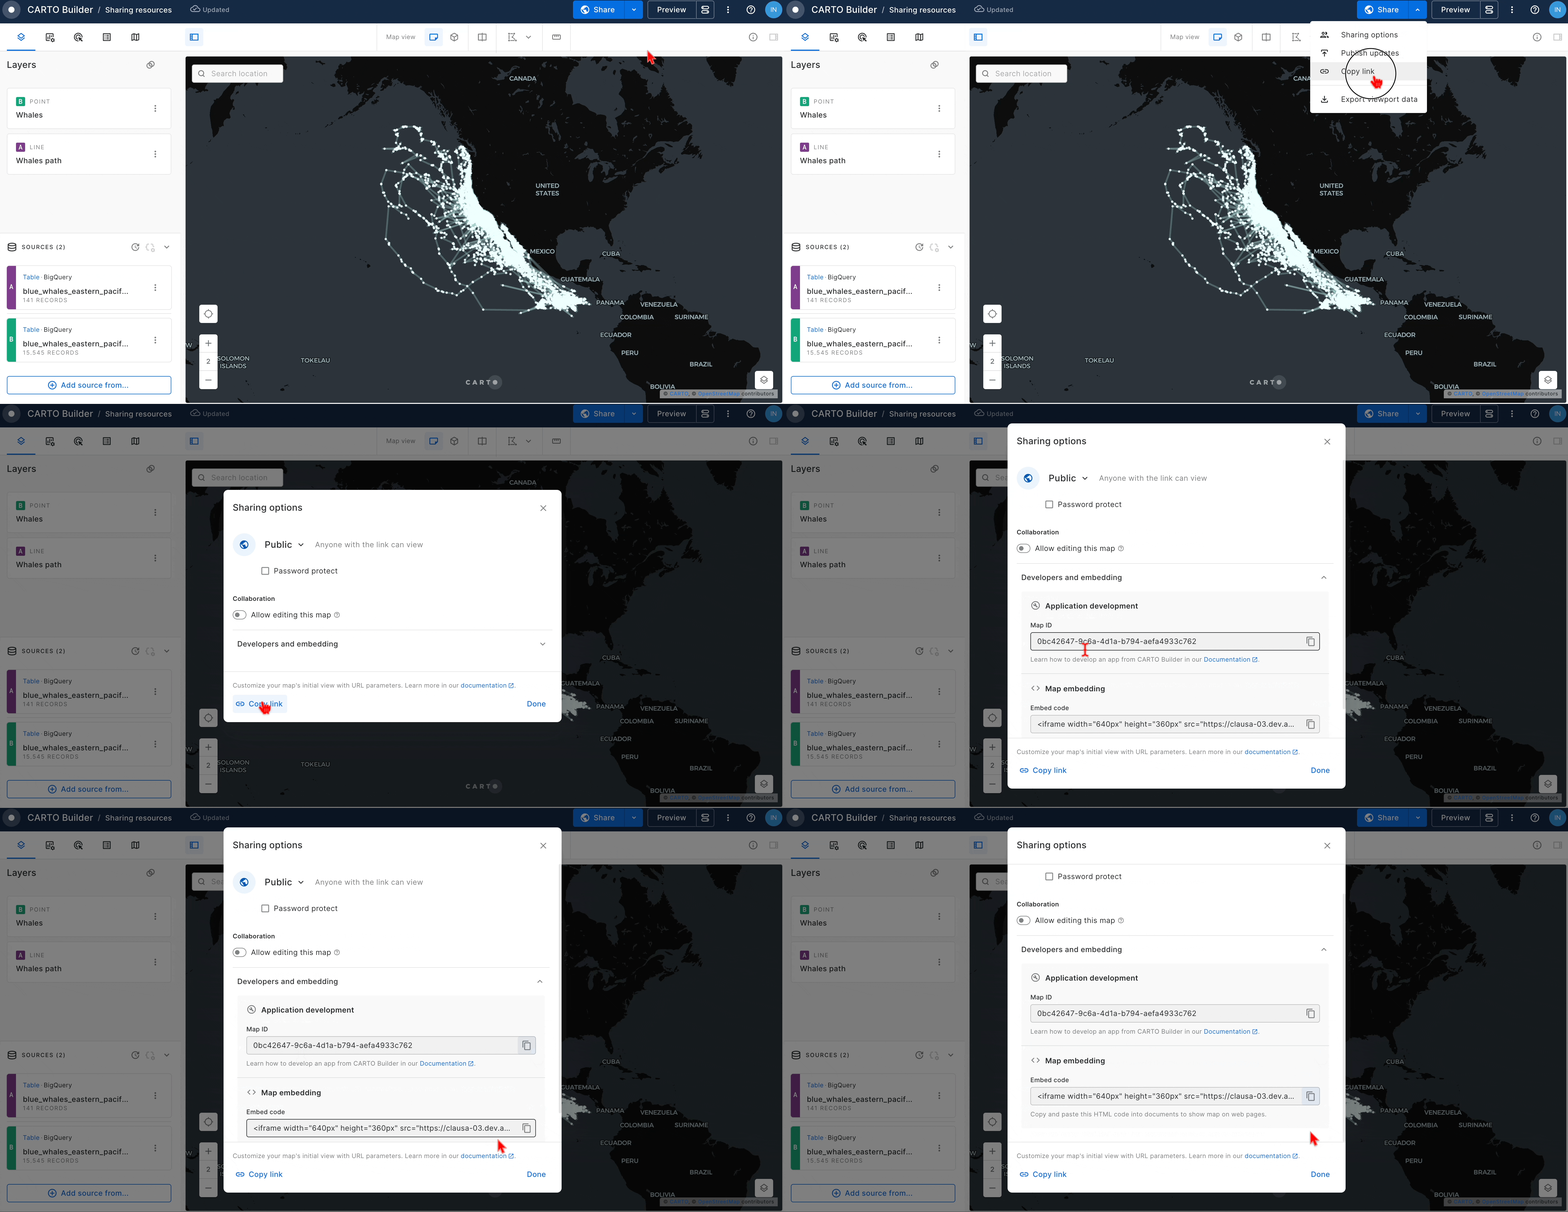
* **New methods for seamless and secure private embedding:** We added two new strategies to embed private maps securely, without having to publish the map or forcing the users to login in a different tab or browser. Developers can also re-use existing authorization in their applications. [Learn more about private embedding strategies](/carto-user-manual/maps/sharing-and-collaboration/embedding-maps#private-embedding).
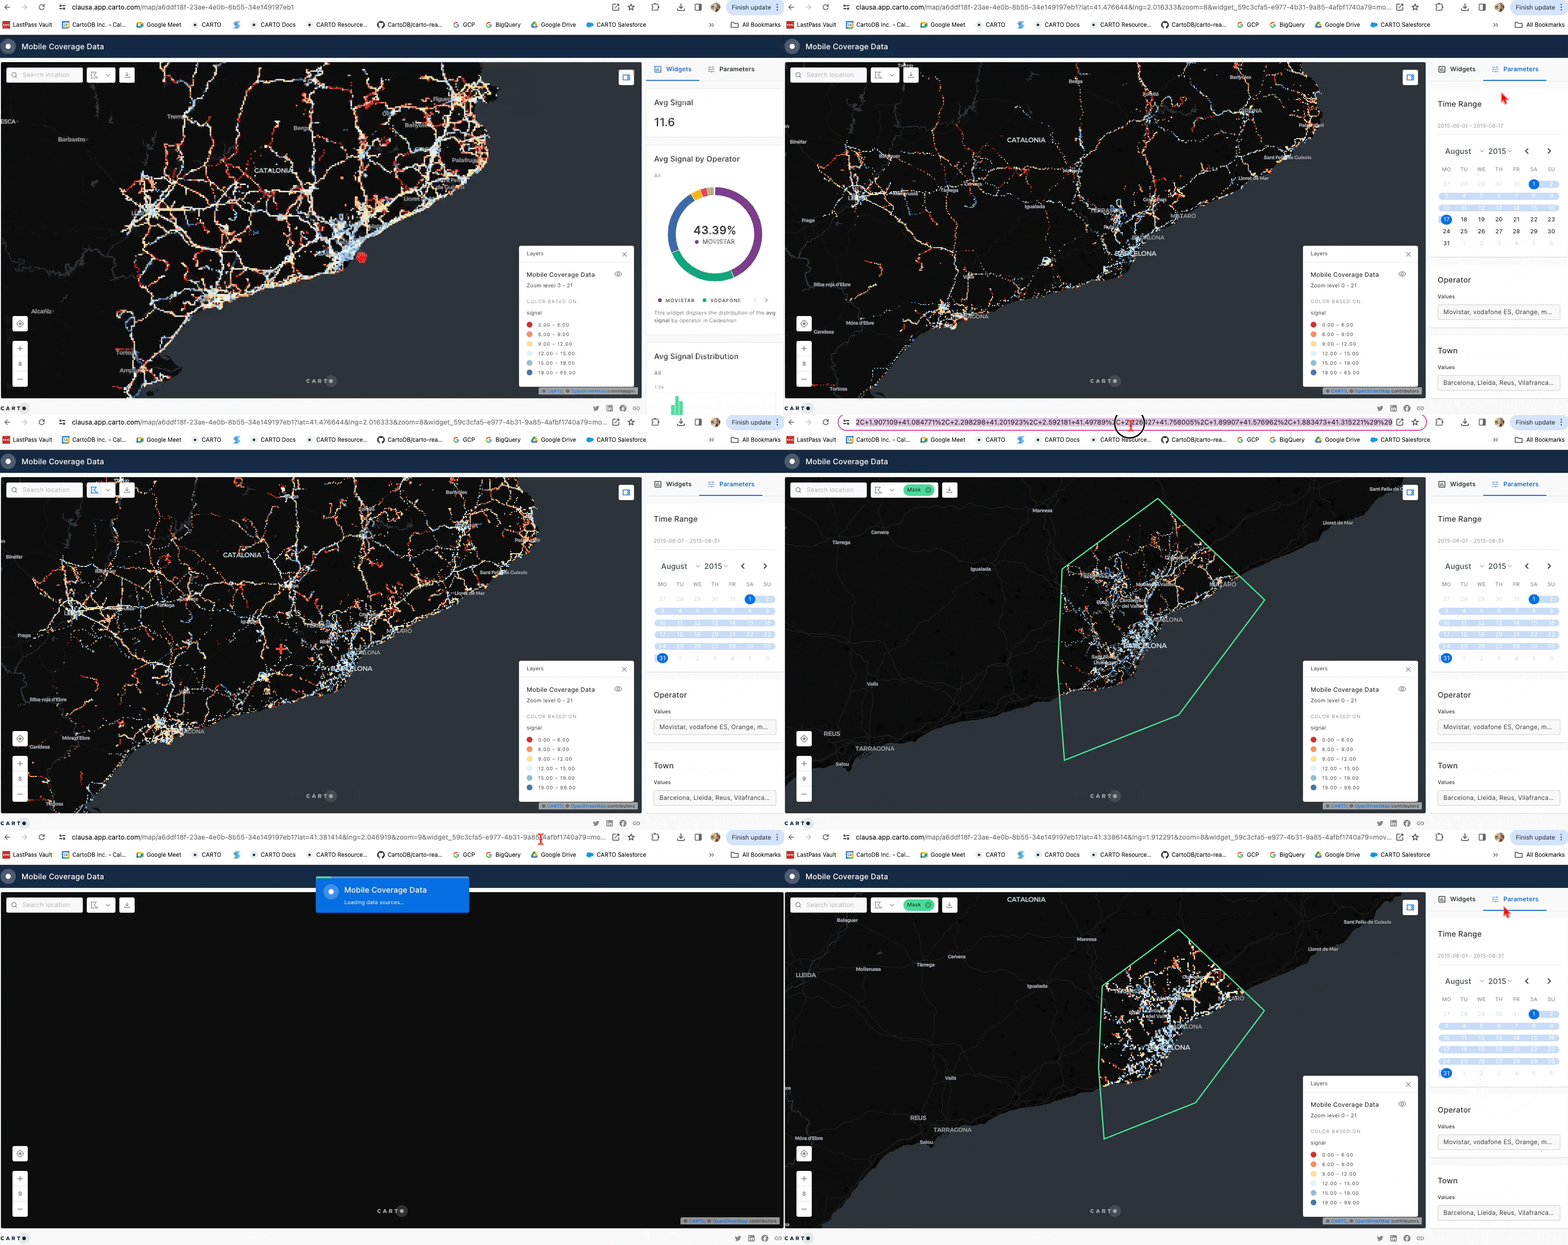
* **Build bi-directional interactive experiences with our embedded events:** Embedded maps from CARTO now send `postMessage` events every time something changes in the map. This allows the parent application to react, creating bi-directional interactive experiences when combined with our embed URL parameters. [Learn more about embedding events](/carto-user-manual/maps/sharing-and-collaboration/embedding-maps#listening-to-events-from-embedded-maps).

We're excited to see where you will embed your next CARTO map!

<figure><img src="/files/meH0zDqHA6dX0PYayhAI" alt=""><figcaption></figcaption></figure>
{% endupdate %}

{% update date="2025-11-06" tags="new,builder" %}

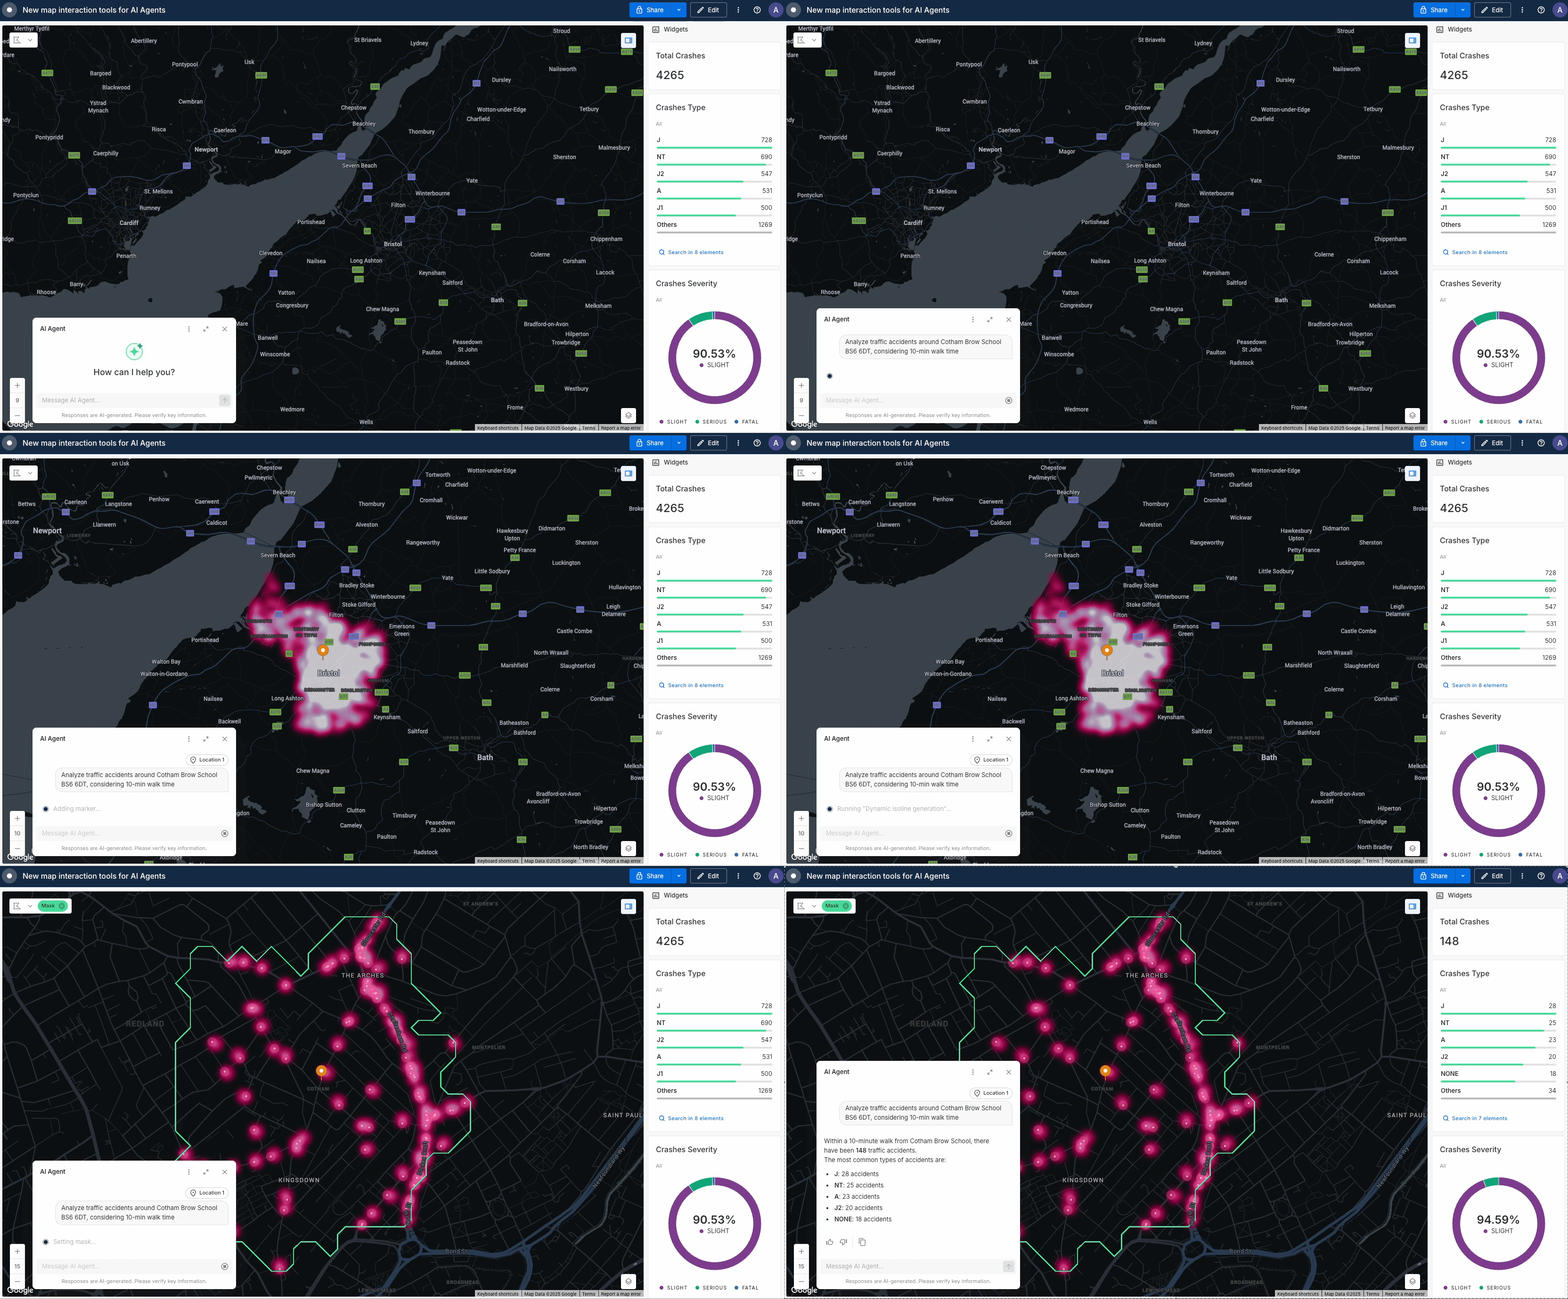
## New map interaction tools for AI Agents

AI Agents can now interact directly with your maps through two new tools:

**Dynamic marker placement**: Ask the AI Agent to mark specific locations, and it will instantly place markers on your map. Simply provide an address, place name, or coordinates—the agent handles geocoding and placement automatically.

**Spatial filtering by area**: The AI Agent can define custom areas of interest to filter your data dynamically. When an area is set, all map widgets and layers update automatically to show only data within that region.

These tools enable your AI Agent to provide immediate visual context and perform focused analysis on specific geographic areas without manual configuration.

[Learn more in our documentation](/carto-user-manual/ai-agents/working-with-tools#map-tools).

<figure><img src="/files/EZnLAdQLkTwzXG3yvn5W" alt=""><figcaption></figcaption></figure>
{% endupdate %}

{% update date="2025-10-08" tags="new,builder" %}

## Introducing Agentic GIS in CARTO: making spatial insights available to everyone

We are incredibly excited to announce new features that bring enterprise-grade geospatial agentic experiences to CARTO.

* **Introducing AI Agents in Builder:** [CARTO AI Agents](/carto-user-manual/ai-agents) (now in General Availability) provide a conversational interface in your maps where your end users can get instant and actionable geospatial insights through natural language.
* **AI Agents can now query sources, generate layers and more:** We've added a ton of exciting capabilities that allow agents to reason and perform geospatial analysis autonomously.
* **Integrate Workflows as tools for your AI Agents:** From building operational dashboards to running complex analyses, your AI Agent can be supercharged with your own custom workflows [enabled as MCP tools](/carto-user-manual/workflows/workflows-as-mcp-tools).
* **Evolved experience to tailor your Agent:** You can now reference tools, sources, and other context available in the map when customizing your agent.
* **Use your own AI models:** [Configure your own AI models](/carto-user-manual/settings/carto-ai) and maintain total control over the AI technology used. Supported providers include Google Gemini and Open AI, with others coming soon.

With CARTO you can now create and share access to powerful geospatial AI Agents tailored to your specific needs. Combine your custom prompt instructions with CARTO's built-in geospatial intelligence and your own workflows, and **build trustworthy AI solutions that make complex geospatial analysis accessible to any user within your organization**.

Get started today by [enabling CARTO AI in your organization](/carto-user-manual/settings/carto-ai).

And learn more about Agentic GIS in our [announcement blog post](https://carto.com/blog/agentic-gis-bringing-ai-driven-spatial-analysis-to-everyone)!

<figure><img src="/files/wdSxYuACCOWNvbkcsZVJ" alt=""><figcaption></figcaption></figure>
{% endupdate %}

{% update date="2025-10-08" tags="new,workflows" %}

## Turn your AI Agents into geospatial experts with CARTO MCP Server

CARTO now supports the **Model Context Protocol (MCP)**, a standard that enables AI Agents to interact with external tools and data sources. With the new **CARTO MCP Server**, organizations can now expose their own geospatial [Workflows as MCP Tools](/carto-user-manual/workflows/workflows-as-mcp-tools) that any MCP-compliant agent can use.

This release allows GIS teams to design custom workflows in CARTO—defining inputs, outputs, and logic specific to their spatial problems—and make them available to AI Agents through the MCP Server. Each tool includes detailed metadata following the MCP specification, ensuring interoperability across agentic AI environments.

By combining Workflows and the MCP Server, organizations can empower AI Agents to perform advanced spatial analysis, automate geospatial decision-making, and connect AI-driven applications to their cloud data infrastructure.

{% embed url="<https://vimeo.com/1125236398?autoplay=1>" %}
{% endupdate %}

{% update date="2025-09-30" tags="new,workflows" %}

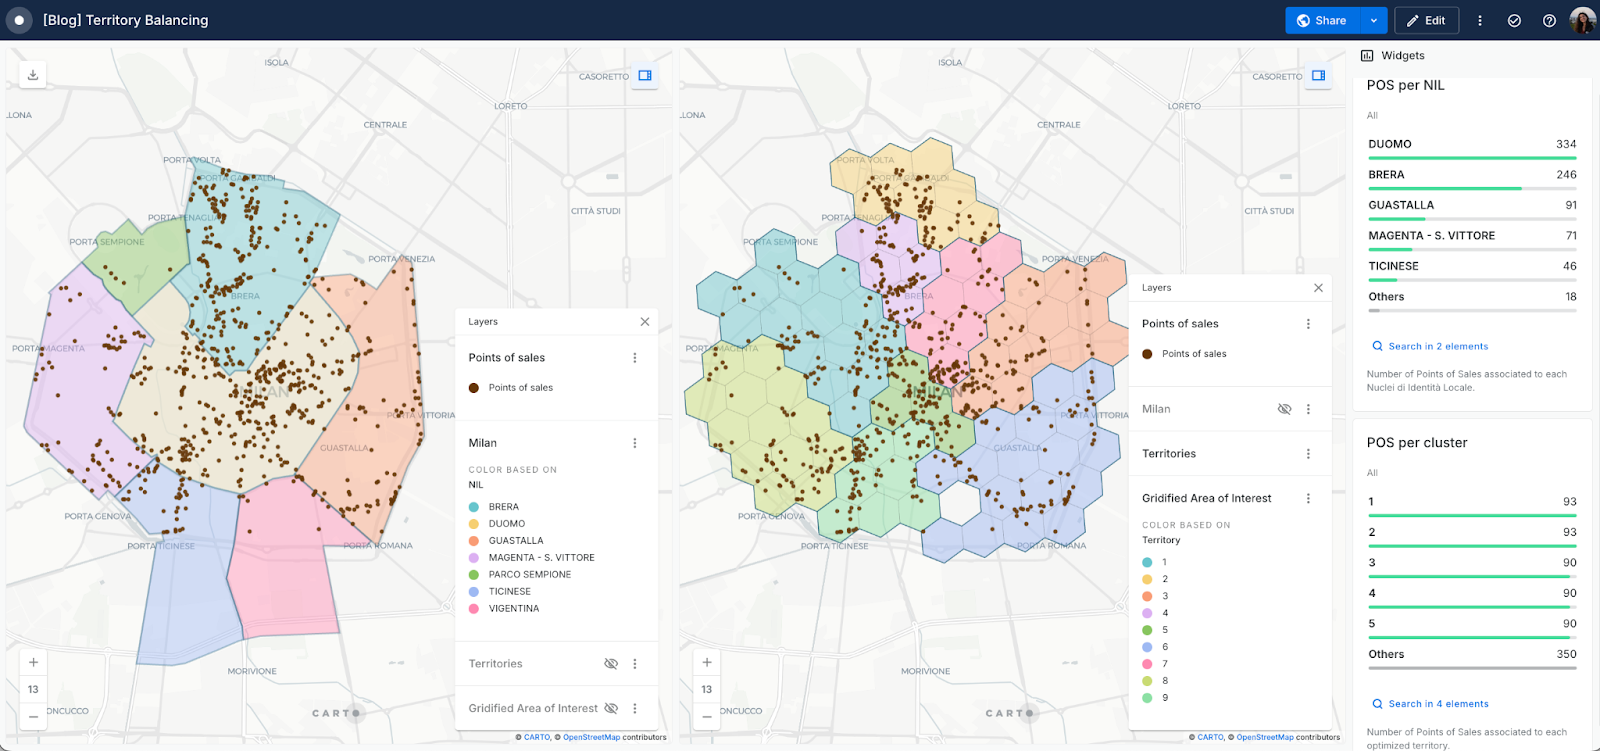
## Territory Balancing and Location Allocation components in Workflows

CARTO's new [Territory Planning Extension Package](/carto-user-manual/workflows/components/territory-planning) for Workflows has been built to power location allocation and territory balancing directly within CARTO and your data warehouse, this extension helps analysts and planners create fair, efficient, and data-driven territory strategies.

* [Territory Balancing](https://docs.carto.com/carto-user-manual/workflows/components/territory-planning#territory-balancing) – Divide an area into continuous, optimized territories that are balanced according to a chosen metric (e.g. consumer demand or other business KPIs), while keeping each territory internally cohesive. Learn more about this new capability following this [tutorial](https://academy.carto.com/creating-workflows/step-by-step-tutorials/optimizing-workload-distribution-through-territory-balancing).
* [Location Allocation](https://docs.carto.com/carto-user-manual/workflows/components/territory-planning#location-allocation) – Find the optimal locations to open facilities (stores, warehouses, service hubs) and efficiently assign demand points (retail stores, populated regions) to them, minimizing costs or maximizing coverage. Take a look at this [tutorial](https://academy.carto.com/creating-workflows/step-by-step-tutorials/transforming-telco-network-management-decisions-with-location-allocation) to learn more!.

This extension package is currently available for Google BigQuery and Snowflake.

<figure><img src="/files/k0tnUGZfyMuHHkOhYIZ1" alt=""><figcaption></figcaption></figure>
{% endupdate %}

{% update date="2025-08-28" tags="improvement,workspace" %}

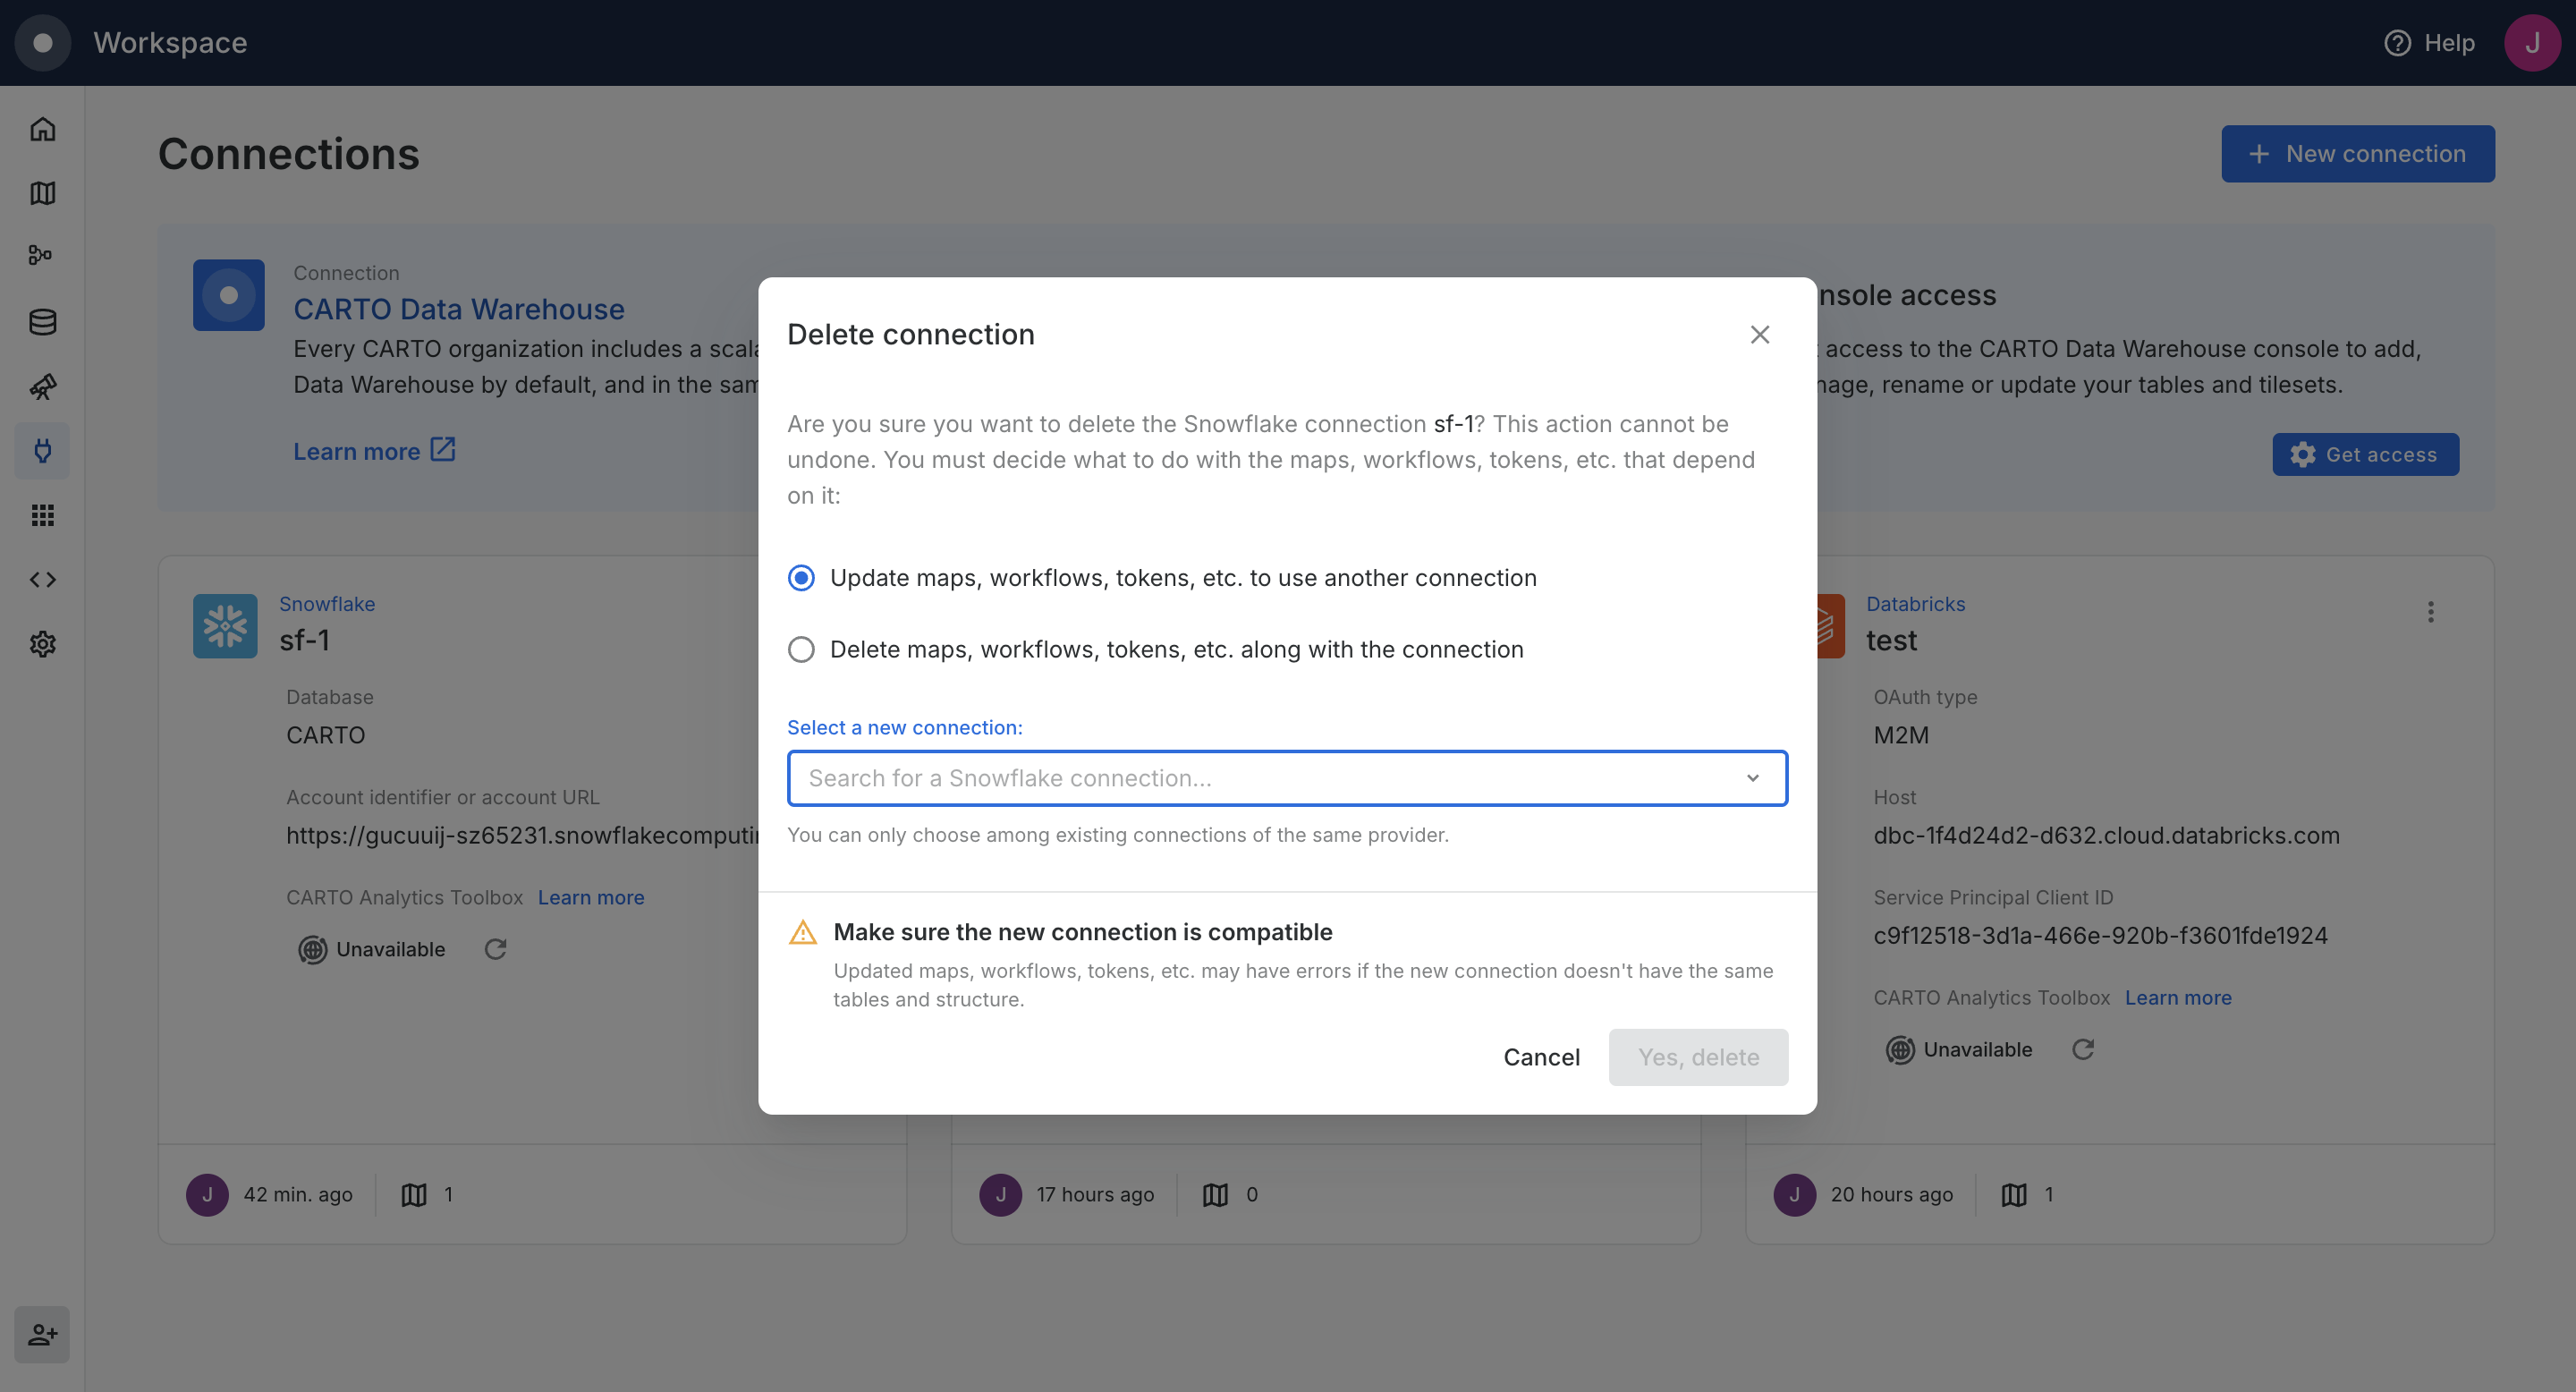
## Improved flow for deleting connections

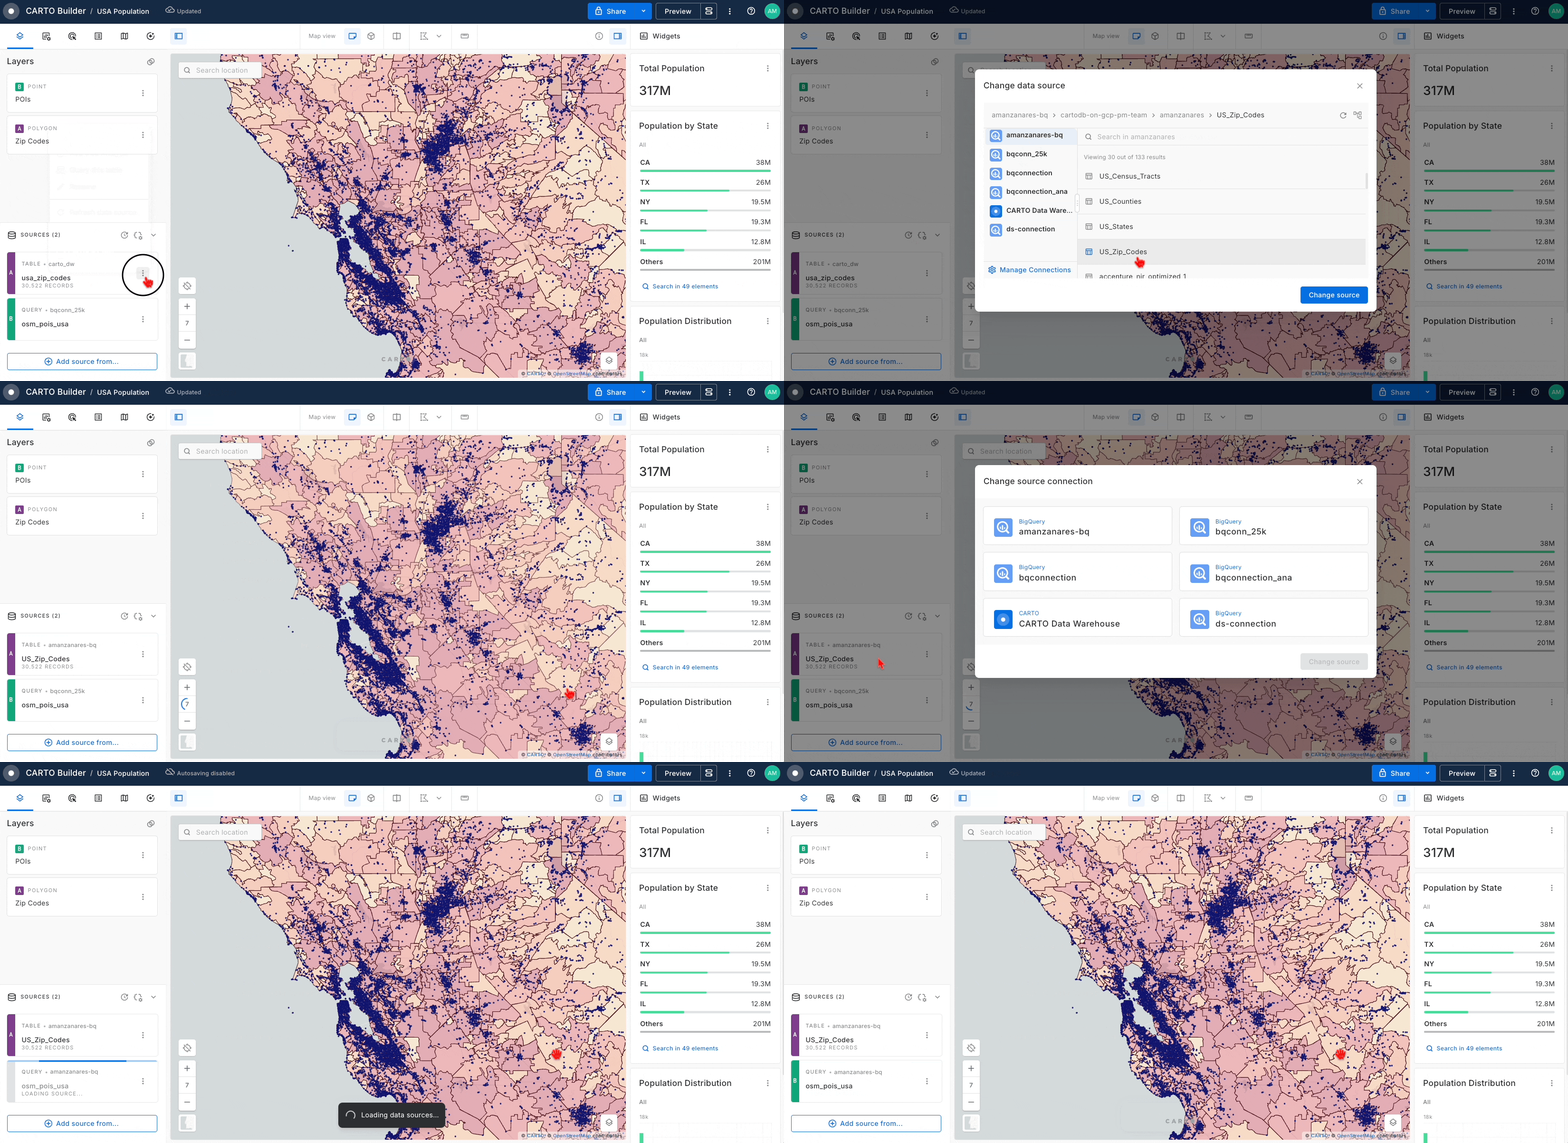
We've added a new option for users deleting connections so that all maps, workflows, tokens, etc. using the connection are updated to use another connection. Previously, users had to either update each asset individually or delete the connection along with all assets using it.

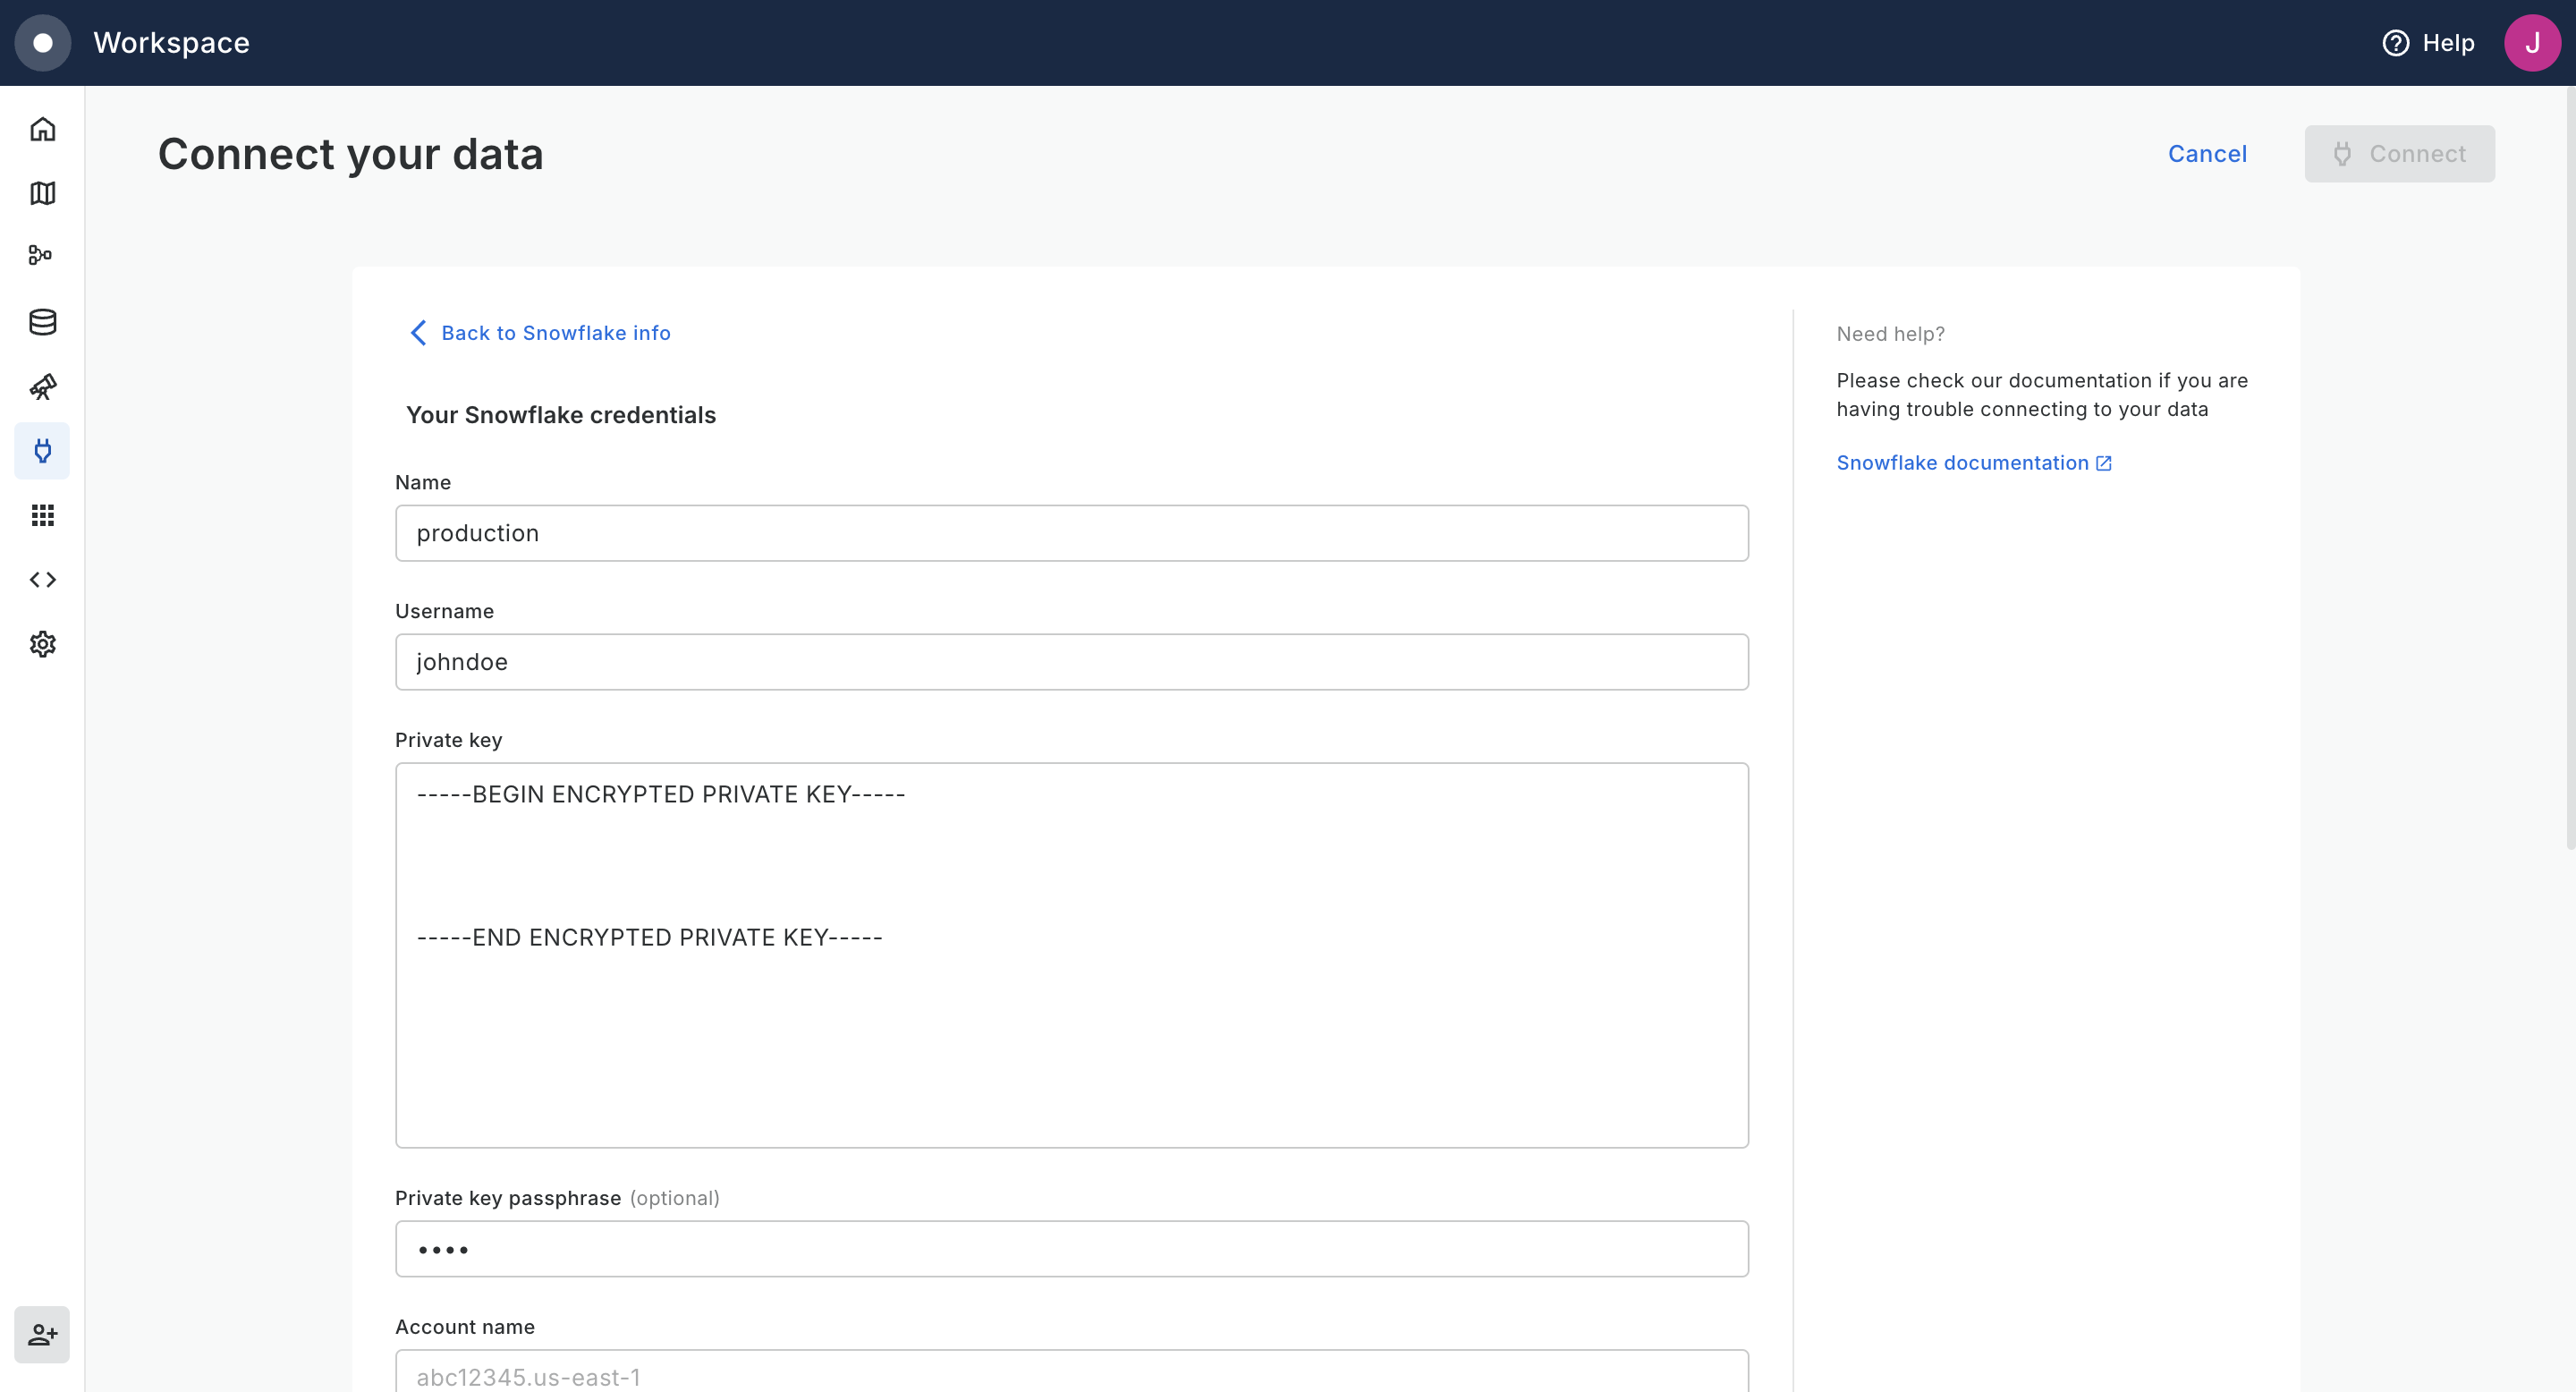
This new option vastly facilitates migrating from one connection to another, which is a common case when upgrading authentication types (changing from username/password to key pair or OAuth, for example).

Alternatively, users can still choose to delete the connection along with all assets that use it. For more information, see our article on [deleting connections](/carto-user-manual/connections/deleting-a-connection).

<figure><img src="/files/Uy9aeDoZOuA5RW6bf2w3" alt=""><figcaption></figcaption></figure>
{% endupdate %}

{% update date="2025-08-28" tags="improvement,workspace" %}

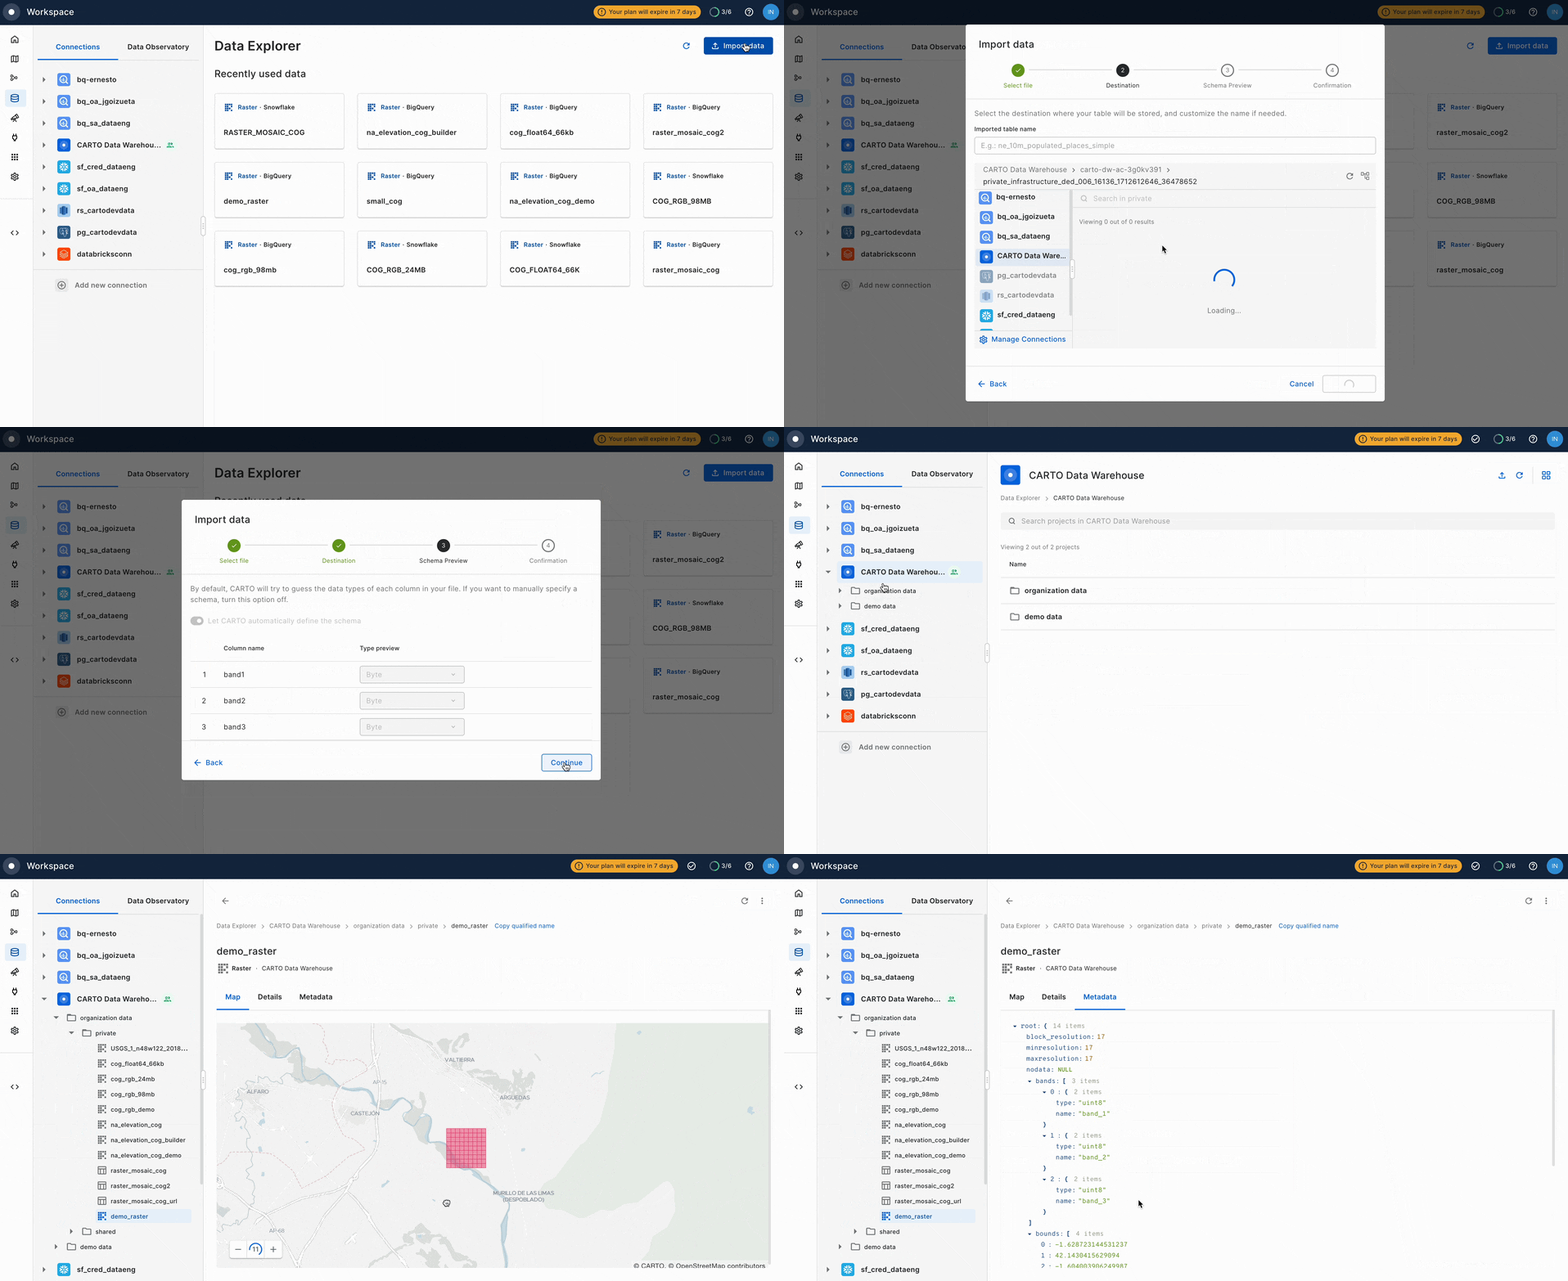
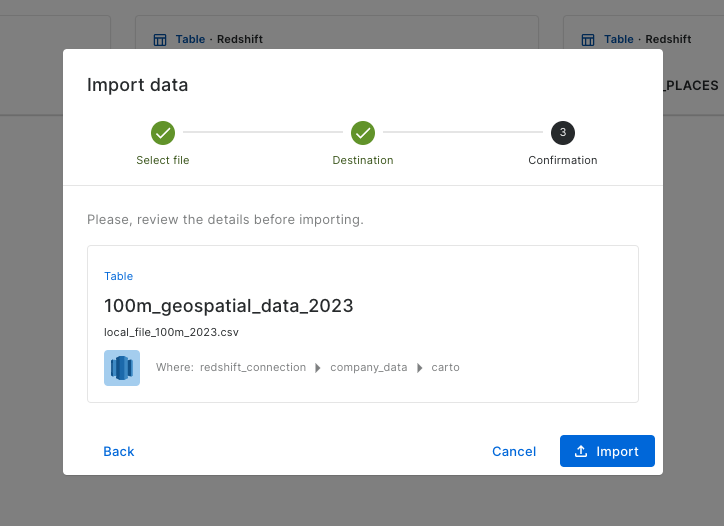
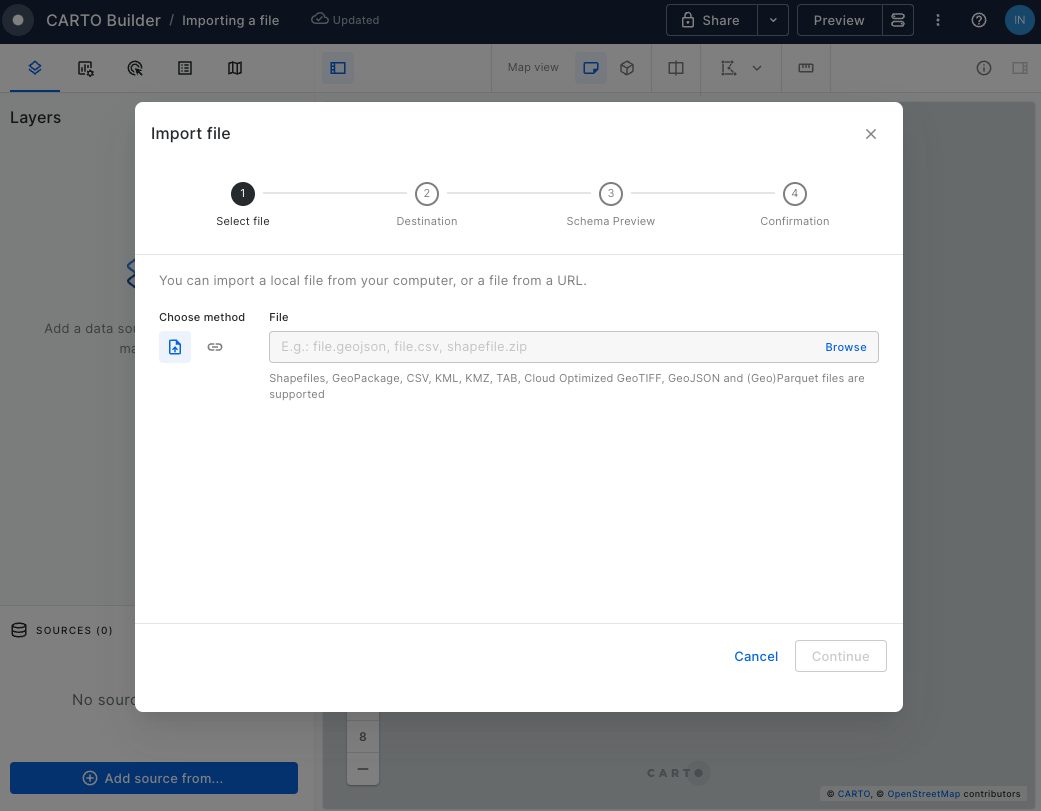
## Improvements to importing geospatial data into cloud data warehouses

Recent updates have enhanced the experience of importing geospatial data into cloud data warehouses, with improvements in performance, scalability, and raster support.

Import operations now run faster thanks to a new, optimized process. The maximum supported file size has also been raised from **1GB to 5GB**, addressing a very frequent need when working with large geospatial datasets.

Raster-processing capabilities have been extended in **BigQuery and Snowflake**, supporting the import of non-COG GeoTIFF rasters into warehouse tables following the [Raquet specification](https://github.com/CartoDB/raquet?utm_source=chatgpt.com). This removes the strict preparation steps previously required for Cloud Optimized GeoTIFFs, making the process considerably simpler. Combined with the higher size limit, these updates provide a more efficient way for customers to bring raster data into their cloud environment.

{% embed url="<https://vimeo.com/1114283760?autoplay=1&share=copy>" %}
{% endupdate %}

{% update date="2025-08-27" tags="improvement,builder" %}

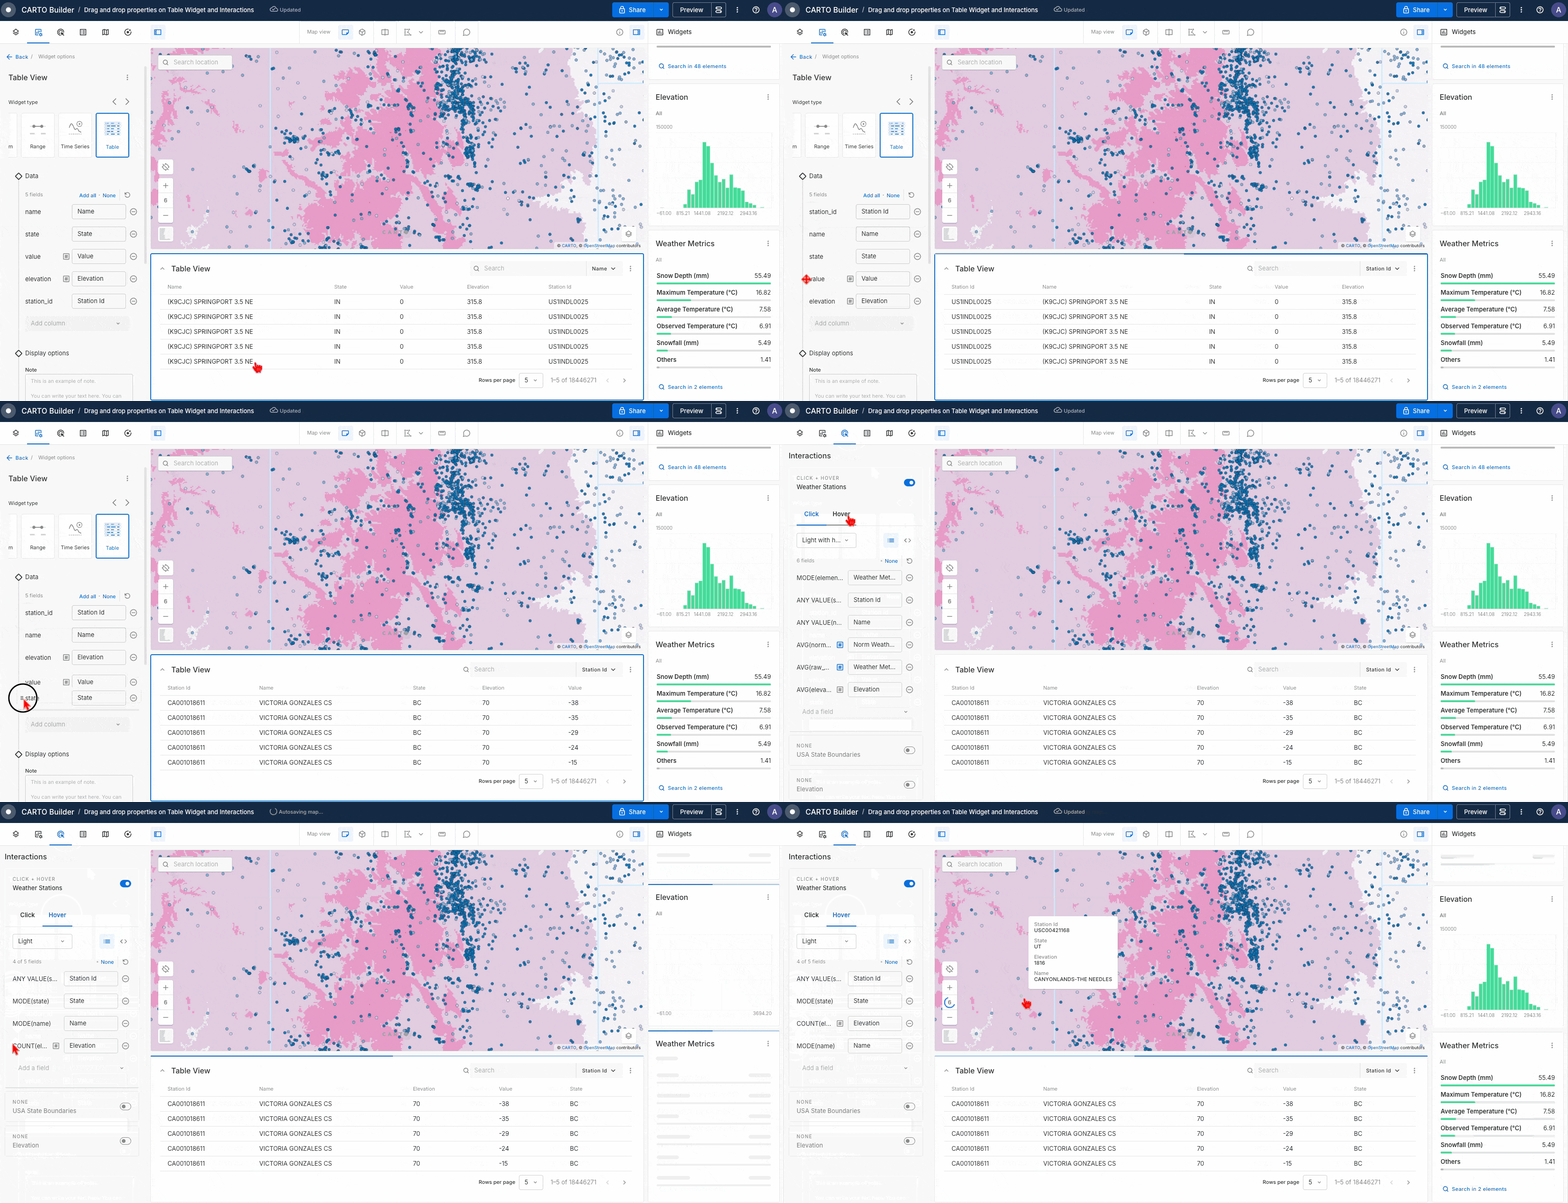
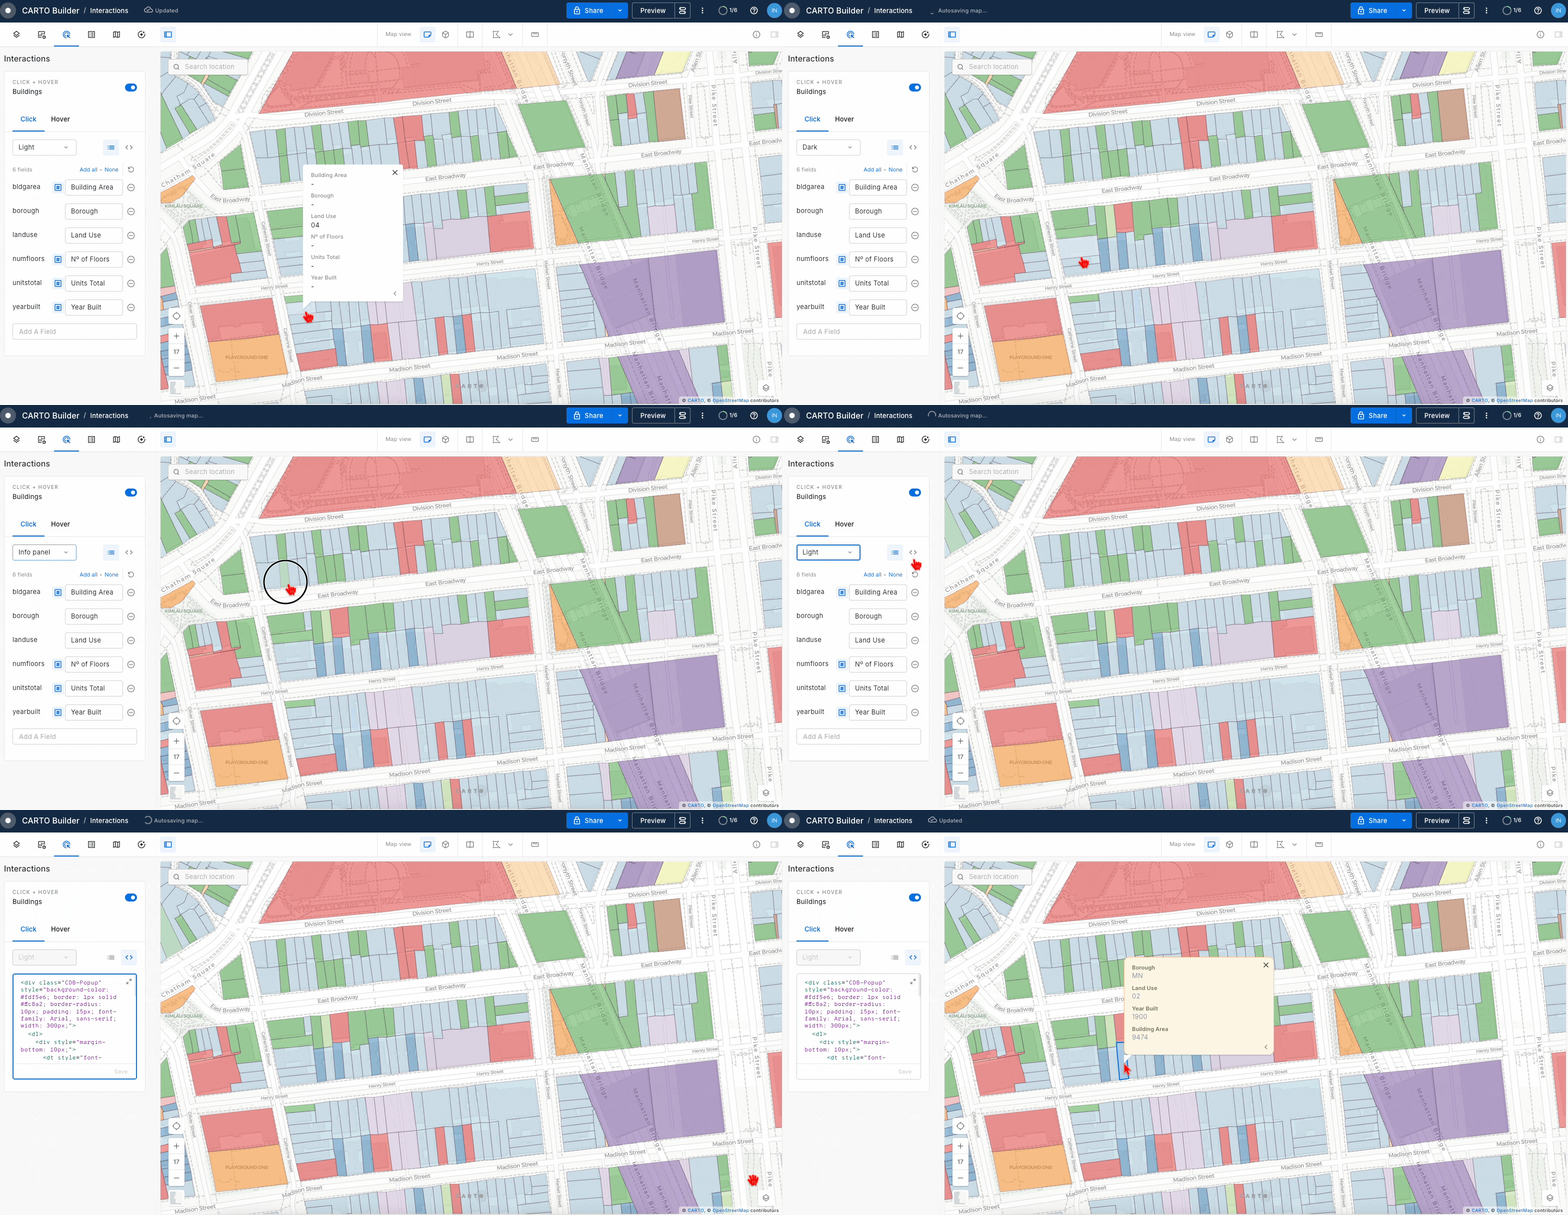
## **Drag and drop reordering of properties in Table and Interactions**

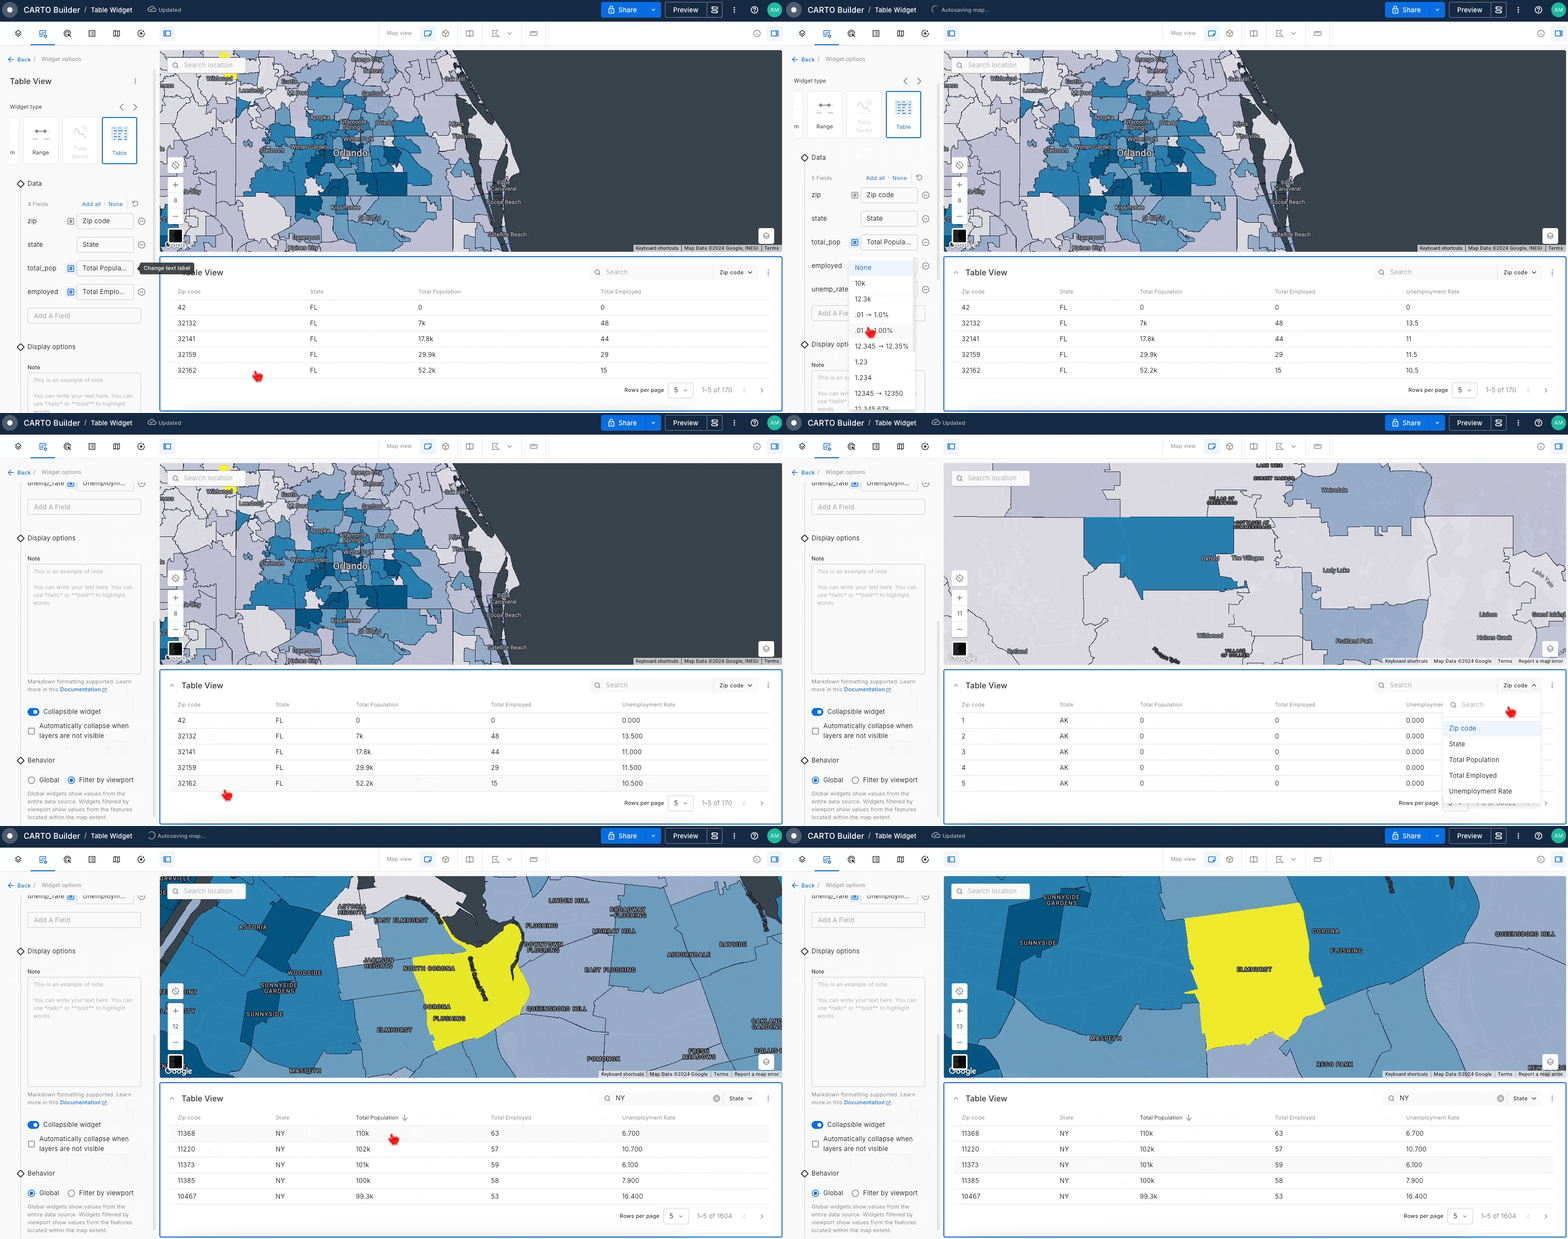
We've introduced the ability to reorder the properties shown in the Table widget and Tooltip via simple drag and drop functionality.

Until now, users could configure which properties to show, but changing the order they are presented often meant clearing the setup and starting over again. With this enhancement, it’s easier than ever to customize how data is displayed, improving readability and enabling tailored views for different audiences.

<figure><img src="/files/S8CG6KrrNTnQeccAQCPZ" alt=""><figcaption></figcaption></figure>
{% endupdate %}

{% update date="2025-08-12" tags="new,workflows" %}

## **Control Components in Workflows: Conditional Split & Success/Error Split**

We’ve added two new [control components](/carto-user-manual/workflows/components#control) to CARTO Workflows that make it easier to control how your workflows execute and respond to different scenarios.

* [**Conditional Split**](/carto-user-manual/workflows/components/control#conditional-split) – Direct your workflow into **If** and **Else** branches based on a condition you define. Build the condition with a simple UI (column + aggregation + operator + value) or use a custom SQL expression for more complex logic.\
  Some usage examples:
  * “If the **count of underserved households** in a service area is greater than 500, trigger a fiber expansion workflow; otherwise plan for wireless coverage.”
  * “If the **average property value** in a high-risk flood zone is above $1M, apply the high-risk pricing model; otherwise, use the standard pricing model.”
* [**Success/Error Split**](/carto-user-manual/workflows/components/control#success-error-split) – Branch execution depending on whether the previous step ran successfully or failed.\
  Some usage examples:
  * “If network quality metrics fail to load, send an alert; otherwise continue with churn prediction.”
  * “If address geocoding fails, switch to a backup geocoder; otherwise proceed with claims analysis.”

These components let you build workflows that adapt to your data, add robust error-handling, and reduce the need for manual monitoring — helping teams act faster on reliable insights.

{% embed url="<https://vimeo.com/1109408145?autoplay=1&share=copy>" %}
{% endupdate %}

{% update date="2025-08-05" tags="improvement,workspace" %}

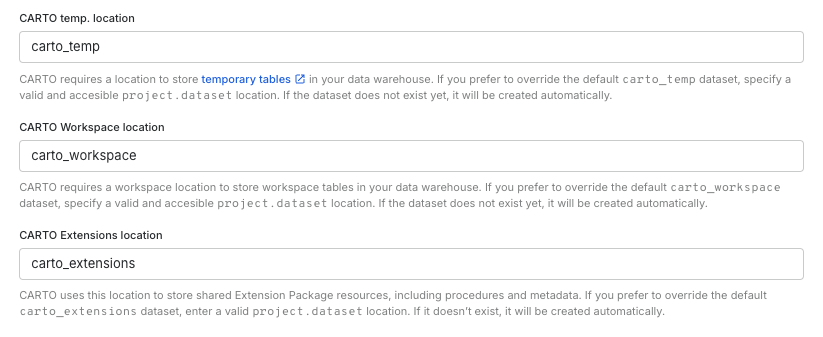
## **Separation of working locations for improved data governance**

We have introduced a clearer separation of datasets/schemas that CARTO creates and manages in connected data warehouses. This change improves data governance and prevents persistent objects from being stored alongside temporary workflow tables.

**New locations per connection:**

* **CARTO temp location** – stores only temporary tables created during workflow execution.
* **CARTO Workspace location** – stores persistent objects related to workflows, such as API stored procedures and imported files.
* **CARTO Extensions location** – stores Extension Package resources, including shared stored procedures and metadata. Only for BigQuery and Snowflake.

**Additional notes:**

* For connections shared requiring Viewer Credentials, `carto_temp_<user>` and `carto_workspace_<user>` are created per user.
* The Extensions location is always shared across all users in a connection, ensuring consistent access to installed packages.
* Default names can be overridden in the connection’s advanced options.
* Locations are automatically created as needed (`CREATE IF NOT EXISTS`).

This update applies to all supported warehouses. Find specific documentation on the *Advanced settings* section for each warehouse in the [Connections](/carto-user-manual/connections) section of the documentation.

<figure><img src="/files/lUZrQoLoT4KvzkGopUos" alt=""><figcaption></figcaption></figure>
{% endupdate %}

{% update date="2025-07-29" tags="new,builder" %}

## Support for adding sources without associated layer in Builder

Editor users can now add data sources to a Builder map **without displaying associated layers**. These sources can be used to power widgets, SQL parameters, and even be used by AI Agents to generate insights.

This is especially useful when a dataset is needed for interactivity or calculations, but not for visualization. It helps keep your maps cleaner, more focused, and easier to maintain.

<figure><img src="/files/JHoQriMXzb5ZtTkjbf7V" alt=""><figcaption></figcaption></figure>
{% endupdate %}

{% update date="2025-07-17" tags="new,workspace" %}

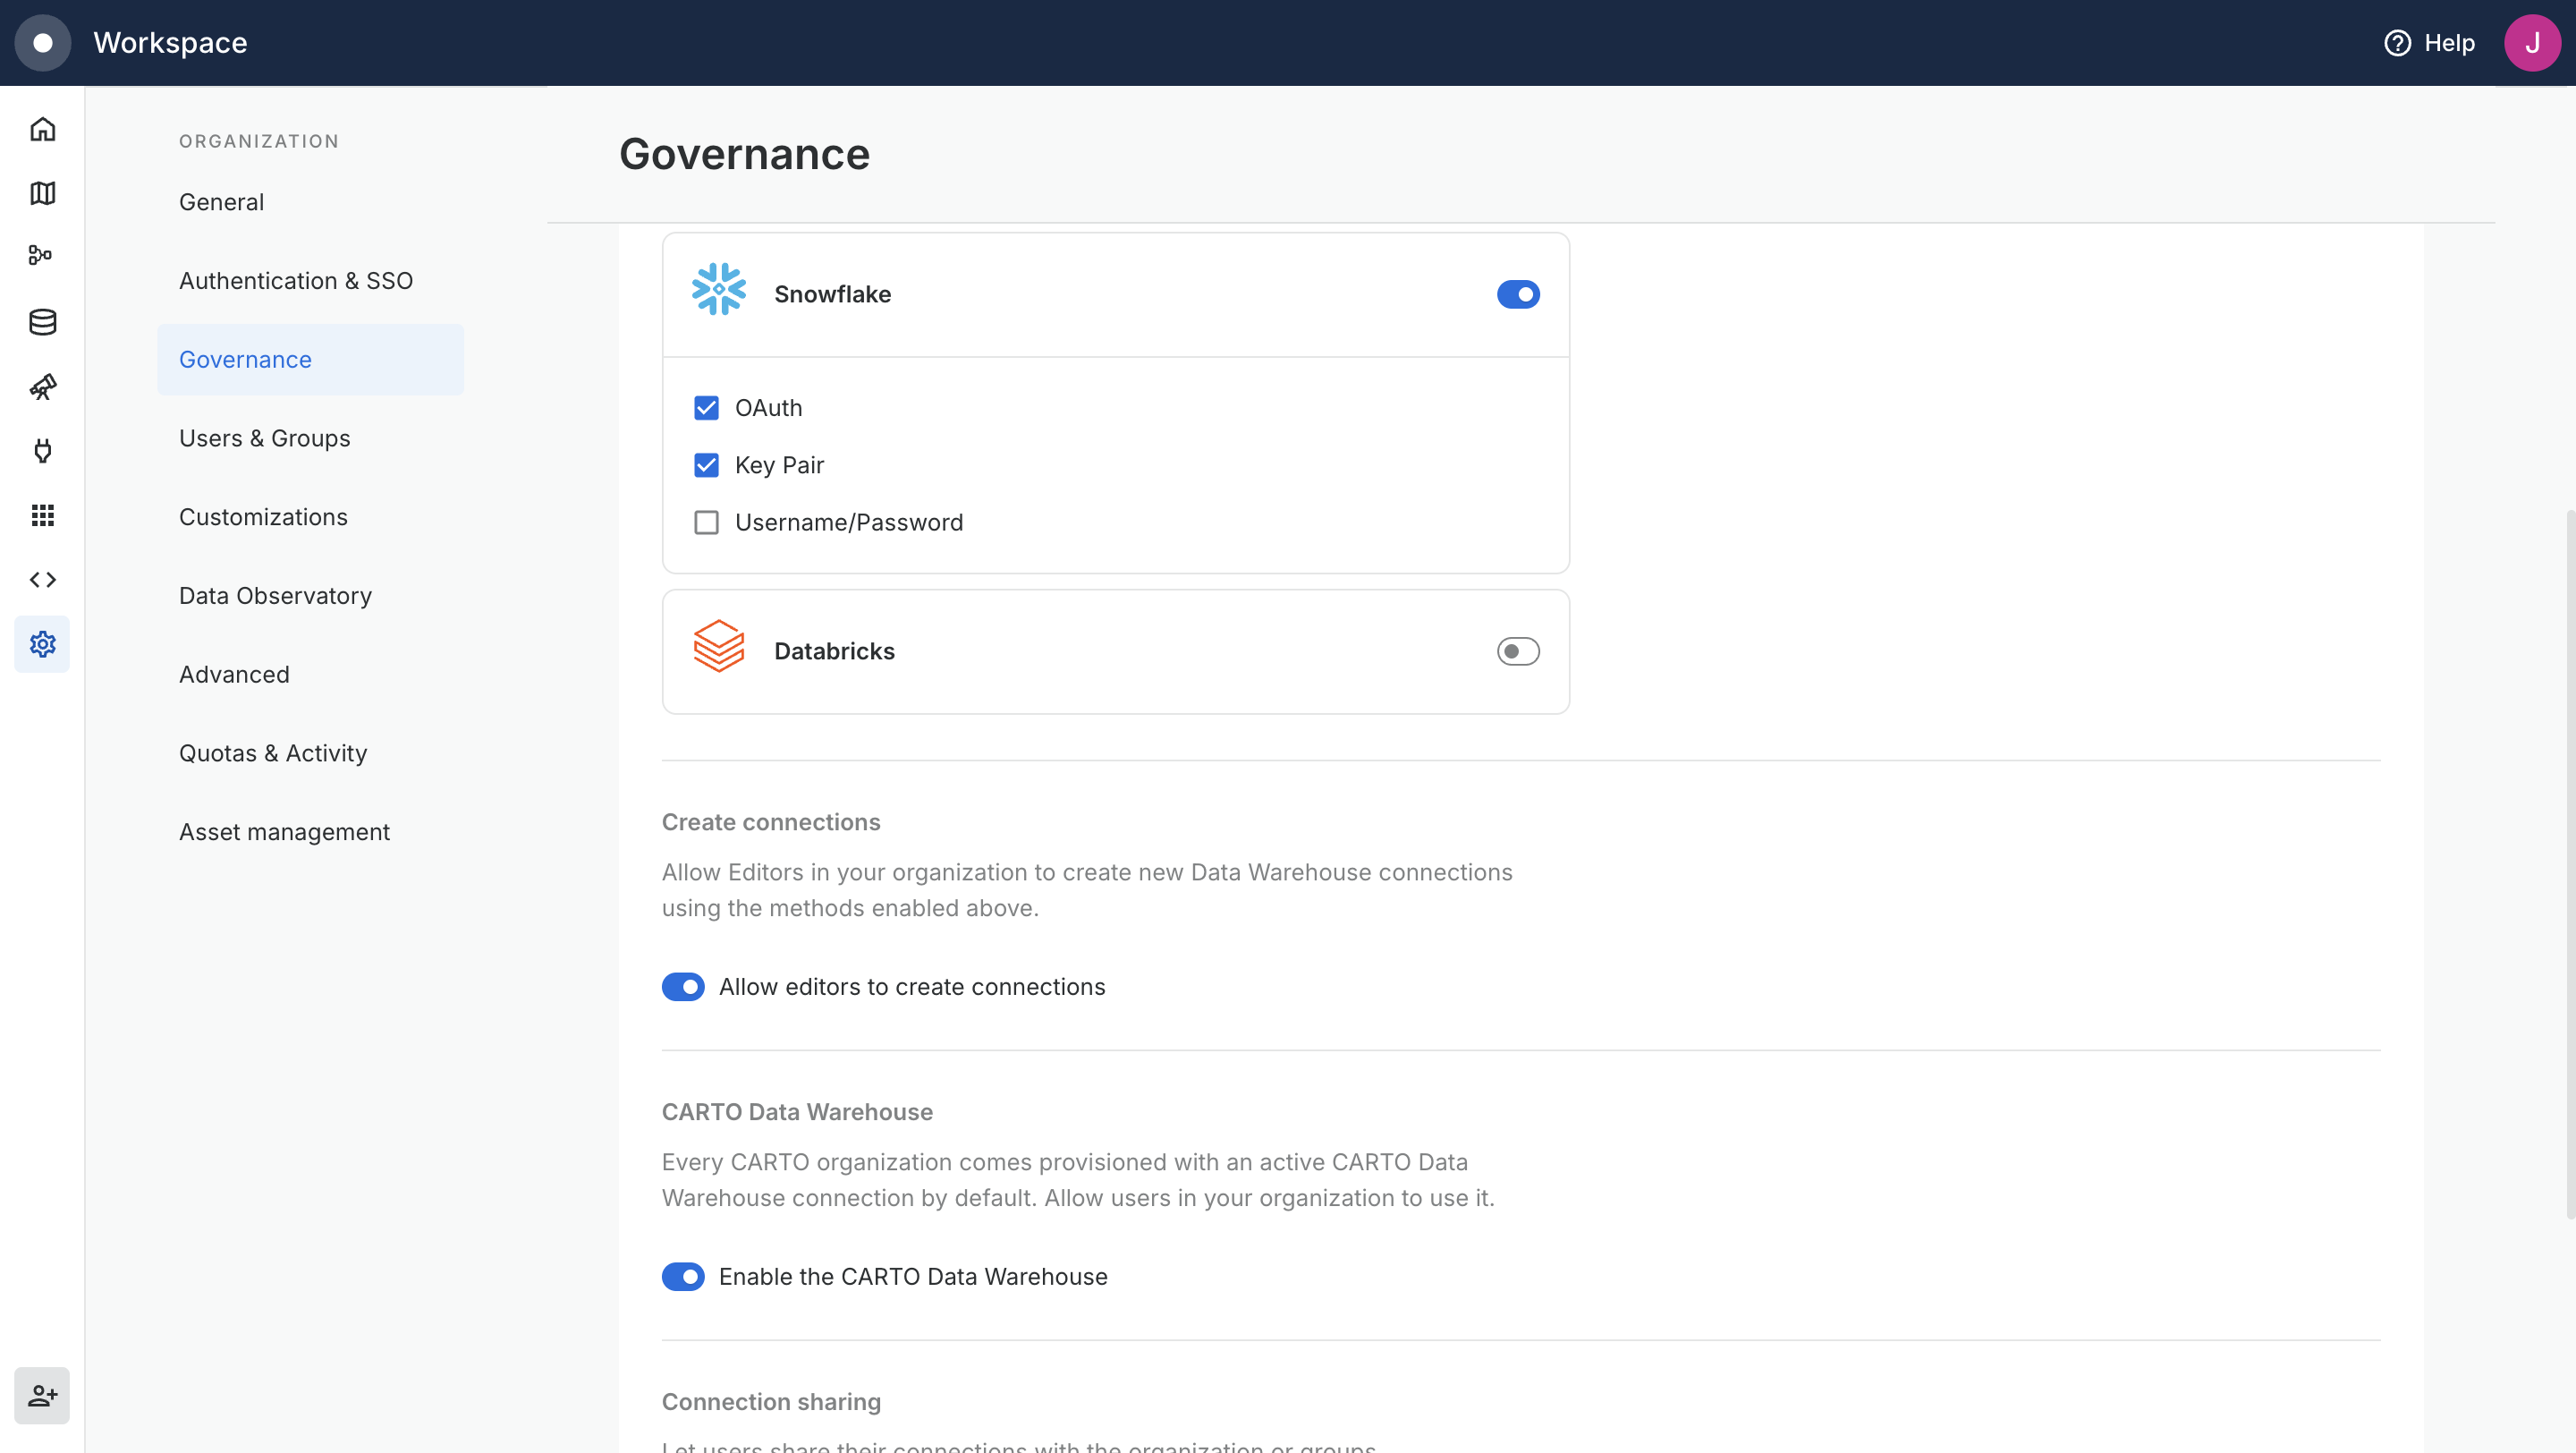
## Organization Governance Settings for Admins

Admins can now set up custom governance policies through the new **Governance** section in Settings. These controls give you the tools to manage data access, sharing, and feature usage across your organization with precision.

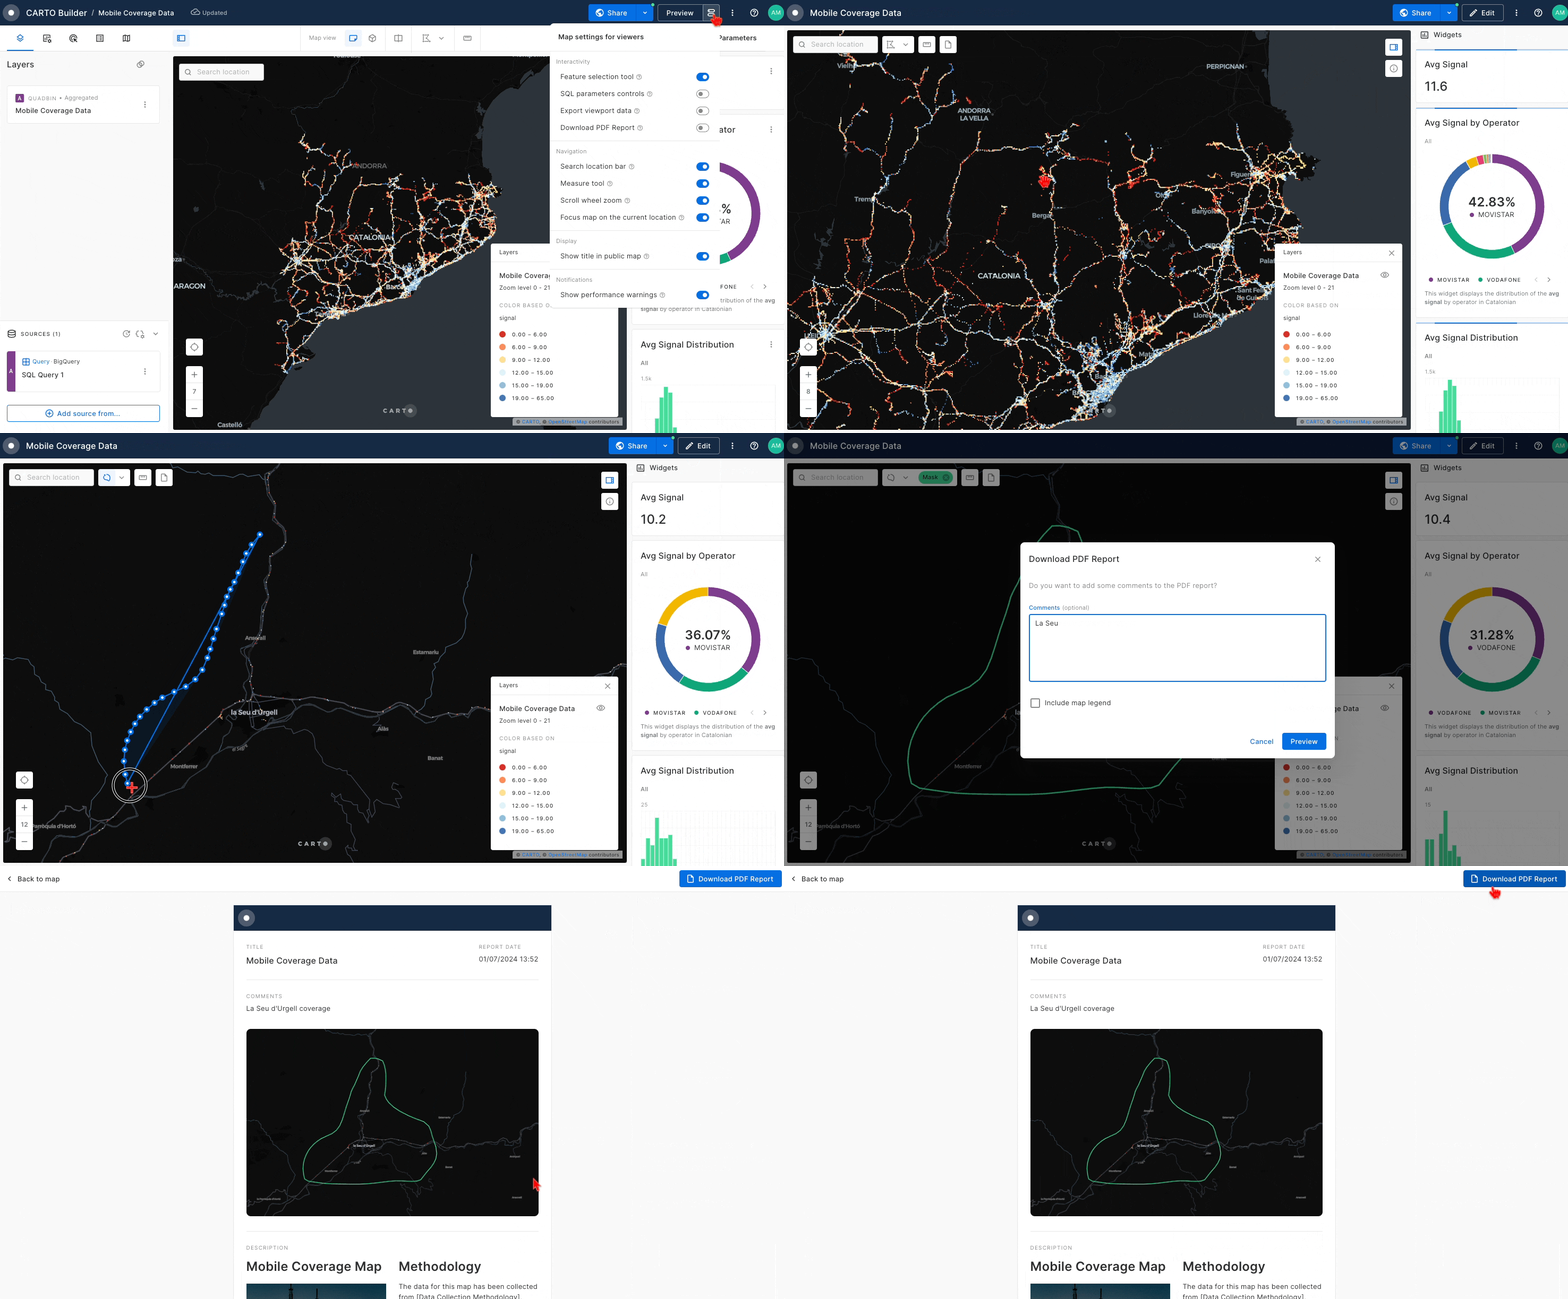
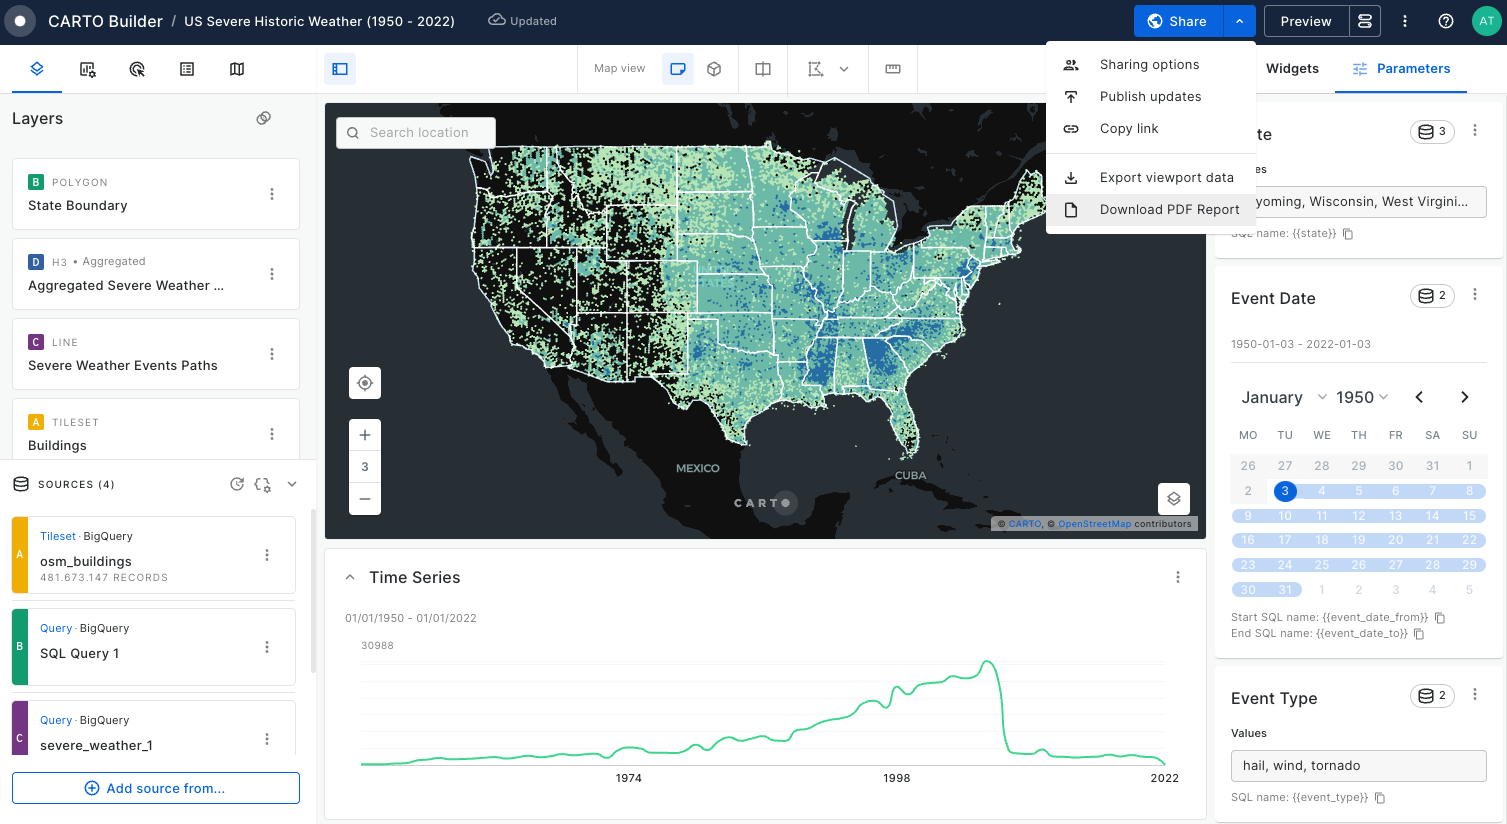
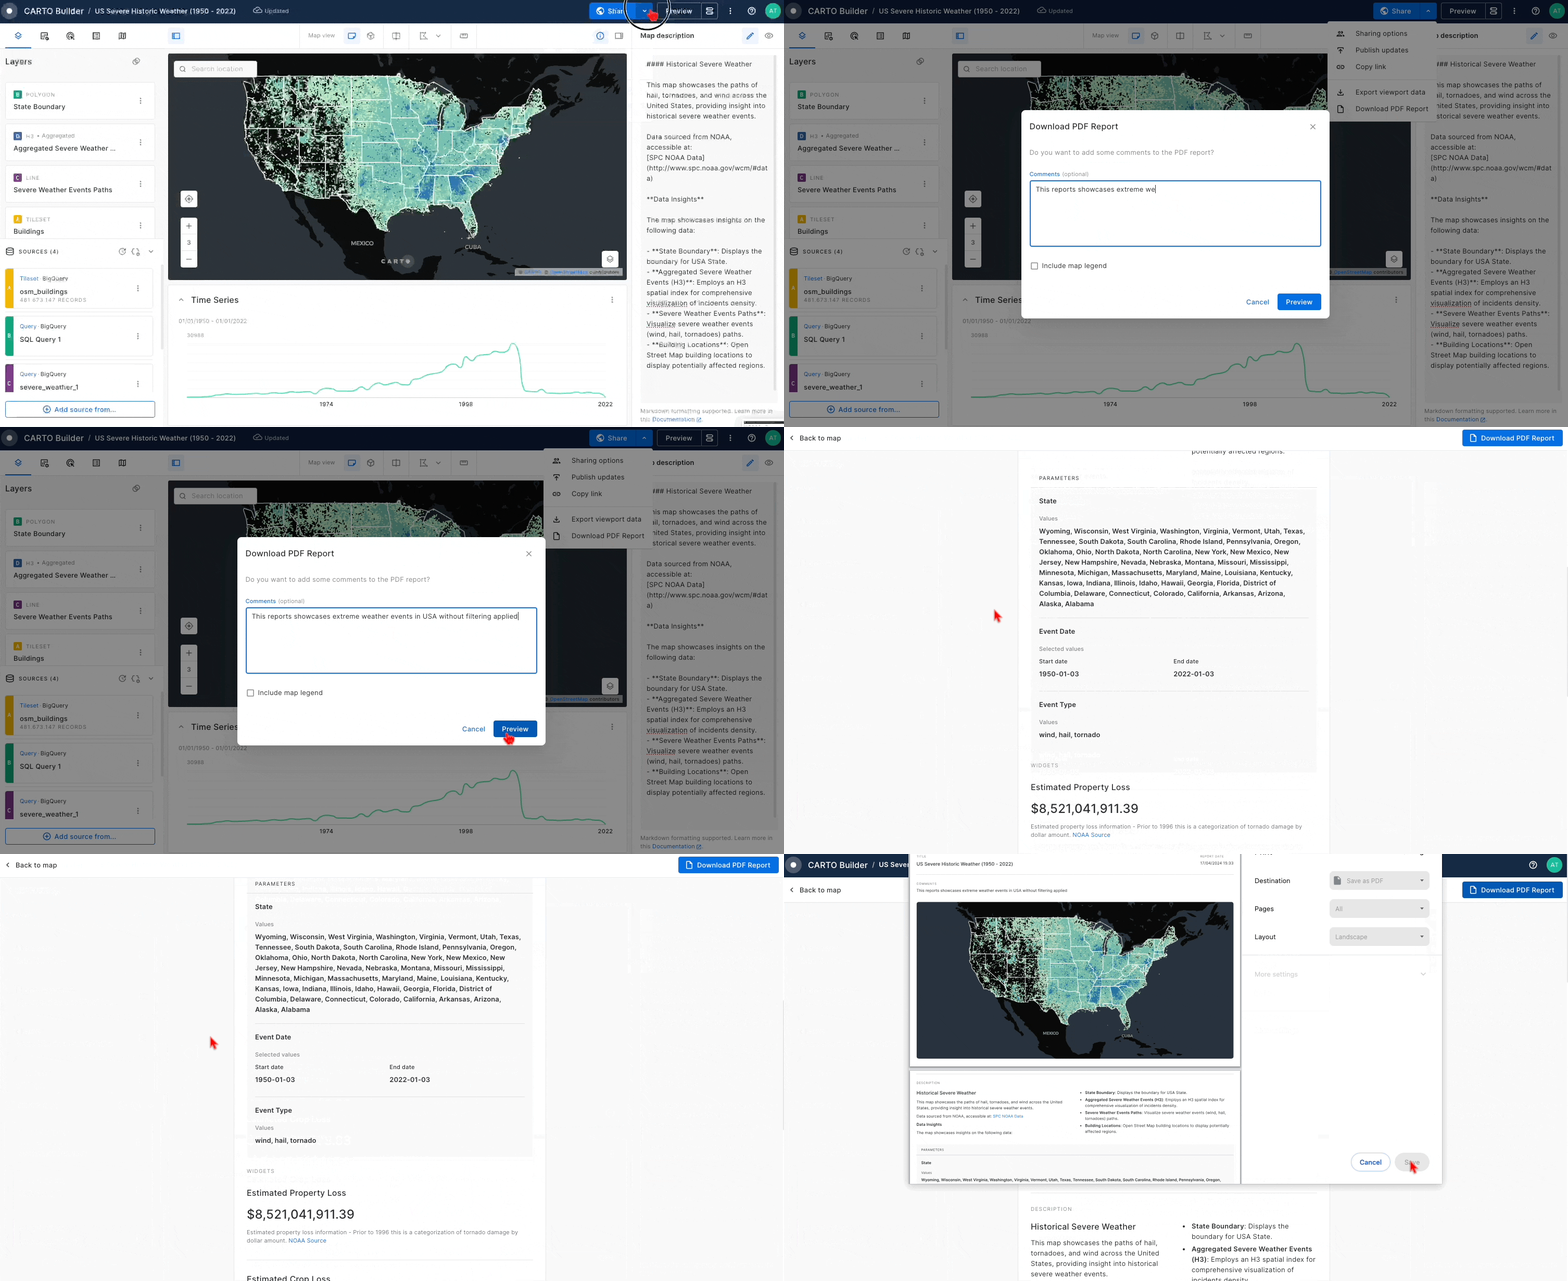
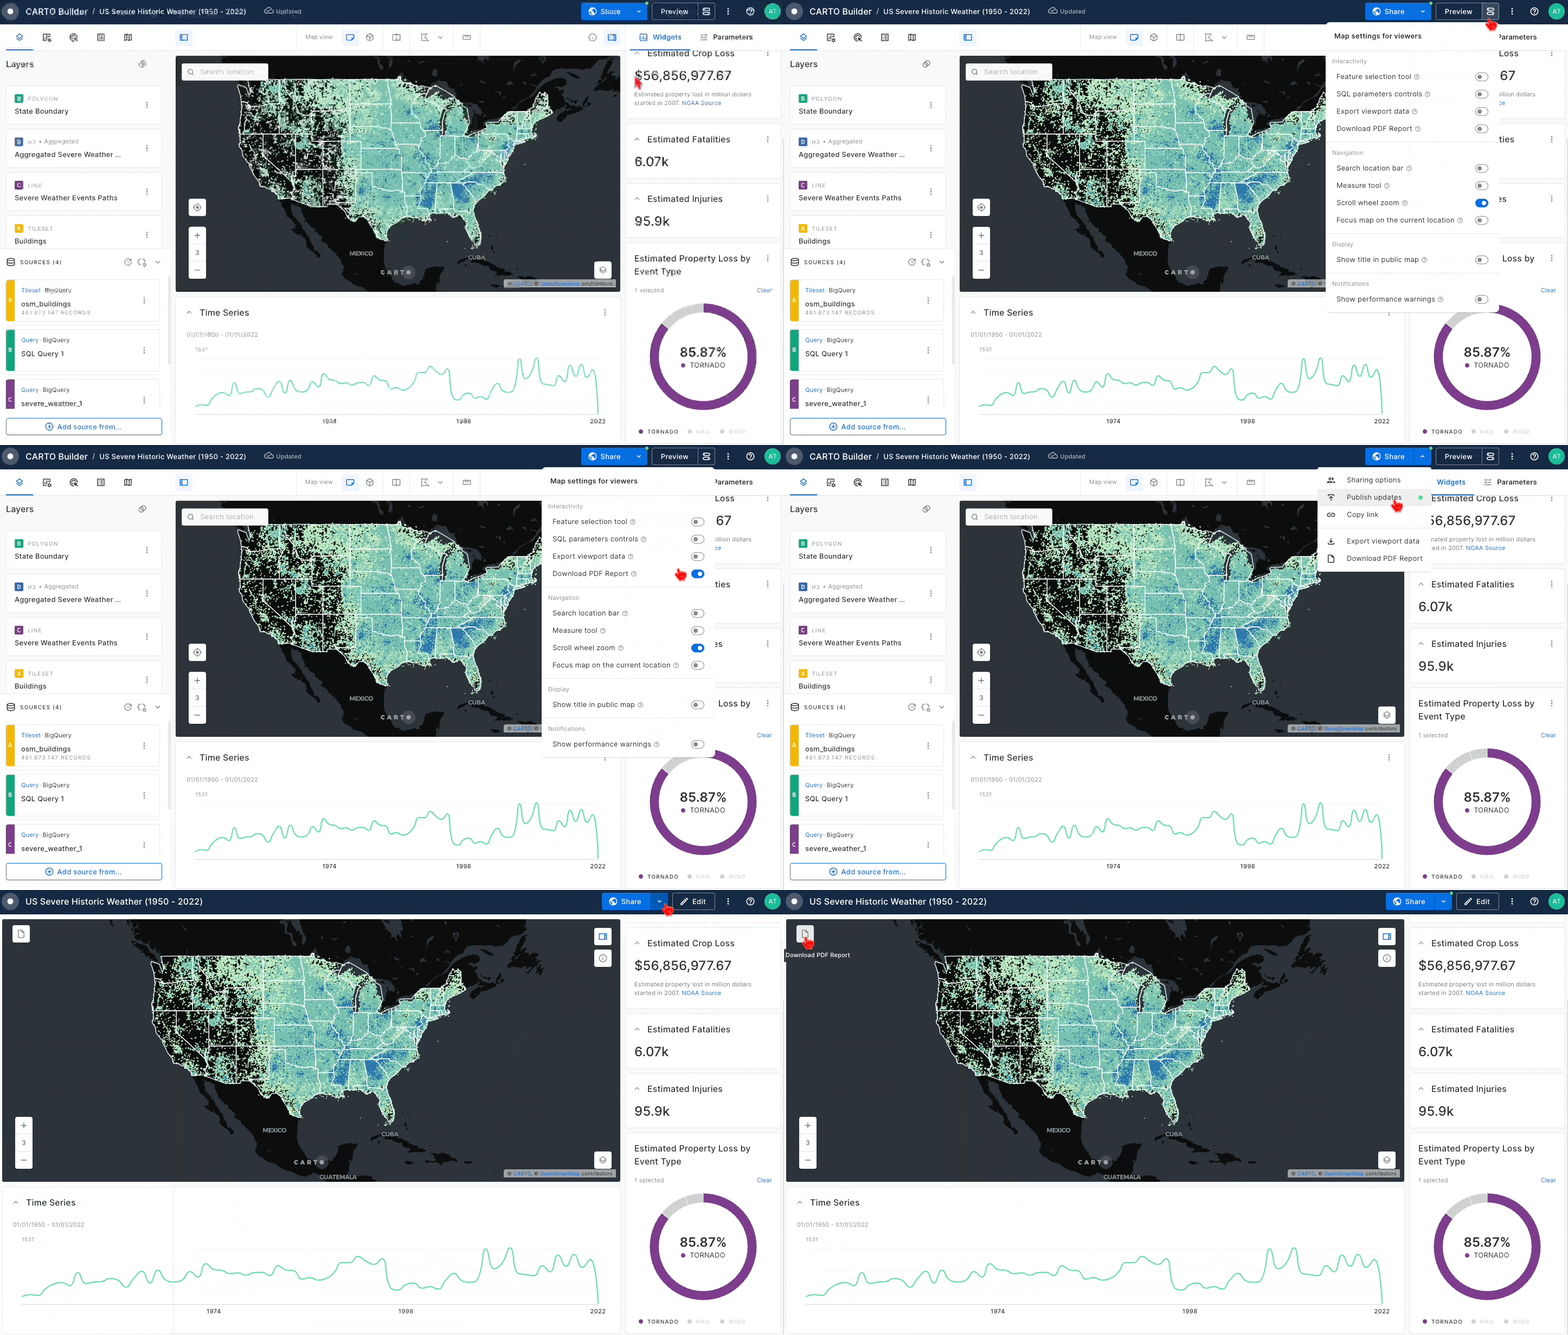
Control who can create new Data Warehouse connections with granular settings for providers and authentication methods. Manage connection sharing, disable the CARTO Data Warehouse, and fine-tune Builder features like Download PDF report, export viewport data, and more!

To see all the new settings, check our section on [Organization Governance](/carto-user-manual/settings/organization-governance).

<figure><img src="/files/Jg3tcZjENnmoqEQdnFI7" alt=""><figcaption></figcaption></figure>
{% endupdate %}

{% update date="2025-07-15" tags="improvement,builder" %}

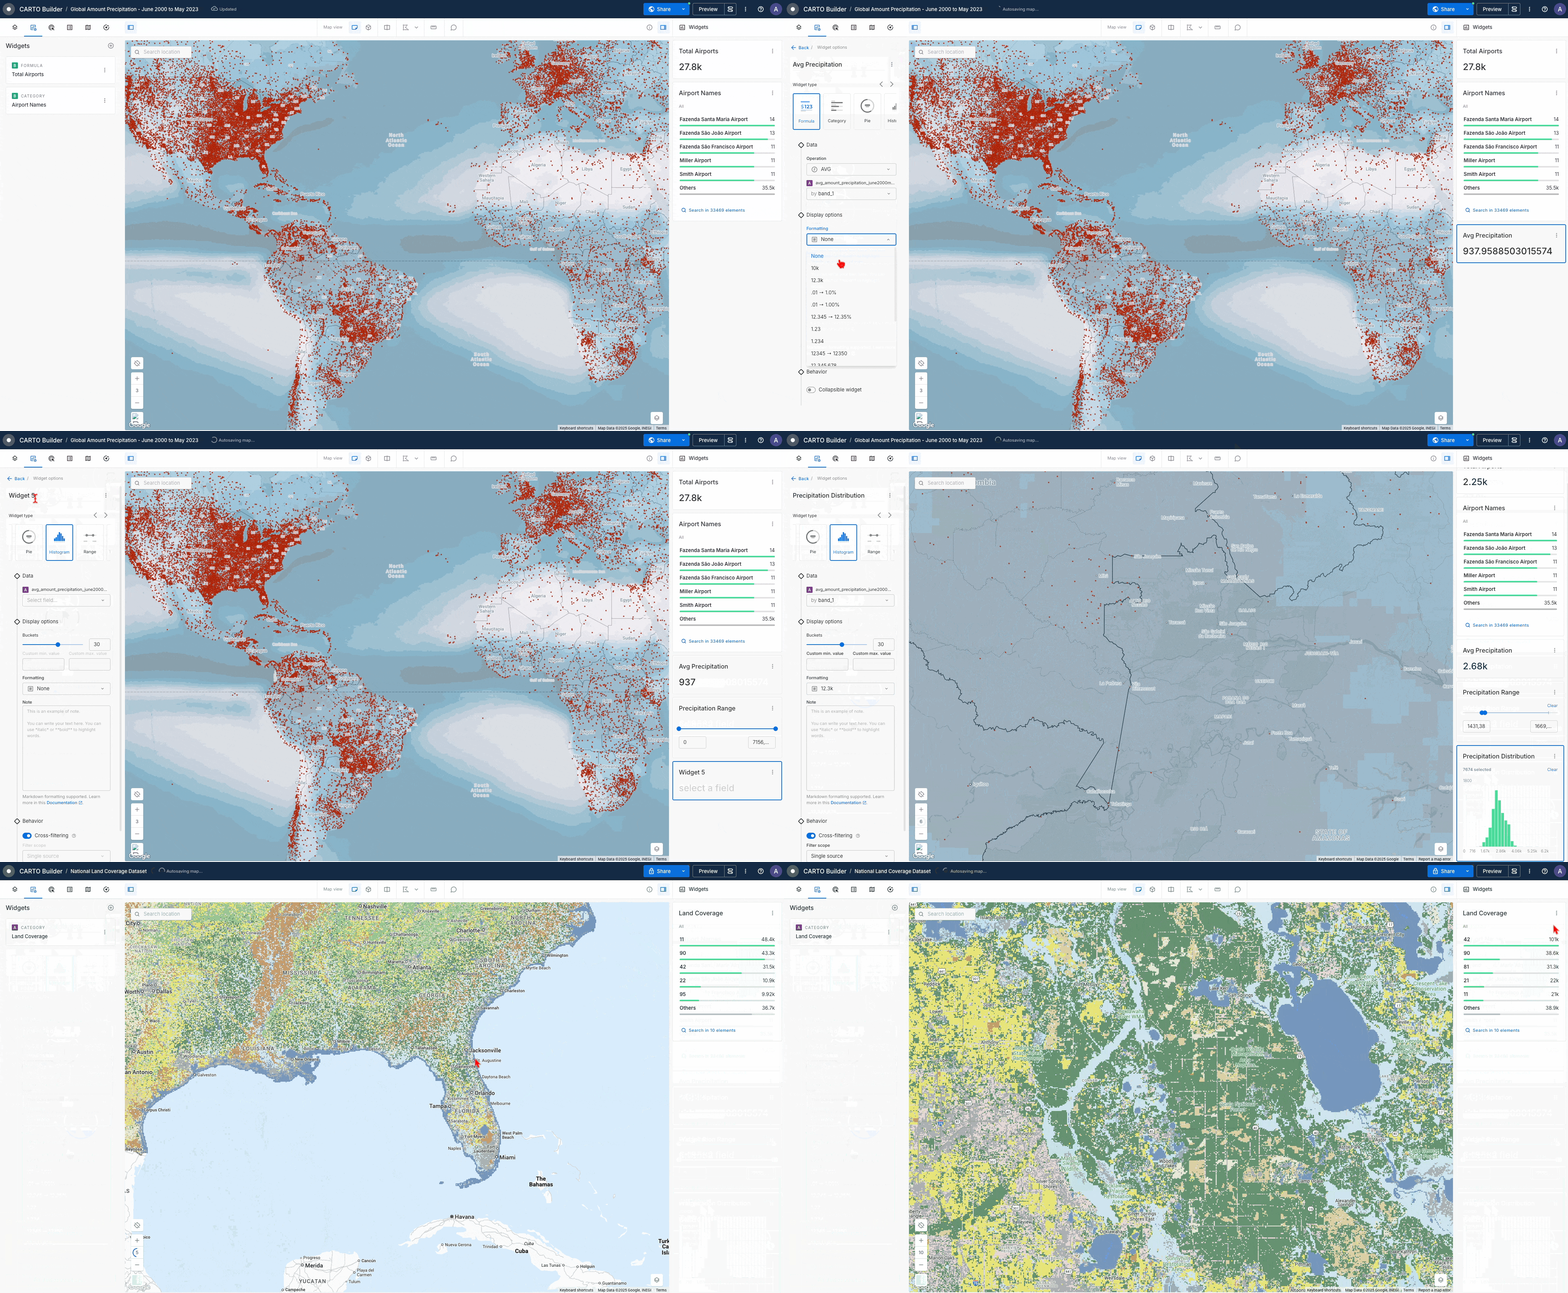
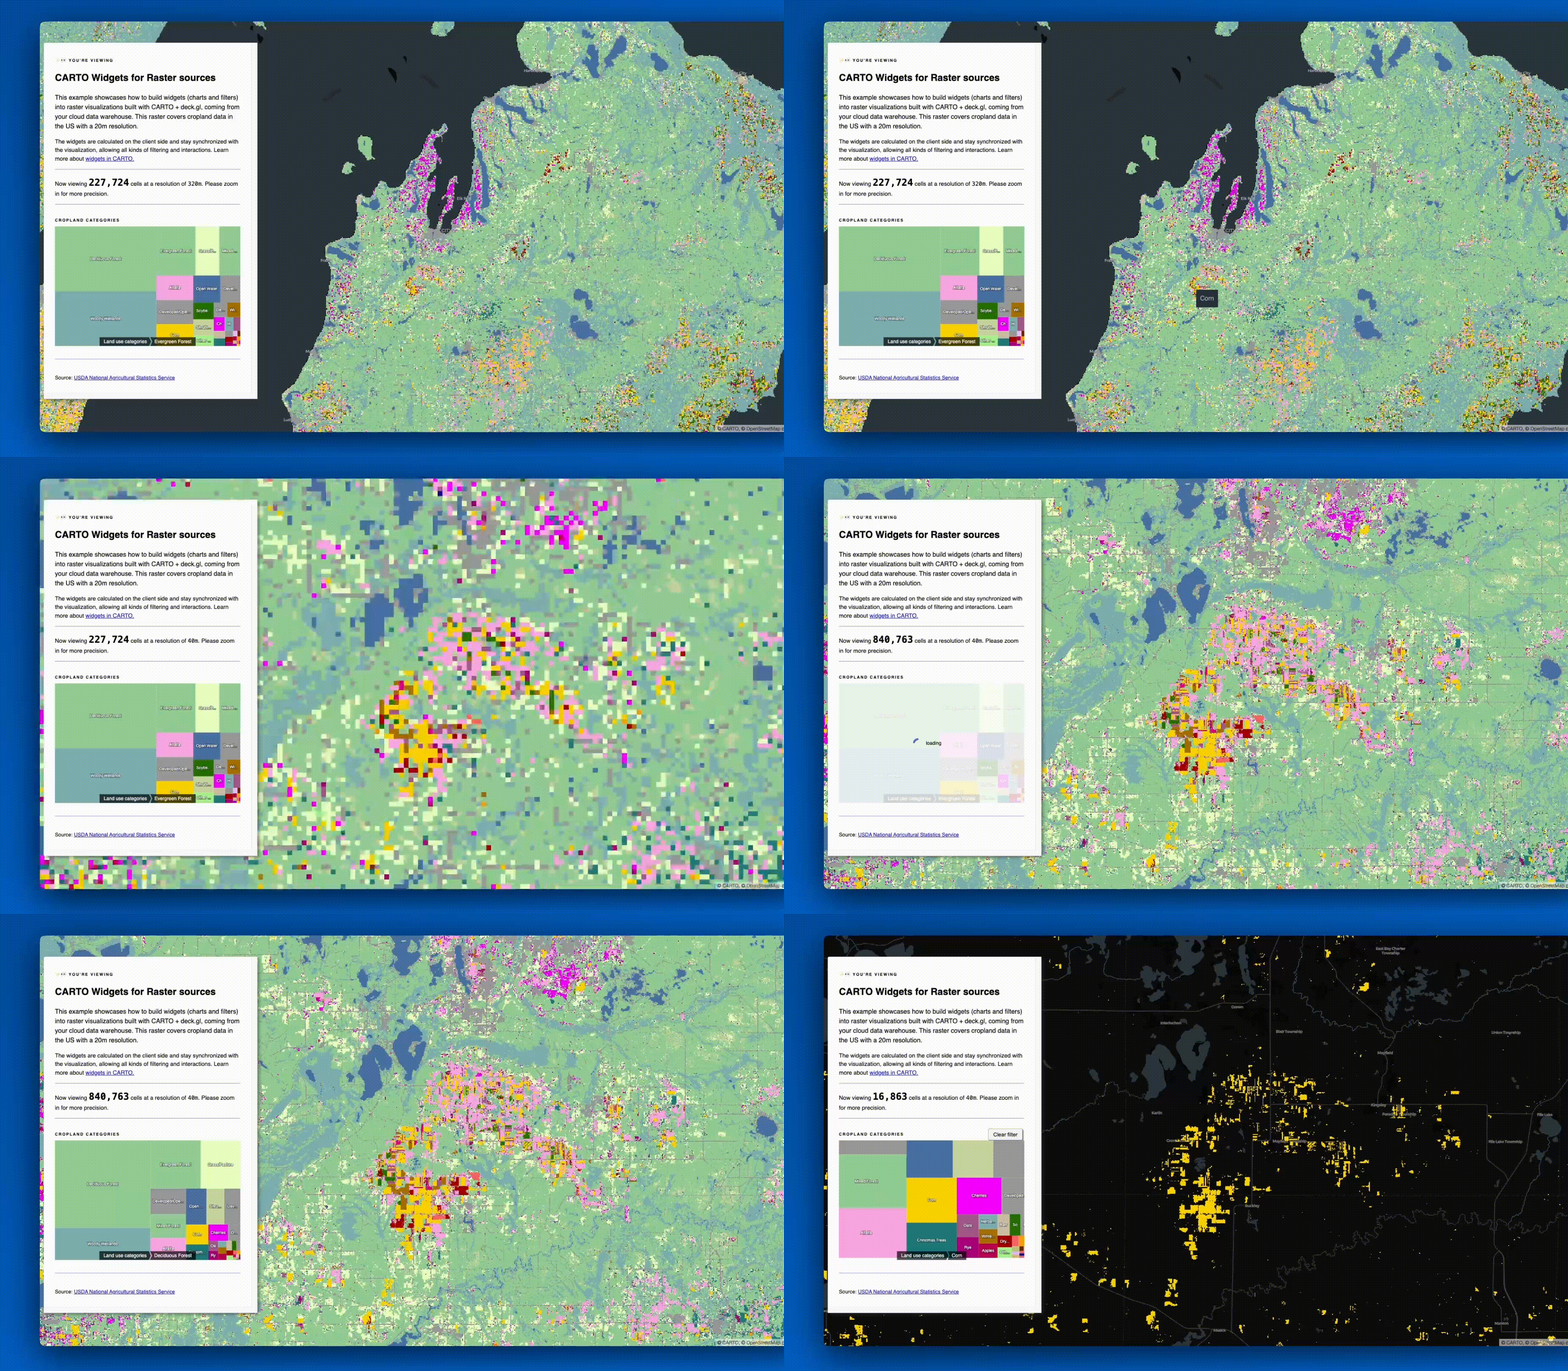
## Support for Widgets linked to Raster sources in Builder

You can now use Widgets with raster sources in Builder — just like you already can with vector sources. This improvement allows for richer exploration and analysis of raster sources stored in your data warehouse directly from the map.

Use the Formula Widget to calculate metrics like tree coverage in your current view. Leverage Category and Pie Widgets to list distinct values in your raster layer, or use the Histogram Widget to explore data distributions such as precipitation.

These widgets can also be used for filtering, letting you interactively refine what’s shown on the map and extract insights more effectively.

[Learn more in our documentation](/carto-user-manual/maps/widgets).

<figure><img src="/files/XNpNZBROpGIAkTmCFmSu" alt=""><figcaption></figcaption></figure>
{% endupdate %}

{% update date="2025-07-08" tags="new,workspace" %}

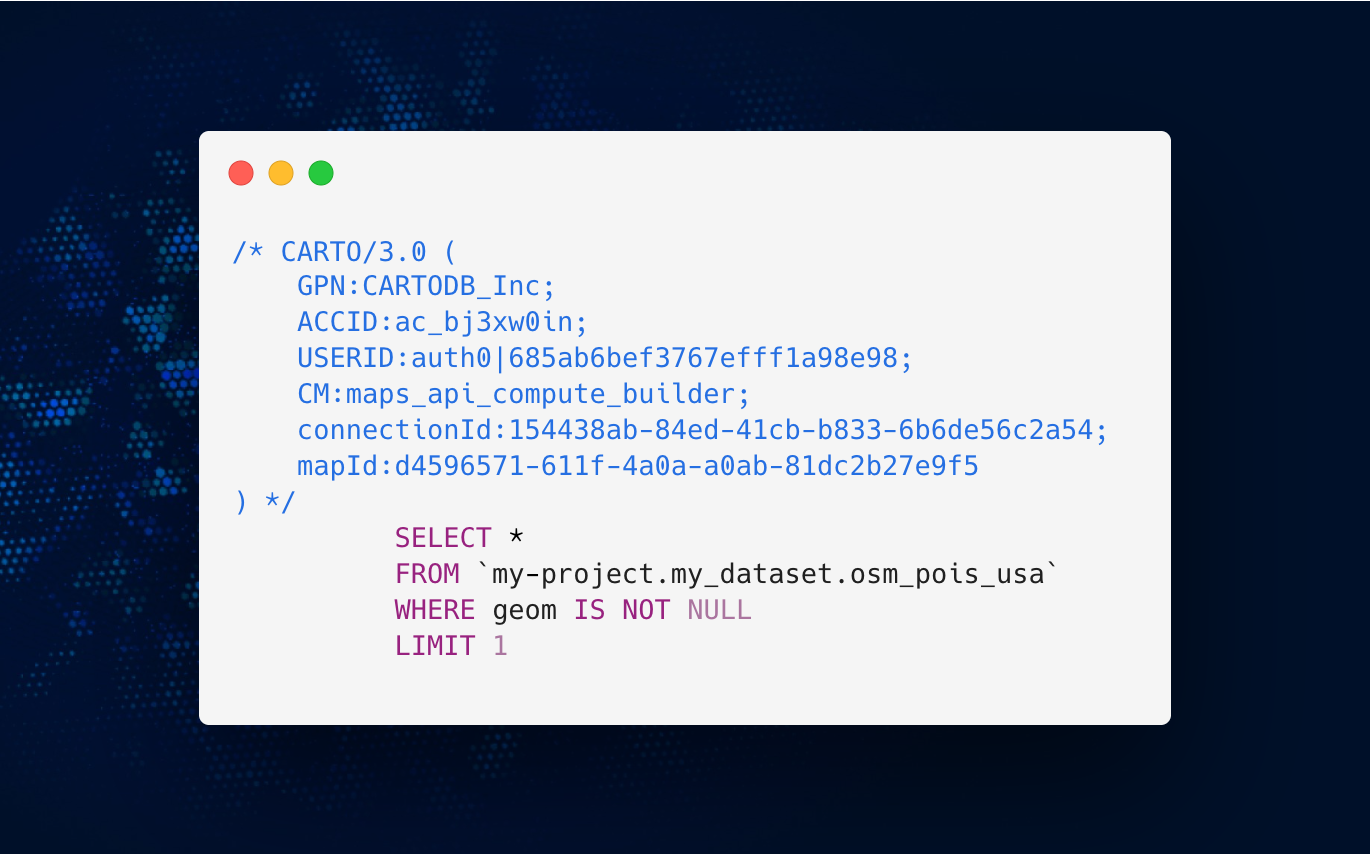
## Audit all queries with the CARTO SQL audit trails

When a map or workflow is opened, CARTO launches a set of SQL queries to your data warehouse to visualize your data and run your analysis. And from now on, each of those SQL queries will contain a **rich audit trail** in the form of SQL comments at the beginning or the end of the query.

This audit information allows data warehouse administrators to monitor CARTO and answer questions such as: *How many queries did CARTO run in a period of time? Which workflows or maps have processed more data? What are some common performance or cost patterns?*

To start using this information in your audits, check our [Auditing SQL queries documentation](/carto-user-manual/connections/auditing-sql-queries-from-carto).

<figure><img src="/files/ZPdrptGwZZ3P4rQayusk" alt=""><figcaption></figcaption></figure>
{% endupdate %}

{% update date="2025-06-30" tags="improvement,workflows" %}

## Collaborative edition in Workflows

Workflows now supports [**collaborative editing**](/carto-user-manual/workflows/sharing-workflows#editor-collaboration) for teams. Editors can share workflows with their entire organization, SSO groups, or specific users to enable collaborative development.

This feature eliminates the need to duplicate workflows for minor changes, ensuring teams work from a single, consistent source of truth. Asynchronous editing with a request/approval model reduces conflicts while supporting smooth, coordinated teamwork.

Editor collaboration makes it easier for organizations to use Workflows at scale and promotes more frequent, effective use across teams.

{% embed url="<https://vimeo.com/1097574791?autoplay=1&share=copy>" %}
{% endupdate %}

{% update date="2025-06-25" tags="new,builder" %}

## Cross-filtering multiple data sources from map widgets

You can now use a **single widget to filter multiple sources** in your Builder map as long as they share the same field.

Previously, widgets could only filter a single source. Now, widgets like Category or Time Series will update multiple sources and their related elements (like other widgets or layers) when the filtering property matches.

This is especially useful when working with complementary datasets. For example, filtering both sales and demographic data by region to uncover richer insights.

Learn more in our [Widget Behavior](/carto-user-manual/maps/widgets#widget-behavior) section of the documentation.

<figure><img src="/files/qD8fir2ImxFcVyTZOBt0" alt=""><figcaption></figcaption></figure>
{% endupdate %}

{% update date="2025-06-19" tags="improvement,builder,carto-for-developers" %}

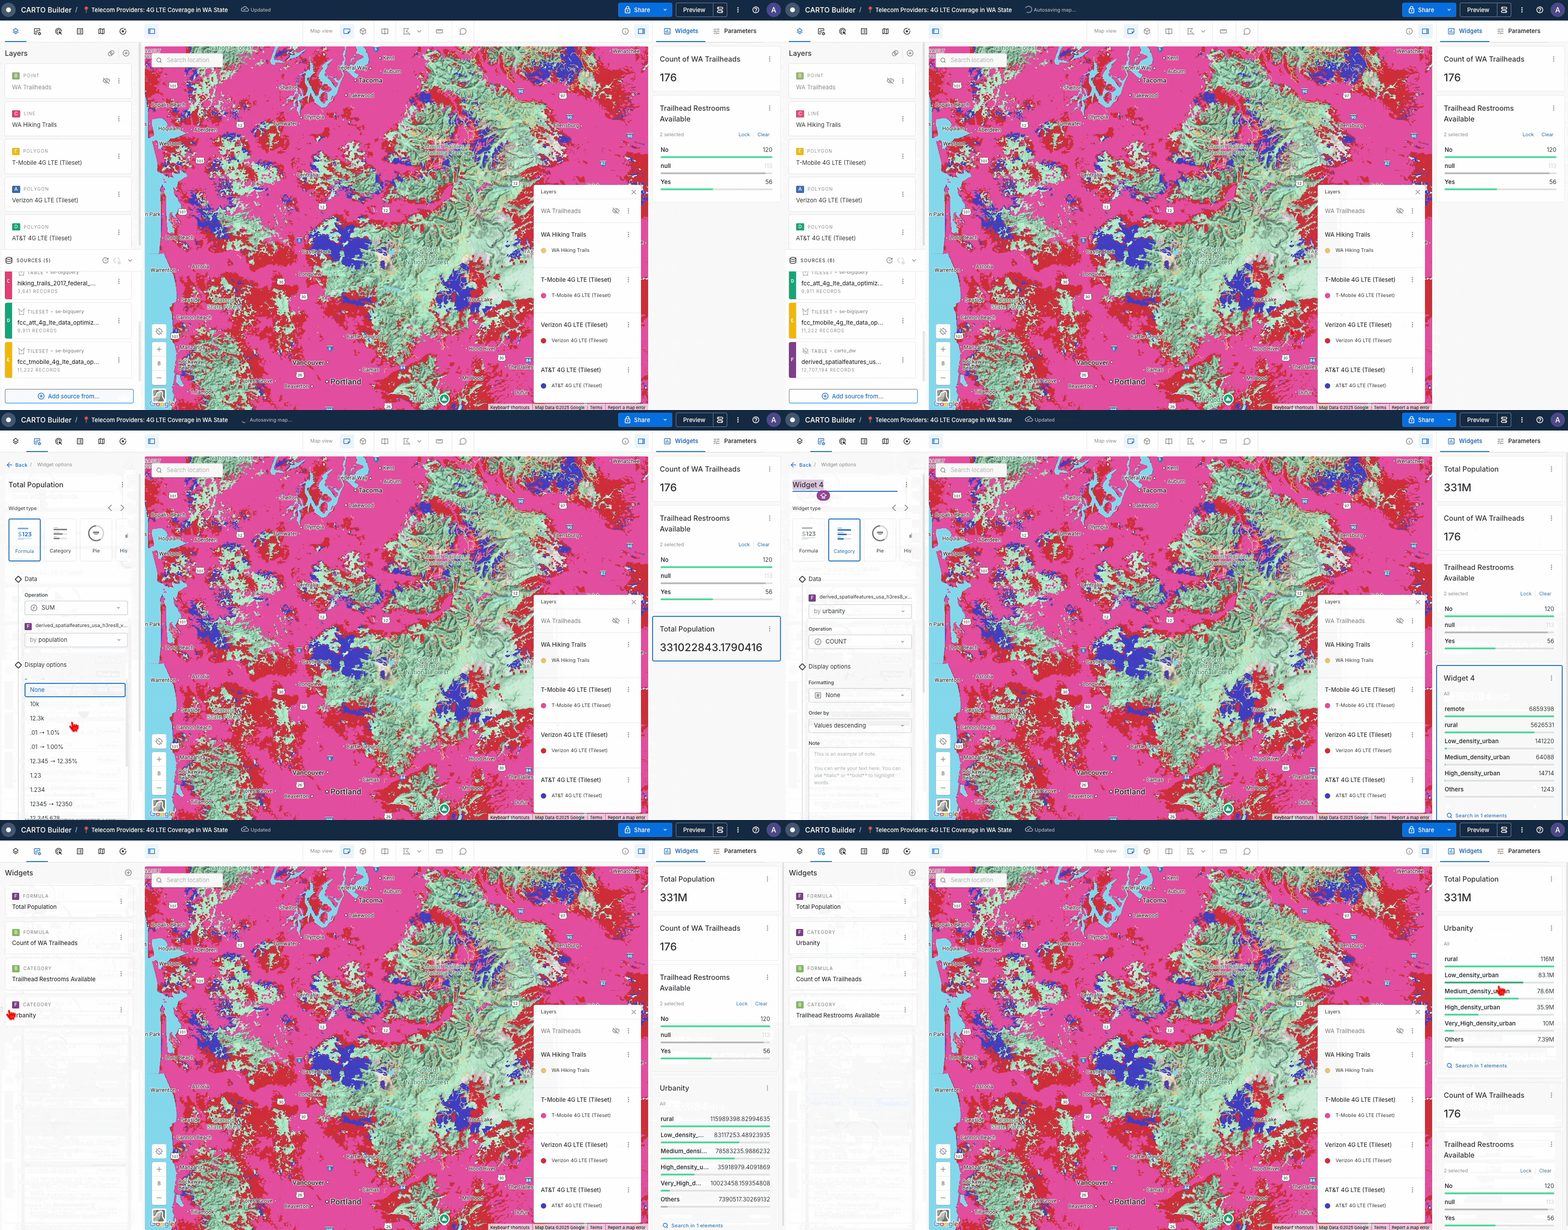
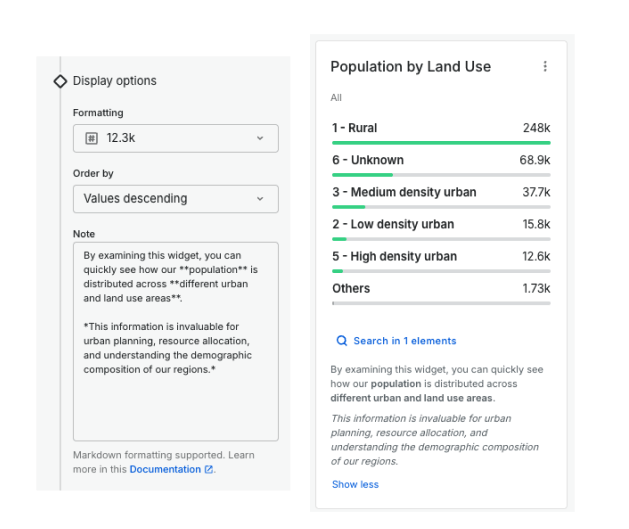
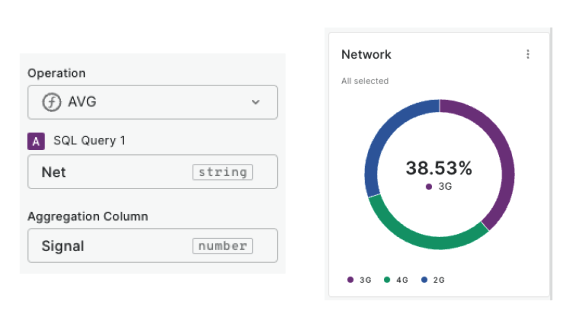
## Custom aggregation support on Category, Pie and Time Series Widget

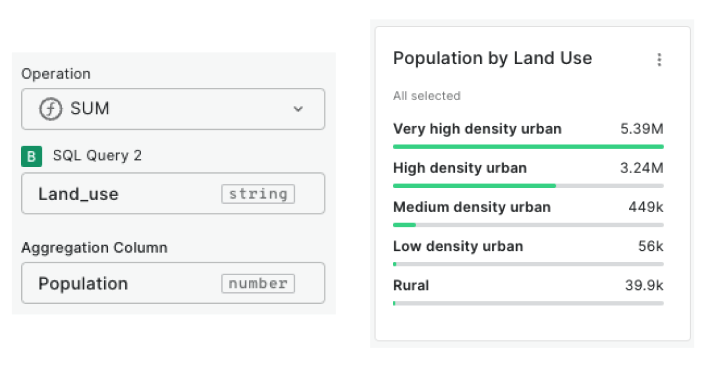
You can now define **custom aggregation** operations directly in [**Category**](/carto-user-manual/maps/widgets/category-widget), [**Pie**](/carto-user-manual/maps/widgets/pie-widget), and [**Time Series**](/carto-user-manual/maps/widgets/time-series-widget) widgets, previously only available in Formula widgets.

This enhancement enables more advanced use cases by allowing tailored **SQL expressions** within the widget configuration, giving users greater control over how insights are calculated and displayed.

Custom aggregations are supported in both **CARTO Builder** and the **CARTO Developer framework** for programmatically creating widgets.\
\
Learn more in the [Widget*s*](/carto-user-manual/maps/widgets) section of Builder or the CARTO for Developers [technical reference](/carto-for-developers/reference/carto-widgets-reference).

<figure><img src="/files/Um4iWEta151l29u0uJPb" alt=""><figcaption></figcaption></figure>
{% endupdate %}
{% endupdates %}


# Q3 2026

New features and improvements introduced from July to September 2026

{% updates %}
{% update date="2026-07-06" tags="new,builder" %}

## More export formats and controls in Builder

Data exports in Builder are now more flexible and more governed. Beyond CSV, you can export to **GeoJSON**, **Shapefile**, **GeoParquet** and **KML**, so you can take a filtered dataset straight into the tools you already use without any manual conversion.

As an Editor, you stay in control of what leaves your map: choose which sources are exportable, whitelist the columns that can be exported so sensitive attributes stay in your warehouse, and set the formats available per source. Every export honors the current map state, so filters, SQL parameters and the viewport are all respected.

Learn more in our [Exporting data documentation](/carto-user-manual/maps/exporting-data).

<figure><img src="/files/CjSzEVkU2kJMHg9yBLIP" alt=""><figcaption></figcaption></figure>
{% endupdate %}

{% update date="2026-07-03" tags="new,workspace" %}

## Organize your maps and workflows with projects and folders

You can now organize your maps and workflows into **projects and folders** instead of one flat list. Group related work together, nest folders as deep as you need, and move or create maps and workflows right where they belong.

Projects keep your Workspace tidy and make collaboration easier: share a project or folder once and everything inside inherits those access permissions. You set permissions in one place instead of doing it asset by asset. When an asset belongs in more than one project, add a shortcut instead of moving it.

Learn more in the [Projects](/carto-user-manual/projects) documentation.

<figure><img src="/files/HIOyvpbvkPc1BrBgl67z" alt=""><figcaption></figcaption></figure>
{% endupdate %}

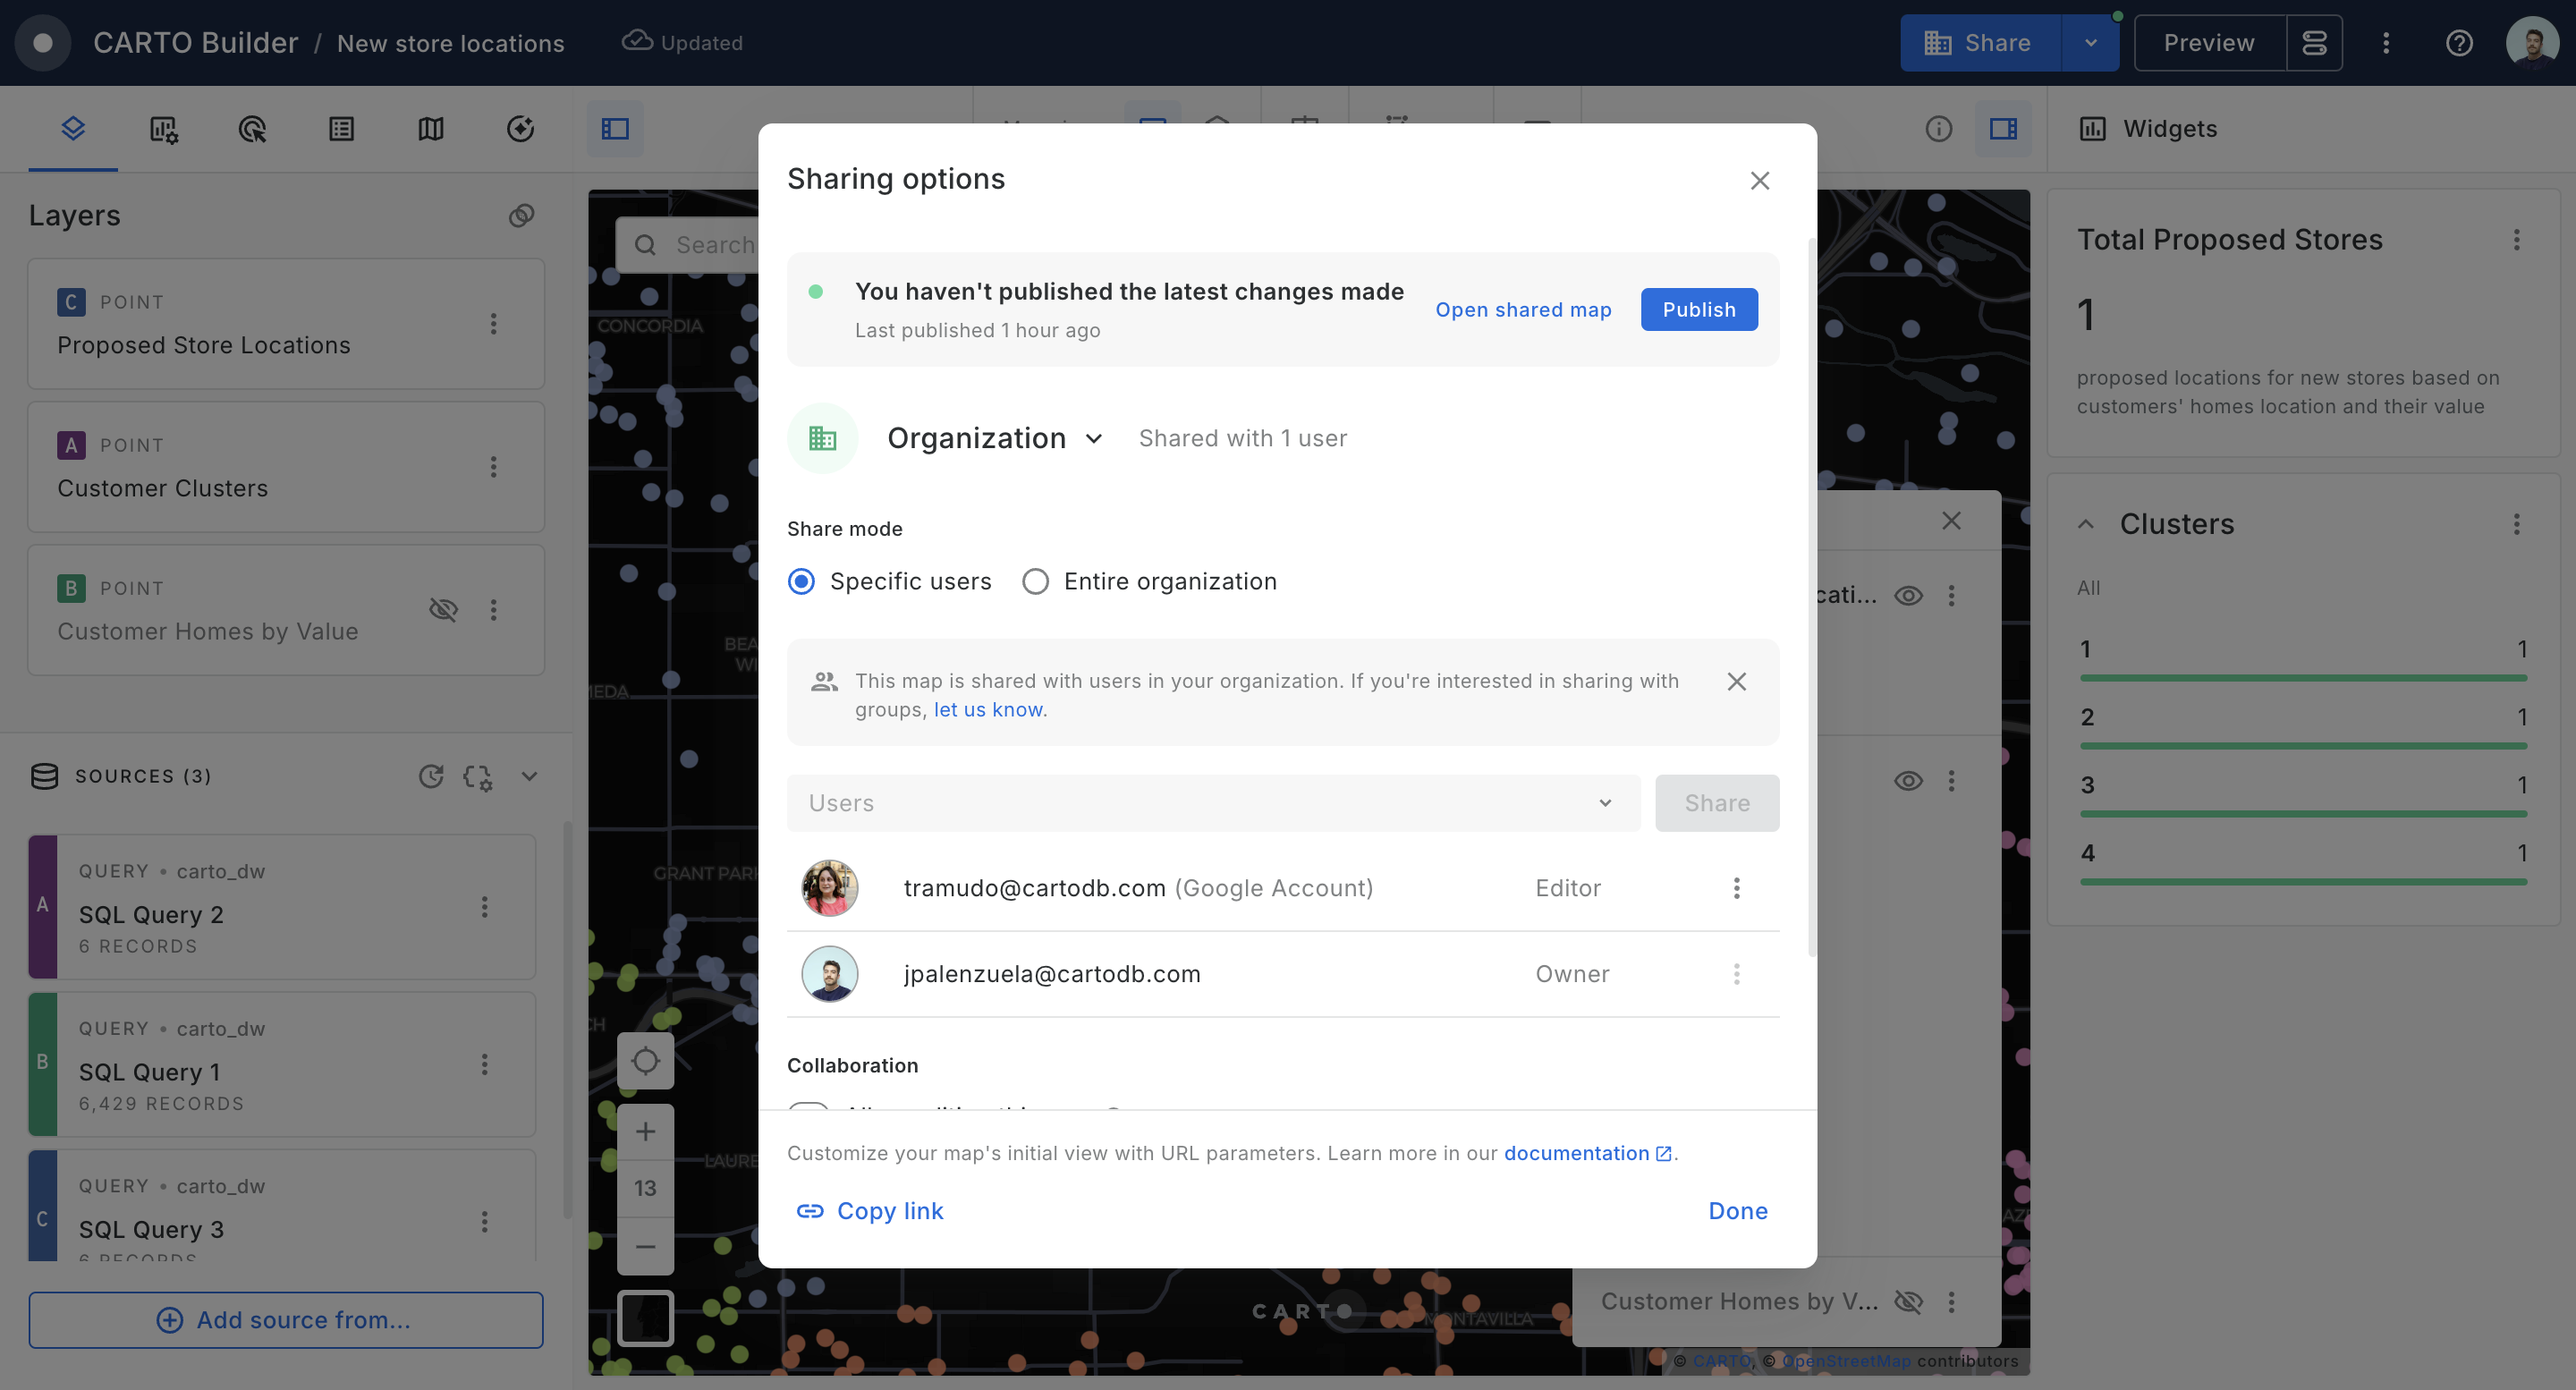
{% update date="2026-07-03" tags="new,platform" %}

## More flexible sharing for maps and workflows

Sharing maps and workflows is now more flexible. Share assets with specific people or groups, with your whole organization, or publicly, and switch between those modes in a single click.

Switching keeps the people and groups you already added with the same access permissions, so you never set anything up twice. Projects and folders share the same flexiblity: share once, and every asset inside a project or folder inherits that access.

Learn more in the [map sharing](/carto-user-manual/maps/sharing-and-collaboration) and [workflow sharing](/carto-user-manual/workflows/sharing-workflows) documentation.

<figure><img src="/files/1uzWY1OMHOvQBD0m1sTi" alt=""><figcaption></figcaption></figure>
{% endupdate %}

{% update date="2026-07-02" tags="builder,improvement" %}

## Single-select mode for text parameters

Text parameters in Builder can now be set to **single value** instead of always allowing multiple selections. Viewers pick exactly one option from a radio list, and you decide which value is selected by default.

Single-select fits any map that should answer for one thing at a time: a single product line, region, store, audience segment, or scenario in a what-if comparison. The viewer picks one option and the map returns one clear, correct result.

Learn more in the [Text parameter](/carto-user-manual/maps/sql-parameters/text-parameter) documentation.

<figure><img src="/files/FvhvlyegGDDTuQhiS1tS" alt=""><figcaption></figcaption></figure>
{% endupdate %}

{% update date="2026-07-01" tags="builder,improvement" %}

## Pie and Time Series widgets now sync with your layer colors

Pie and Time Series widgets in Builder can now inherit the colors of the layer they visualize. When a widget uses the same column your layer is styled by, it automatically picks up the layer's category colors, so the widget, the map, and the legend all match, with no extra setup. A category shown in purple on the map is purple in the widget too.

Colors are now stable within a session as well: even without a layer match, each category keeps its color as you zoom, pan, and filter, instead of shifting with the data order. This applies to the Pie widget and to the Time Series widget with Split by.

Learn more in the [Pie widget](/carto-user-manual/maps/widgets/pie-widget) and [Time Series widget](/carto-user-manual/maps/widgets/time-series-widget) documentation.

<figure><img src="/files/MEjjDb3UbjZ4U5ij4JEt" alt=""><figcaption></figcaption></figure>
{% endupdate %}
{% endupdates %}


# Q2 2026

New features and improvements introduced from April to June 2026

{% updates %}
{% update date="2026-06-29" tags="new,builder" %}

## Labels for polygons and lines in Builder

You can now add text labels directly to polygon and line layers, not just points. Turn labels on from the **Labels** section of the layer panel and choose the column to display. CARTO places each label automatically, at the center of every polygon and along the middle of every line. For lines, you can also pick a unique ID column so a feature that crosses several tiles, like a long road, shows a single label instead of one per tile.

Learn more in our [Layers documentation](/carto-user-manual/maps/layers#labels).

<figure><img src="/files/9KYk4tCb1TYeAbCDQfto" alt=""><figcaption></figcaption></figure>
{% endupdate %}

{% update date="2026-06-29" tags="new,platform" %}

## The latest AI models are now in CARTO

CARTO AI now offers the latest generation of models across every supported provider. The CARTO-managed set adds `claude-opus-4.8`, our most capable model for the hardest geospatial reasoning, and `gemini-3.5-flash` for fast, high-volume interactions.

If you bring your own provider, the newest models are available too: the GPT-5.5 and GPT-5.4 families on OpenAI, Azure, Snowflake and Databricks, `claude-opus-4.8` on Anthropic, Bedrock, Vertex AI, Snowflake and Databricks, `gemini-3.5-flash` on Vertex AI, Google AI Studio and Databricks, and xAI Grok 4.3 and 4.20 on Oracle.

Learn more in the [CARTO AI settings](/carto-user-manual/settings/carto-ai) documentation.

<figure><img src="/files/oPW1f1c9fMERhhbFwZno" alt=""><figcaption></figcaption></figure>
{% endupdate %}

{% update date="2026-06-25" tags="new,builder" %}

## Organize your layers into groups in Builder

You can now organize the layers in your map into named, collapsible **groups**. Related layers fold into tidy sections in the layer panel, so a map with a long list of layers stays easy to read and work with.

Group layers however makes sense for your map, collapse the ones you're not using, and turn a whole group's visibility on or off in one click.

Learn more in our [Layers documentation](/carto-user-manual/maps/layers#layer-groups).

<figure><img src="/files/hHoqFClcMxWsfUEjP4bZ" alt=""><figcaption></figcaption></figure>
{% endupdate %}

{% update date="2026-06-12" tags="improvement,ai-agents" %}

## AI Agents are more visible and accessible in your maps

The AI Agent in your published maps now has a more prominent place in the interface. Instead of a button users had to find and click, the Agent is immediately visible alongside the map when it loads — making it easier for your users to start a conversation and get answers right away.

Users can also expand the Agent for a more focused conversation when they need it.

Learn more about [sharing your AI Agent](/carto-user-manual/ai-agents/sharing-your-agent) and [creating AI Agents](/carto-user-manual/ai-agents) in our documentation.

<figure><img src="/files/oNWqYoZd7XYulcToawNa" alt=""><figcaption></figcaption></figure>
{% endupdate %}

{% update date="2026-06-05" tags="new,platform" %}

## Bring any custom AI provider, proxy or gateway to CARTO

CARTO already supports nine AI providers out of the box — including Google Vertex AI, OpenAI, Anthropic, AWS Bedrock, Azure OpenAI, Snowflake, Databricks, and Oracle. Now you can connect any OpenAI-compatible endpoint as well, whether that's an LLM gateway or your own self-hosted models.

Connect one or more providers, and their models become available across CARTO's AI features — [AI Agents](/carto-user-manual/ai-agents), the [Agent Config Assistant](/carto-user-manual/ai-agents/agent-config-assistant), and the [AI Assistant in Data Observatory](/carto-user-manual/data-observatory/accessing-and-browsing-the-spatial-data-catalog).

Learn more in the [CARTO AI settings](/carto-user-manual/settings/carto-ai) documentation.

<figure><img src="/files/DqFHbiPc8O3L2vv7zZ88" alt=""><figcaption></figcaption></figure>
{% endupdate %}

{% update date="2026-06-03" tags="new,ai-agents" %}

## Full visibility into your AI Agent's behavior

Get full visibility into your AI Agent's actions with new **tool traceability**. You can now see which tools were executed, the parameters used, and their outputs, all directly in the conversation. Inspect the SQL generated by `execute_query`, the arguments passed to a [Workflows MCP Tool](/carto-user-manual/workflows/workflows-as-mcp-tools), or the inputs of any other tool the Agent ran, so you know exactly how the Agent reached its answer.

Learn more about the [tools available for AI Agents](/carto-user-manual/ai-agents/working-with-tools) in our documentation.

<figure><img src="/files/0cxtyuCH3kIrYD2xuodi" alt=""><figcaption></figcaption></figure>
{% endupdate %}

{% update date="2026-05-27" tags="new,analytics-toolbox" %}

## New modules in the Analytics Toolbox for Oracle

The [Analytics Toolbox for Oracle](/data-and-analysis/analytics-toolbox-for-oracle) (v1.1.0) expands its capabilities on Oracle Autonomous Database with three new modules. The new [`data`](/data-and-analysis/analytics-toolbox-for-oracle/sql-reference/data) module brings **data enrichment** to Oracle, with the [ENRICH\_POINTS](/data-and-analysis/analytics-toolbox-for-oracle/sql-reference/data#enrich_points), [ENRICH\_POLYGONS](/data-and-analysis/analytics-toolbox-for-oracle/sql-reference/data#enrich_polygons), [ENRICH\_POLYGONS\_WEIGHTED](/data-and-analysis/analytics-toolbox-for-oracle/sql-reference/data#enrich_polygons_weighted) and [ENRICH\_GRID](/data-and-analysis/analytics-toolbox-for-oracle/sql-reference/data#enrich_grid) procedures (plus their `_RAW` variants), so you can augment your spatial data with variables from other datasets directly in SQL.

This release also adds the [`h3`](/data-and-analysis/analytics-toolbox-for-oracle/sql-reference/h3) and [`quadbin`](/data-and-analysis/analytics-toolbox-for-oracle/sql-reference/quadbin) **spatial indexing** modules. The `h3` module brings the full set of H3 functions to Oracle, covering index conversion ([H3\_FROMGEOGPOINT](/data-and-analysis/analytics-toolbox-for-oracle/sql-reference/h3#h3_fromgeogpoint), [H3\_BOUNDARY](/data-and-analysis/analytics-toolbox-for-oracle/sql-reference/h3#h3_boundary), [H3\_CENTER](/data-and-analysis/analytics-toolbox-for-oracle/sql-reference/h3#h3_center)), hierarchy traversal ([H3\_TOPARENT](/data-and-analysis/analytics-toolbox-for-oracle/sql-reference/h3#h3_toparent) / [H3\_TOCHILDREN](/data-and-analysis/analytics-toolbox-for-oracle/sql-reference/h3#h3_tochildren)), neighborhood traversal ([H3\_KRING](/data-and-analysis/analytics-toolbox-for-oracle/sql-reference/h3#h3_kring)) and polygon-to-grid conversion ([H3\_POLYFILL](/data-and-analysis/analytics-toolbox-for-oracle/sql-reference/h3#h3_polyfill)), so you can index, aggregate and analyze your data on hexagonal grids natively in Oracle. The `quadbin` module provides the equivalent set of functions for the Quadbin grid.

Learn more in the [Analytics Toolbox for Oracle release notes](/data-and-analysis/analytics-toolbox-for-oracle/release-notes) and the [SQL reference](/data-and-analysis/analytics-toolbox-for-oracle/sql-reference).
{% endupdate %}

{% update date="2026-05-27" tags="new,analytics-toolbox" %}

## New capabilities in the Analytics Toolbox for Databricks

The [Analytics Toolbox for Databricks](/data-and-analysis/analytics-toolbox-for-databricks) (v2.4.0) extends its [`statistics`](/data-and-analysis/analytics-toolbox-for-databricks/reference/statistics) module with a new [HOTSPOT\_ANALYSIS](/data-and-analysis/analytics-toolbox-for-databricks/reference/statistics#hotspot_analysis) procedure. It locates hotspot areas by combining several variables' [Getis-Ord Gi\*](/data-and-analysis/analytics-toolbox-for-databricks/reference/statistics#getis_ord_h3) statistics using Stouffer's method, and works on either H3 or Quadbin grids.

The Analytics Toolbox for Databricks also includes a [`data`](/data-and-analysis/analytics-toolbox-for-databricks/reference/data) module for **data enrichment**, with the [ENRICH\_POINTS](/data-and-analysis/analytics-toolbox-for-databricks/reference/data#enrich_points), [ENRICH\_POLYGONS](/data-and-analysis/analytics-toolbox-for-databricks/reference/data#enrich_polygons), [ENRICH\_POLYGONS\_WEIGHTED](/data-and-analysis/analytics-toolbox-for-databricks/reference/data#enrich_polygons_weighted) and [ENRICH\_GRID](/data-and-analysis/analytics-toolbox-for-databricks/reference/data#enrich_grid) procedures (plus their `_RAW` variants), so you can augment your spatial data with variables from other datasets directly in SQL.

Learn more in the [Analytics Toolbox for Databricks release notes](/data-and-analysis/analytics-toolbox-for-databricks/release-notes) and the [SQL reference](/data-and-analysis/analytics-toolbox-for-databricks/reference).
{% endupdate %}

{% update date="2026-05-26" tags="new,workflows" %}

## Version history in Workflows

Workflows now keep a complete **version history**. CARTO automatically captures versions as you work, and you can also save named versions to mark important milestones. Each time you enable or update an execution method — a schedule, an API endpoint, an MCP Tool, or Viewer mode — that snapshot is recorded and marked as the **published version** for that method, so consumers keep running against a stable state while you keep editing.

From the Version History dialog you can browse, search, and filter past versions, preview each one on the canvas, restore the workflow to an earlier state, or duplicate a new workflow from any historical version.

Learn more in our [Version history documentation](/carto-user-manual/workflows/version-history).

{% embed url="<https://vimeo.com/1195581910?autoplay=1&share=copy>" %}
{% endupdate %}

{% update date="2026-05-26" tags="new,workspace" %}

## Usage attribution by map and workflow

Admins can now see which specific **maps and workflows** are consuming their [Usage Quota](/carto-user-manual/settings/understanding-your-organization-quotas). The [Activity Data](/carto-user-manual/settings/activity-data) export now includes `map_id` and `workflow_id` columns in the API Usage table, making it easy to understand where your Usage Quota is going, identify high-cost maps and workflows, and tie consumption back to specific teams or projects.

Learn more in our [Activity Data reference](/carto-user-manual/settings/activity-data/activity-data-reference#api-usage).

<figure><img src="/files/hiQ8wgZbrGnPSXwNSG20" alt=""><figcaption></figcaption></figure>
{% endupdate %}

{% update date="2026-05-20" tags="new,workspace" %}

## Wildcard patterns in API Access Token grants

API Access Tokens now accept **wildcard patterns** in the **Table, Tileset, Raster source or Pattern** grant. Instead of listing resources one by one, you can use `*` to match multiple resources at once, for example `carto.shared.*` to cover everything under `carto.shared` or `carto.shared.CARTO_*` to cover only resources that share a naming convention. Patterns also match resources created after the token was issued, so you no longer need to re-issue tokens when new tables land.

Learn more in our [API Access Tokens documentation](/carto-user-manual/developers/managing-credentials/api-access-tokens#wildcard-patterns).

<figure><img src="/files/4nKb0t4kUmfAAobakSyf" alt=""><figcaption></figcaption></figure>
{% endupdate %}

{% update date="2026-05-21" tags="new,workspace" %}

## Granular controls for CARTO AI features

Organization Admins can now control CARTO AI at the feature level from **Settings > CARTO AI**. In addition to the organization-wide **Enable CARTO AI** toggle, each individual AI feature has its own switch and its own default model selector. The granular controls currently cover **AI Agents in Builder maps** and the new **AI Assistant in Data Observatory**, with more features to follow.

The per-feature default model overrides the organization-wide default for that specific feature, so different capabilities can run on different models. Newly introduced features are disabled by default, so Admins need to enable them explicitly before they become available to users.

Learn more in our [CARTO AI settings documentation](/carto-user-manual/settings/carto-ai#ai-features).

<figure><img src="/files/4ZKfR2rgOCXDboL5zM5b" alt=""><figcaption></figcaption></figure>
{% endupdate %}

{% update date="2026-05-21" tags="new,data-observatory" %}

## AI Assistant in Data Observatory

Finding the right dataset in the Spatial Data Catalog now takes a sentence instead of a series of filter clicks. The new **AI Assistant in Data Observatory** lets you describe what you need in natural language and applies the matching filters to the catalog for you.

Open the assistant with the **Ask AI** button at the top of the Data Observatory catalog, ask something like *"What datasets would help analyze consumer purchasing patterns in the UK?"*, and the sidebar will filter the catalog down to the datasets that fit. You can keep iterating in the same conversation to refine the results or change direction, and manual filters remain available at any time.

Learn more in our [Browsing the Spatial Data Catalog documentation](/carto-user-manual/data-observatory/accessing-and-browsing-the-spatial-data-catalog#ai-assistant-in-data-observatory).

<figure><img src="/files/bjmC3vXHTZt1GkB60Lvi" alt=""><figcaption></figcaption></figure>
{% endupdate %}

{% update date="2026-05-19" tags="new,builder" %}

## Custom SQL aggregation expressions in Builder

Spatial index layers (H3, Quadbin) and aggregated-by-geometry layers in Builder now support **custom SQL aggregation expressions** for styling and interactions. Apart from the predefined `avg`, `sum`, `min`, `max` set, you can write any aggregation expression that runs on your data warehouse. This is useful for derived metrics like rates, ratios and weighted averages.

```sql
SUM(female) / NULLIF(SUM(population), 0)
```

Learn more in our [H3 layer documentation](/carto-user-manual/maps/layers/h3#custom-aggregation-expressions).

<figure><img src="/files/rUHoFB56ytGul0v9Jx84" alt=""><figcaption></figcaption></figure>
{% endupdate %}

{% update date="2026-05-18" tags="improvement,builder" %}

## Scale point radius with zoom in Builder

Point layers in Builder now support a new **Scale with zoom level** option for radius. Instead of a fixed pixel size, points grow and shrink with the map zoom, staying visually proportional to context. A **Min / Max bounds** clamp keeps points readable at extreme zooms, and the option applies to both simple points and custom markers.

Learn more in our [Point layer documentation](/carto-user-manual/maps/layers/point#scale-with-zoom-level).

<figure><img src="/files/Cbrwt6Q66p5UpyA7Gmsd" alt=""><figcaption></figcaption></figure>
{% endupdate %}

{% update date="2026-05-14" tags="new,carto-for-agents" %}

## CARTO for Agents: bring the platform into your AI workflows

AI agents are quickly becoming part of how teams build with spatial data. We're launching **CARTO for Agents**, three new capabilities that put the entire CARTO platform within reach of the AI agents you already use: authoring Builder maps and Workflows, managing connections, browsing the Data Observatory, running imports and exports, and anything else you do day to day.

* [**CARTO CLI**](/carto-for-agents/cli). A script-friendly command-line for the platform that humans run in a terminal and agents call as a tool. The latest release adds first-class Builder map and Workflow authoring from JSON bundles.
* [**CARTO MCP Server**](/carto-for-agents/mcp-server). A hosted [Model Context Protocol](https://modelcontextprotocol.io/) server that exposes built-in CARTO tools, plus any workflow you publish, to web and desktop AI clients like Claude.ai, ChatGPT, and Gemini.
* [**CARTO Agent Skills**](/carto-for-agents/agent-skills). A public catalog of skill playbooks at [`CartoDB/agent-skills`](https://github.com/CartoDB/agent-skills) that teaches coding agents (Claude Code, Codex, Cursor, Gemini CLI) how to drive CARTO without re-discovering the API every session.

The three pieces work together depending on the scenario. A chat agent in Claude.ai, ChatGPT, or Gemini connects through the MCP Server. A coding agent in Claude Code, Cursor, or Codex combines the CLI with the Agent Skills, which teach it the right flags and patterns for each task. Learn more in our [CARTO for Agents documentation](/carto-for-agents/carto-for-agents).

<figure><img src="/files/LKJMNyc9BL3IPbgm8OUP" alt=""><figcaption></figcaption></figure>
{% endupdate %}

{% update date="2026-05-14" tags="new,workspace" %}

## CARTO AI Analytics for organization Admins

Organization Admins now have a dedicated **Analytics** tab in Settings > CARTO AI to see how CARTO AI is being used across the organization. The tab is split into three views: **All activity** with active users and consumption of your AI and agentic usage quotas, **CARTO Agents** with activity from AI Agents created in Builder, and **External Agents** with activity driven from external clients consuming CARTO through the MCP Server and the CARTO CLI.

Learn more in our [CARTO AI Analytics documentation](/carto-user-manual/settings/carto-ai/carto-ai-analytics).

<figure><img src="/files/2jhIP1ekwwLmGjMlGkNN" alt=""><figcaption></figcaption></figure>
{% endupdate %}

{% update date="2026-05-14" tags="new,workspace" %}

## Quota controls for organization Admins

Organization Admins can now cap how much of each quota a specific user or group is allowed to consume, directly from **Settings > Quotas & Activity > Quota Limits**. Limits can be set for the Usage quota, the Location Data Services quota, and the AI quota, and they are hard limits: once a user or group reaches the limit, they are blocked from consuming more of that quota until an Admin raises or removes the limit.

Learn more in our [Managing quotas documentation](/carto-user-manual/settings/managing-quotas).

<figure><img src="/files/HtAgnV2lvs3nHXqQw63U" alt=""><figcaption></figcaption></figure>
{% endupdate %}

{% update date="2026-05-08" tags="new,builder" %}

## Google Photorealistic 3D Tiles in Builder

Bring your maps to life with our new CARTO Builder basemap option: **Google Photorealistic 3D Tiles**. This high-fidelity representation of the world built from aerial and satellite imagery lets you explore your data on top of detailed 3D buildings and terrain.

Your data will automatically cover the surface of buildings and other 3D terrain features, allowing you to understand the data in real-world context. This can be incredibly useful for urban planning, real estate or insurance use cases.

Google Photorealistic 3D Tiles span over **2,500 cities across 49 countries.** See Google's [Photorealistic 3D Tiles coverage](https://developers.google.com/maps/documentation/tile/3d-tiles-overview) for the latest list of supported areas.

Ready to try it? Learn more in our [Basemaps documentation](/carto-user-manual/maps/basemaps).

<figure><img src="/files/me2bLvhypMPQIEOMeqHL" alt=""><figcaption></figcaption></figure>
{% endupdate %}

{% update date="2026-04-20" tags="improvement,builder" %}

## Reorder categorical legend entries in Builder

Categorical and ordinal legend entries can now be reordered in Builder to improve map readability. Categories can be sorted by frequency or alphabetically, in ascending or descending order.\
\
Reordering only affects the legend’s reading order, colors remain fixed to each category, so the map visualization does not change.

Learn more in our [Legend documentation](/carto-user-manual/maps/legend).

<figure><img src="/files/OxVap1EUBtWbgPj6vucb" alt=""><figcaption></figcaption></figure>
{% endupdate %}

{% update date="2026-04-15" tags="improvement,builder" %}

## Click interactions now show every overlapping feature

Click interactions in Builder now paginate across every feature at clicked location, in both pop-up and info panel modes. When overlapping polygons, overlapping lines, or multiple records sharing the same geometry sit at the same spot, you can step through all of them within a layer instead of only seeing the top one.\
\
Previously, clicking a stacked location surfaced only a single feature and the rest were unreachable without zooming in or filtering the data. The new prev/next controls let you browse all of them, with the map highlighting updating as you paginate.

Learn more in our [Click interactions documentation](/carto-user-manual/maps/interactions#click-type-interactions).

<figure><img src="/files/GOxsq6w3gGi9KLDdT6Wg" alt=""><figcaption></figcaption></figure>
{% endupdate %}
{% endupdates %}


# Q1 2026

New features and improvements introduced from January to March 2026

{% updates %}
{% update date="2026-03-30" tags="new,carto-for-developers" %}

## Build AI-first spatial apps with CARTO Agentic Tools for developers

Building AI-powered apps with geospatial capabilities just got a lot easier. We're releasing `@carto/agentic-deckgl`, an open-source TypeScript library built on [CARTO + deck.gl](https://carto.com/blog/modern-spatial-app-development-carto/) that lets any AI Agent create and style map layers, run spatial analytics, and interact with the map through natural language — with one npm install. It's framework-agnostic, includes Zod-validated tool definitions, a geospatial system prompt builder, and SDK converters for major AI frameworks.

The library gives AI Agents full control over the map experience: creating and styling vector tile, H3, GeoJSON, and raster layers from any CARTO data source; navigating the globe with smooth transitions; switching basemaps; placing and managing markers; applying spatial filters from user-drawn areas or analytical workflows; and managing widgets, visual effects, and layer ordering.

Learn more about this new library in our [product announcement](https://carto.com/blog/carto-agentic-tools-for-developers/).

<figure><img src="/files/eJAl3JUuug6jBLwKFpM0" alt=""><figcaption></figcaption></figure>
{% endupdate %}

{% update date="2026-03-30" tags="new,builder" %}

## Create AI Agents through conversation with the new Configuration Assistant

Creating AI Agents just got significantly easier. The new **Agent Configuration Assistant** lets you design, set up, and iterate on your agents using natural language.

Instead of manually defining instructions, selecting tools, and configuring capabilities step by step, you can now **simply describe what your agent should do**. The Assistant generates a complete configuration for you — including the use case, structured instructions, model selection, tool setup, capabilities, and a tailored introduction message.

The Assistant is context-aware, meaning its recommendations are grounded in your actual map. It understands your datasets, layers, widgets, and available tools, helping you create more accurate and relevant agents from the start. You can refine any part of the configuration through conversation or combine it with manual edits for full control.

[Learn more about the Agent Config Assistant in our documentation.](/carto-user-manual/ai-agents/agent-config-assistant)

<figure><img src="/files/Y735tL6knJWLymdWLb87" alt=""><figcaption></figcaption></figure>
{% endupdate %}

{% update date="2026-03-27" tags="new,workflows" %}

## Viewer Mode for Workflows

Workflows can now be shared with **Viewer Mode**, allowing editors to publish interactive workflows that other users can run without editing the canvas. This opens up new possibilities for delivering analytical tools and reports to stakeholders and business users.

* **Viewer parameters**: Editors define which variables are exposed to viewers as configurable parameters, with custom display names and helper text. Supported types include Number, String, and the new **Geo** type, which lets viewers draw geographic features on a map.
* **Viewer Result Output**: A new component that defines which node's output is displayed to viewers, giving editors full control over what results are visible.
* **Viewer settings**: Granular controls over the viewer experience, including toggling the canvas visibility, SQL preview, data export, result caching, and more.

[Learn more about Viewer Mode in our documentation](/carto-user-manual/workflows/viewer-mode).

{% embed url="<https://vimeo.com/1177627305?autoplay=1>" %}
{% endupdate %}

{% update date="2026-03-19" tags="improvement,platform" %}

## Claude 4.6 models now available for AI Agents

We've expanded the AI models available for AI Agents with the latest generation of Anthropic models.

* **More CARTO-managed models:** Claude Opus 4.6 and Claude Sonnet 4.6 are now available out of the box with no additional configuration.
* **Broader bring-your-own-model support:** You can now use Claude Opus 4.6 and Claude Sonnet 4.6 through any of our supported providers, including Vertex AI, AWS Bedrock, Azure OpenAI, Anthropic, Snowflake Cortex, and Databricks Serving Model.

The 4.6 models deliver better performance across reasoning, tool usage, and complex geospatial workflows.

Configure your models in **Settings > CARTO A**I — see the [CARTO AI documentation](/carto-user-manual/settings/carto-ai) for the full list of supported models and providers.

<figure><img src="/files/DblOJKi7oNDabMoGYWRE" alt=""><figcaption></figcaption></figure>
{% endupdate %}

{% update date="2026-02-17" tags="improvement,platform" %}

## Additional AI models to power your Agents

We've expanded the AI models available for AI Agents with more advanced models from Anthropic, Google, and OpenAI.

* **More CARTO-managed models:** Claude Opus 4.5, Claude Sonnet 4.5, Gemini 3 Pro, and Gemini 3 Flash are now available out of the box with no additional configuration.
* **Broader bring-your-own-model support:** You can now use Gemini 3, Claude Opus 4.5, and GPT-5.2 through any of our supported providers, including Vertex AI, Google AI Studio, Snowflake Cortex, Databricks Serving Model, AWS Bedrock, Azure OpenAI, OpenAI, and Anthropic.

We recommend upgrading to the newest models available — you'll see a significant improvement in agent performance, reasoning, and tool usage.

Configure your models in **Settings > CARTO AI** — see the [CARTO AI documentation](/carto-user-manual/settings/carto-ai) for the full list of supported models and providers.

<figure><img src="/files/NKszySuO7FejCpIuj2Nn" alt=""><figcaption></figcaption></figure>
{% endupdate %}

{% update date="2026-02-09" tags="improvement,builder" %}

## AI Agents now create interactive charts

[AI Agents](/carto-user-manual/ai-agents) can now generate and render interactive charts directly inside the conversation. Users can ask for data visualizations and see charts rendered inline — no need to leave the chat.

Charts expand the way AI Agents can communicate insights, complementing map layers with statistical visualizations like bar charts for comparisons, line charts for trends, or histograms for distributions. Combined with other tools, AI Agents can query your data, analyze it, and present findings in the format that best fits the question.

[Learn more about AI Agent tools in our documentation](/carto-user-manual/ai-agents/working-with-tools).

<figure><img src="/files/M6Du9eyrHxELGKYYVRqJ" alt=""><figcaption></figcaption></figure>
{% endupdate %}

{% update date="2026-01-29" tags="new,platform" %}

## Introducing our new Command-line Interface

We're excited to announce the [CARTO CLI](https://carto.com/blog/carto-cli-automateed-carto-management-build-for-ai-agents), which brings command line power to your CARTO organization. Manage Maps, Workflows, connections and credentials; transfer assets between organizations, and query your organization's activity data; all from the terminal!

The CLI supports structured JSON output, non-interactive execution, and headless authentication, making it a natural interface to script and automate. To get started, head over to our [CARTO CLI documentation](/carto-for-agents/cli).

<figure><img src="/files/GsJ7J8aWwjWrICnj5Cz7" alt="" width="375"><figcaption></figcaption></figure>
{% endupdate %}

{% update date="2026-01-29" tags="improvement,workspace" %}

## Tracking activity data from public maps

Public maps are the way to distribute geospatial data and insights across wider audiences outside your organization. From coverage maps to deforestation storytelling, many geospatial dashboards are making an impact on public websites thanks to CARTO.

Starting now, CARTO administrators can measure that impact, and answer questions like:

* **How many times my public maps have been viewed**
* **Which are my most active public maps**
* **How many exports from public maps last month...**

We've automatically added to our [Activity Data](/carto-user-manual/settings/activity-data) the data coming from your public maps thanks to a robust, secure, event pipeline that can track millions of events coming from unauthenticated users.

To get started, simply [export your Activity Data](/carto-user-manual/settings/activity-data) or [integrate it via API](/carto-user-manual/settings/activity-data#access-via-api).

<figure><img src="/files/UcriAHklKcuxX19epnfp" alt=""><figcaption></figcaption></figure>
{% endupdate %}

{% update date="2026-01-20" tags="new,platform" %}

## New AI provider and LLM integrations to power your AI Agents

CARTO now supports seven additional AI providers, expanding the AI and LLM integrations available to power **AI Agents**.

Previously limited to **OpenAI** and **Google AI Studio**, you can now connect AI Agents to models hosted on your preferred cloud or data platform:

* **Google Vertex AI**: Enterprise GCP deployments with service account authentication.
* **Amazon Bedrock**: Claude models through AWS infrastructure.
* **Snowflake Cortex**: AI models within your Snowflake environment.
* **Databricks Model Serving**: Models through Databricks endpoints.
* **Oracle Generative AI**: Access to models via OCI.
* **Anthropic**: Direct access to Claude models.
* **Azure OpenAI Service**: OpenAI models through Azure.

These new integrations allow AI Agents to run on your preferred cloud or data platform, leverage existing cloud contracts, meet data residency requirements, and access the latest large language models available from each provider.

Configure providers in **Settings > CARTO AI**. See the [CARTO AI documentation](/carto-user-manual/settings/carto-ai) for setup instructions.

<figure><img src="/files/cX1oOWWaRkmFsMFB2aja" alt=""><figcaption></figcaption></figure>
{% endupdate %}

{% update date="2026-01-14" tags="improvement,builder" %}

## CARTO Basemap labels now stay on top of your layers

When using CARTO Basemaps, labels (like city and street names) now automatically appear on top of your map layers instead of being hidden underneath them.

This makes it easier to read your maps, especially when working with multiple overlapping layers. You can still turn labels off in the basemap settings if you prefer a cleaner look.

<figure><img src="/files/lBW1ROv5sdtMuCSOeMaG" alt=""><figcaption></figcaption></figure>
{% endupdate %}

{% update date="2026-01-12" tags="new,workflows,analytics-toolbox" %}

## H3-based isochrones powered by TravelTime

A new capability is now available for generating **H3-based isochrones** using [TravelTime](https://docs.traveltime.com/api/reference/h3), expanding how accessibility and travel-time analysis can be performed in CARTO.

This release introduces a new endpoint in the **Location Data Services (LDS) API** that leverages TravelTime’s H3 isochrone support. In addition, corresponding functions are available in the **Analytics Toolbox** (for [BigQuery](/data-and-analysis/analytics-toolbox-for-bigquery/sql-reference/lds#create_h3_isolines), [Snowflake](/data-and-analysis/analytics-toolbox-for-snowflake/sql-reference/lds#create_h3_isolines), [Databricks](/data-and-analysis/analytics-toolbox-for-databricks/reference/lds#create_h3_isolines) and [Redshift](/data-and-analysis/analytics-toolbox-for-redshift/sql-reference/lds#create_h3_isolines)), along with a new [Create H3 Isolines](/carto-user-manual/workflows/components/spatial-constructors#create-h3-isolines) component in **Workflows**, enabling low-code and programmatic access to this functionality.

Customers can now generate H3-indexed isochrones directly, with support for the same configuration options provided by the underlying TravelTime API, including **departure time** and **transport mode**. Using H3 as the output format simplifies downstream analysis, aggregation, and visualization, particularly for workflows that already rely on hexagonal indexing.

{% embed url="<https://vimeo.com/1153538127?autoplay=1>" %}
{% endupdate %}

{% update date="2026-01-07" tags="new,platform" %}

## Full support for new Databricks Spatial SQL functions and data types

A new [Databricks connection](/carto-user-manual/connections/databricks) type is now generally available across all CARTO accounts, delivering deeper and more modern support for Databricks as a data warehouse and compute platform.

This integration adopts **Databricks SQL Warehouses** as the sole compute resource, providing a serverless, cloud-native experience without the need to manage traditional compute clusters. It also leverages Databricks’ [**native spatial capabilities**](https://www.databricks.com/blog/introducing-spatial-sql-databricks-80-functions-high-performance-geospatial-analytics?utm_source=chatgpt.com), including the GEOMETRY data type and Spatial SQL functions documented by Databricks, enabling efficient storage and processing of spatial data directly in SQL without external libraries.

Connectivity options include **Personal Access Tokens (PAT), M2M, and U2M integrations**, offering flexibility in how authentication and access are managed. Builder and Workflows fully support Databricks tables with geometry types out of the box, including query sources, SQL parameters, Location Data Services, and Create Builder Map workflows — no additional data preparation is required to work with spatial columns.

The [**Analytics Toolbox**](/data-and-analysis/analytics-toolbox-for-databricks) now installs directly into the Databricks Unity Catalog with no external dependencies, simplifying governance and deployment. Older Databricks connection types remain available for existing accounts that used them previously. This release represents a significant step in CARTO’s support for major cloud data warehouse providers and extends CARTO’s capabilities for spatial analytics on modern data platforms.

<figure><img src="/files/DzqA9Fo5izo1L94Ar6tk" alt=""><figcaption></figcaption></figure>
{% endupdate %}
{% endupdates %}


# Q4 2025

New features and improvements introduced from October to December 2025

{% updates %}
{% update date="2025-12-29" tags="new,builder" %}

## Track and restore previous versions of your map

We've introduced **Version history** in Builder, giving you the ability to track and manage different versions of your maps over time.

CARTO automatically saves versions as you work, and you can also manually save named versions to mark important milestones. You can view the full history of changes, restore any previous version to undo unwanted changes, or duplicate from a historical version to create variations without affecting the current map.

Version history works seamlessly with collaborative maps—all changes are tracked with the collaborator's name and timestamp, providing a complete audit trail. When you publish a map, the published version is marked with a badge so you always know which version is live.

[Learn more in our documentation](/carto-user-manual/maps/version-history).

<figure><img src="/files/52T5JNSER6yaz2lAT8GQ" alt=""><figcaption></figcaption></figure>
{% endupdate %}

{% update date="2025-12-12" tags="new,workflows" %}

## **New components to run spatial analytics techniques on embeddings from Geospatial Foundation Models**

We’re introducing the **Analytics on Embeddings** extension package for **CARTO Workflows**, a new set of components that bring high-dimensional vector embedding analytics into spatial workflows. This extension enables users to analyze, cluster, compare, and visualize embedding representations (whether derived from geospatial foundation models, satellite data, or other spatial sources) directly within their Workflows pipelines.

Key capabilities in this package include:

* [**Change Detection**](/carto-user-manual/workflows/components/embedding-analytics#change-detection): Quantifies temporal changes in embedding vectors to monitor dynamics over time.
* [**Clustering**](/carto-user-manual/workflows/components/embedding-analytics#clustering): Groups locations based on similarity in embedding space, with optional dimensionality reduction to improve performance.
* [**Similarity Search**](/carto-user-manual/workflows/components/embedding-analytics#similarity-search): Identifies regions with similar spatial or contextual characteristics relative to one or more reference locations.
* [**Visualization**](/carto-user-manual/workflows/components/embedding-analytics#visualization): Converts high-dimensional embeddings into RGB colors for intuitive mapping and pattern discovery.

These components work seamlessly with embedding vectors stored as table columns and support integration with the [**Geospatial Foundation Models**](/carto-user-manual/workflows/components/google-pdfm-embeddings) extension, enabling richer insights from learned representations without leaving the low-code Workflows environment.
{% endupdate %}

{% update date="2025-12-09" tags="improvement,workspace" %}

## Manage developer credentials from the asset management table

Superadmin users can now view and manage all developer credentials in their organization, including **API Access Tokens**, **SPA OAuth Clients**, and **M2M OAuth Clients**. From the Asset Management table of the settings, Superadmins now can:

* Find credentials by type, name and owner
* Transfer credentials to another user (only available for API Access Tokens and SPA OAuth Clients)
* Delete credentials

This improvement simplifies team collaboration by allowing credentials to be transferred between users seamlessly, preventing disruptions if the credential owner is unavailable or leaves.

For more information, see our section on the [Superadmin role](/carto-user-manual/settings/users-and-groups/managing-user-roles#superadmin).

<figure><img src="/files/v1vOnsO0muF2PN7ptGZb" alt=""><figcaption></figcaption></figure>
{% endupdate %}

{% update date="2025-11-18" tags="improvement,workspace" %}

## Unified access to Data Observatory subscriptions and improved subscription management

With this release, we’re making it simpler and more consistent for users to access and work with data from their Data Observatory subscriptions. Access to data has now been fully unified to always be via your own data warehouse connections. Additionally we've also improved the way Admin users can manage the organization's Data Observatory subscriptions from the Settings section in the CARTO Workspace.

* We’ve unified access to the data from Data Observatory subscriptions to always be rom the end-user data warehouse connections. As announced earlier this year, we have **deprecated the Data Observatory tab in Data Explorer, Builder, and Workflows**. This tab previously exposed subscriptions only through a small set of connections (i.e. CARTO Data Warehouse and BigQuery US multi-region). Since all subscriptions are now available directly via data warehouse connections, the tab has been removed to avoid confusion.
* The [Data Observatory section](/carto-user-manual/settings/data-observatory) in Settings has been significantly improved. It now serves as the central place to manage your organization’s subscriptions, showing to which data warehouse each subscription has been transferred, and allowing users to request new transfers so the data is available directly in their data warehouses.

<figure><img src="/files/ZohHHveObtiJfACJrjHp" alt=""><figcaption></figcaption></figure>
{% endupdate %}

{% update date="2025-11-18" tags="improvement,workspace" %}

## Starring data assets for quicker access

Users are now able to star items at any level in the Data Explorer, including connections, projects/databases/schemas, and the data tables themselves. Simply click on the star icon next to any item in the Data Explorer and then use the *Starred only* filter to show just your starred items.

This is especially helpful to users that have connections or data assets that are recurrently used in their maps and workflows. No more browsing the data tree until you find what you need!

Your starred items are now also easily accessible from the "Add data source" flow in CARTO Builder and from the data sources panel in CARTO Workflows.

To learn more about starring items and the Data Explorer in general, check out our [documentation](/carto-user-manual/data-explorer).

<figure><img src="/files/Qd2qiyeStKYXZmpXPJSM" alt=""><figcaption></figcaption></figure>
{% endupdate %}

{% update date="2025-11-07" tags="improvement,builder" %}

## Integrate CARTO maps anywhere with the new authenticated embeds and reactive map events

Embedding maps from CARTO in other webpages and applications just became exponentially easier and more powerful thanks to two additions to our platform:

* **New methods for seamless and secure private embedding:** We added two new strategies to embed private maps securely, without having to publish the map or forcing the users to login in a different tab or browser. Developers can also re-use existing authorization in their applications. [Learn more about private embedding strategies](/carto-user-manual/maps/sharing-and-collaboration/embedding-maps#private-embedding).
* **Build bi-directional interactive experiences with our embedded events:** Embedded maps from CARTO now send `postMessage` events every time something changes in the map. This allows the parent application to react, creating bi-directional interactive experiences when combined with our embed URL parameters. [Learn more about embedding events](/carto-user-manual/maps/sharing-and-collaboration/embedding-maps#listening-to-events-from-embedded-maps).

We're excited to see where you will embed your next CARTO map!

<figure><img src="/files/meH0zDqHA6dX0PYayhAI" alt=""><figcaption></figcaption></figure>
{% endupdate %}

{% update date="2025-11-06" tags="new,builder" %}

## New map interaction tools for AI Agents

AI Agents can now interact directly with your maps through two new tools:

* **Dynamic marker placement**: Ask the AI Agent to mark specific locations, and it will instantly place markers on your map. Simply provide an address, place name, or coordinates—the agent handles geocoding and placement automatically.
* **Spatial filtering by area**: The AI Agent can define custom areas of interest to filter your data dynamically. When an area is set, all map widgets and layers update automatically to show only data within that region.

These tools enable your AI Agent to provide immediate visual context and perform focused analysis on specific geographic areas without manual configuration.

[Learn more in our documentation](/carto-user-manual/ai-agents/working-with-tools#map-tools).

<figure><img src="/files/EZnLAdQLkTwzXG3yvn5W" alt=""><figcaption></figcaption></figure>
{% endupdate %}

{% update date="2025-10-08" tags="new,builder" %}

## Introducing Agentic GIS in CARTO: making spatial insights available to everyone

We are incredibly excited to announce new features that bring enterprise-grade geospatial agentic experiences to CARTO.

* **Introducing AI Agents in Builder:** [CARTO AI Agents](/carto-user-manual/ai-agents) (now in General Availability) provide a conversational interface in your maps where your end users can get instant and actionable geospatial insights through natural language.
* **AI Agents can now query sources, generate layers and more:** We've added a ton of exciting capabilities that allow agents to reason and perform geospatial analysis autonomously.
* **Integrate Workflows as tools for your AI Agents:** From building operational dashboards to running complex analyses, your AI Agent can be supercharged with your own custom workflows [enabled as MCP tools](/carto-user-manual/workflows/workflows-as-mcp-tools).
* **Evolved experience to tailor your Agent:** You can now reference tools, sources, and other context available in the map when customizing your agent.
* **Use your own AI models:** [Configure your own AI models](/carto-user-manual/settings/carto-ai) and maintain total control over the AI technology used. Supported providers include Google Gemini and Open AI, with others coming soon.

With CARTO you can now create and share access to powerful geospatial AI Agents tailored to your specific needs. Combine your custom prompt instructions with CARTO's built-in geospatial intelligence and your own workflows, and **build trustworthy AI solutions that make complex geospatial analysis accessible to any user within your organization**.

Get started today by [enabling CARTO AI in your organization](/carto-user-manual/settings/carto-ai).

And learn more about Agentic GIS in our [announcement blog post](https://carto.com/blog/agentic-gis-bringing-ai-driven-spatial-analysis-to-everyone)!

<figure><img src="/files/wdSxYuACCOWNvbkcsZVJ" alt=""><figcaption></figcaption></figure>
{% endupdate %}

{% update date="2025-10-08" tags="new,workflows" %}

## Turn your AI Agents into geospatial experts with CARTO MCP Server

CARTO now supports the **Model Context Protocol (MCP)**, a standard that enables AI Agents to interact with external tools and data sources. With the new **CARTO MCP Server**, organizations can now expose their own geospatial [Workflows as MCP Tools](/carto-user-manual/workflows/workflows-as-mcp-tools) that any MCP-compliant agent can use.

This release allows GIS teams to design custom workflows in CARTO—defining inputs, outputs, and logic specific to their spatial problems—and make them available to AI Agents through the MCP Server. Each tool includes detailed metadata following the MCP specification, ensuring interoperability across agentic AI environments.

By combining Workflows and the MCP Server, organizations can empower AI Agents to perform advanced spatial analysis, automate geospatial decision-making, and connect AI-driven applications to their cloud data infrastructure.

{% embed url="<https://vimeo.com/1125236398?autoplay=1>" %}
{% endupdate %}
{% endupdates %}


# Q3 2025

New features and improvements introduced from July to September 2025

{% updates %}
{% update date="2025-09-30" tags="new,workflows" %}

## Territory Balancing and Location Allocation components in Workflows

CARTO's new [Territory Planning Extension Package](/carto-user-manual/workflows/components/territory-planning) for Workflows has been built to power location allocation and territory balancing directly within CARTO and your data warehouse, this extension helps analysts and planners create fair, efficient, and data-driven territory strategies.

* [Territory Balancing](https://docs.carto.com/carto-user-manual/workflows/components/territory-planning#territory-balancing) – Divide an area into continuous, optimized territories that are balanced according to a chosen metric (e.g. consumer demand or other business KPIs), while keeping each territory internally cohesive. Learn more about this new capability following this [tutorial](https://academy.carto.com/creating-workflows/step-by-step-tutorials/optimizing-workload-distribution-through-territory-balancing).
* [Location Allocation](https://docs.carto.com/carto-user-manual/workflows/components/territory-planning#location-allocation) – Find the optimal locations to open facilities (stores, warehouses, service hubs) and efficiently assign demand points (retail stores, populated regions) to them, minimizing costs or maximizing coverage. Take a look at this [tutorial](https://academy.carto.com/creating-workflows/step-by-step-tutorials/transforming-telco-network-management-decisions-with-location-allocation) to learn more!.

This extension package is currently available for Google BigQuery and Snowflake.

<figure><img src="/files/k0tnUGZfyMuHHkOhYIZ1" alt=""><figcaption></figcaption></figure>
{% endupdate %}

{% update date="2025-08-28" tags="improvement,workspace" %}

## Improved flow for deleting connections

We've added a new option for users deleting connections so that all maps, workflows, tokens, etc. using the connection are updated to use another connection. Previously, users had to either update each asset individually or delete the connection along with all assets using it.

This new option vastly facilitates migrating from one connection to another, which is a common case when upgrading authentication types (changing from username/password to key pair or OAuth, for example).

Alternatively, users can still choose to delete the connection along with all assets that use it. For more information, see our article on [deleting connections](/carto-user-manual/connections/deleting-a-connection).

<figure><img src="/files/Uy9aeDoZOuA5RW6bf2w3" alt=""><figcaption></figcaption></figure>
{% endupdate %}

{% update date="2025-08-28" tags="improvement,workspace" %}

## Improvements to importing geospatial data into cloud data warehouses

Recent updates have enhanced the experience of importing geospatial data into cloud data warehouses, with improvements in performance, scalability, and raster support.

Import operations now run faster thanks to a new, optimized process. The maximum supported file size has also been raised from **1GB to 5GB**, addressing a very frequent need when working with large geospatial datasets.

Raster-processing capabilities have been extended in **BigQuery and Snowflake**, supporting the import of non-COG GeoTIFF rasters into warehouse tables following the [Raquet specification](https://github.com/CartoDB/raquet?utm_source=chatgpt.com). This removes the strict preparation steps previously required for Cloud Optimized GeoTIFFs, making the process considerably simpler. Combined with the higher size limit, these updates provide a more efficient way for customers to bring raster data into their cloud environment.

{% embed url="<https://vimeo.com/1114283760?autoplay=1&share=copy>" %}
{% endupdate %}

{% update date="2025-08-27" tags="improvement,builder" %}

## **Drag and drop reordering of properties in Table and Interactions**

We've introduced the ability to reorder the properties shown in the Table widget and Tooltip via simple drag and drop functionality.

Until now, users could configure which properties to show, but changing the order they are presented often meant clearing the setup and starting over again. With this enhancement, it’s easier than ever to customize how data is displayed, improving readability and enabling tailored views for different audiences.

<figure><img src="/files/S8CG6KrrNTnQeccAQCPZ" alt=""><figcaption></figcaption></figure>
{% endupdate %}

{% update date="2025-08-12" tags="new,workflows" %}

## **Control Components in Workflows: Conditional Split & Success/Error Split**

We’ve added two new [control components](/carto-user-manual/workflows/components#control) to CARTO Workflows that make it easier to control how your workflows execute and respond to different scenarios.

* [**Conditional Split**](/carto-user-manual/workflows/components/control#conditional-split) – Direct your workflow into **If** and **Else** branches based on a condition you define. Build the condition with a simple UI (column + aggregation + operator + value) or use a custom SQL expression for more complex logic.\
  Some usage examples:
  * “If the **count of underserved households** in a service area is greater than 500, trigger a fiber expansion workflow; otherwise plan for wireless coverage.”
  * “If the **average property value** in a high-risk flood zone is above $1M, apply the high-risk pricing model; otherwise, use the standard pricing model.”
* [**Success/Error Split**](/carto-user-manual/workflows/components/control#success-error-split) – Branch execution depending on whether the previous step ran successfully or failed.\
  Some usage examples:
  * “If network quality metrics fail to load, send an alert; otherwise continue with churn prediction.”
  * “If address geocoding fails, switch to a backup geocoder; otherwise proceed with claims analysis.”

These components let you build workflows that adapt to your data, add robust error-handling, and reduce the need for manual monitoring — helping teams act faster on reliable insights.

{% embed url="<https://vimeo.com/1109408145?autoplay=1&share=copy>" %}
{% endupdate %}

{% update date="2025-08-05" tags="improvement,workspace" %}

## **Separation of working locations for improved data governance**

We have introduced a clearer separation of datasets/schemas that CARTO creates and manages in connected data warehouses. This change improves data governance and prevents persistent objects from being stored alongside temporary workflow tables.

**New locations per connection:**

* **CARTO temp location** – stores only temporary tables created during workflow execution.
* **CARTO Workspace location** – stores persistent objects related to workflows, such as API stored procedures and imported files.
* **CARTO Extensions location** – stores Extension Package resources, including shared stored procedures and metadata. Only for BigQuery and Snowflake.

**Additional notes:**

* For connections shared requiring Viewer Credentials, `carto_temp_<user>` and `carto_workspace_<user>` are created per user.
* The Extensions location is always shared across all users in a connection, ensuring consistent access to installed packages.
* Default names can be overridden in the connection’s advanced options.
* Locations are automatically created as needed (`CREATE IF NOT EXISTS`).

This update applies to all supported warehouses. Find specific documentation on the *Advanced settings* section for each warehouse in the [Connections](/carto-user-manual/connections) section of the documentation.

<figure><img src="/files/lUZrQoLoT4KvzkGopUos" alt=""><figcaption></figcaption></figure>
{% endupdate %}

{% update date="2025-07-29" tags="new,builder" %}

## Support for adding sources without associated layer in Builder

Editor users can now add data sources to a Builder map **without displaying associated layers**. These sources can be used to power widgets, SQL parameters, and even be used by AI Agents to generate insights.

This is especially useful when a dataset is needed for interactivity or calculations, but not for visualization. It helps keep your maps cleaner, more focused, and easier to maintain.

<figure><img src="/files/JHoQriMXzb5ZtTkjbf7V" alt=""><figcaption></figcaption></figure>
{% endupdate %}

{% update date="2025-07-17" tags="new,workspace" %}

## Organization Governance Settings for Admins

Admins can now set up custom governance policies through the new **Governance** section in Settings. These controls give you the tools to manage data access, sharing, and feature usage across your organization with precision.

Control who can create new Data Warehouse connections with granular settings for providers and authentication methods. Manage connection sharing, disable the CARTO Data Warehouse, and fine-tune Builder features like Download PDF report, export viewport data, and more!

To see all the new settings, check our section on [Organization Governance](/carto-user-manual/settings/organization-governance).

<figure><img src="/files/Jg3tcZjENnmoqEQdnFI7" alt=""><figcaption></figcaption></figure>
{% endupdate %}

{% update date="2025-07-15" tags="improvement,builder" %}

## Support for Widgets linked to Raster sources in Builder

You can now use Widgets with raster sources in Builder — just like you already can with vector sources. This improvement allows for richer exploration and analysis of raster sources stored in your data warehouse directly from the map.

Use the Formula Widget to calculate metrics like tree coverage in your current view. Leverage Category and Pie Widgets to list distinct values in your raster layer, or use the Histogram Widget to explore data distributions such as precipitation.

These widgets can also be used for filtering, letting you interactively refine what’s shown on the map and extract insights more effectively.

[Learn more in our documentation](/carto-user-manual/maps/widgets).

<figure><img src="/files/XNpNZBROpGIAkTmCFmSu" alt=""><figcaption></figcaption></figure>
{% endupdate %}

{% update date="2025-07-08" tags="new,workspace" %}

## Audit all queries with the CARTO SQL audit trails

When a map or workflow is opened, CARTO launches a set of SQL queries to your data warehouse to visualize your data and run your analysis. And from now on, each of those SQL queries will contain a **rich audit trail** in the form of SQL comments at the beginning or the end of the query.

This audit information allows data warehouse administrators to monitor CARTO and answer questions such as: *How many queries did CARTO run in a period of time? Which workflows or maps have processed more data? What are some common performance or cost patterns?*

To start using this information in your audits, check our [Auditing SQL queries documentation](/carto-user-manual/connections/auditing-sql-queries-from-carto).

<figure><img src="/files/ZPdrptGwZZ3P4rQayusk" alt=""><figcaption></figcaption></figure>
{% endupdate %}
{% endupdates %}


# Q2 2025

New features and improvements introduced from April to June 2025

{% updates %}
{% update date="2025-06-30" tags="improvement,workflows" %}

## Collaborative edition in Workflows

Workflows now supports [**collaborative editing**](/carto-user-manual/workflows/sharing-workflows#editor-collaboration) for teams. Editors can share workflows with their entire organization, SSO groups, or specific users to enable collaborative development.

This feature eliminates the need to duplicate workflows for minor changes, ensuring teams work from a single, consistent source of truth. Asynchronous editing with a request/approval model reduces conflicts while supporting smooth, coordinated teamwork.

Editor collaboration makes it easier for organizations to use Workflows at scale and promotes more frequent, effective use across teams.

{% embed url="<https://vimeo.com/1097574791?autoplay=1&share=copy>" %}
{% endupdate %}

{% update date="2025-06-25" tags="new,builder" %}

## Cross-filtering multiple data sources from map widgets

You can now use a **single widget to filter multiple sources** in your Builder map as long as they share the same field.

Previously, widgets could only filter a single source. Now, widgets like Category or Time Series will update multiple sources and their related elements (like other widgets or layers) when the filtering property matches.

This is especially useful when working with complementary datasets. For example, filtering both sales and demographic data by region to uncover richer insights.

Learn more in our [Widget Behavior](/carto-user-manual/maps/widgets#widget-behavior) section of the documentation.

<figure><img src="/files/qD8fir2ImxFcVyTZOBt0" alt=""><figcaption></figcaption></figure>
{% endupdate %}

{% update date="2025-06-19" tags="improvement,builder,carto-for-developers" %}

## Custom aggregation support on Category, Pie and Time Series Widget

You can now define **custom aggregation** operations directly in [**Category**](/carto-user-manual/maps/widgets/category-widget), [**Pie**](/carto-user-manual/maps/widgets/pie-widget), and [**Time Series**](/carto-user-manual/maps/widgets/time-series-widget) widgets, previously only available in Formula widgets.

This enhancement enables more advanced use cases by allowing tailored **SQL expressions** within the widget configuration, giving users greater control over how insights are calculated and displayed.

Custom aggregations are supported in both **CARTO Builder** and the **CARTO Developer framework** for programmatically creating widgets.\
\
Learn more in the [Widget*s*](/carto-user-manual/maps/widgets) section of Builder or the CARTO for Developers [technical reference](/carto-for-developers/reference/carto-widgets-reference).

<figure><img src="/files/Um4iWEta151l29u0uJPb" alt=""><figcaption></figcaption></figure>
{% endupdate %}

{% update date="2025-05-30" tags="improvement,carto-for-developers" %}

## Integrate CARTO Builder maps at scale in your custom applications using fetchMap

Developers have now access to an extended set of tools to bring maps from CARTO Builder into their applications, **allowing collaboration with non-developer users** who can be in charge of the cartography, or simply, accelerating the styling process of layers. Key points are:

* Non-developers can prototype and build [maps in Builder](/carto-user-manual/maps) as usual.
* Developers use `fetchMap` to retrieve maps from CARTO into their code.
* The map properties can then be integrated and customized, to perfectly blend in your application. This includes **layers, legend,** and **interactions** (tooltips, popups, hover...).
* Works with private and public maps.

Learn more about the improvements to fetchMap in our [technical reference](/carto-for-developers/reference/fetchmap), or check [how we built our example](/carto-for-developers/examples#fetchmap).

{% embed url="<https://vimeo.com/1088837980?share=copy>" %}
{% endupdate %}

{% update date="2025-05-29" tags="new,workspace" %}

## Support for sharing maps with Guest viewers

We've introduced a new user role, [**Guest viewer**](/carto-user-manual/settings/users-and-groups/managing-user-roles#guest-viewers), designed for organizations that want to share maps with external partners, clients or collaborators.

Users with this new role can only see the maps that have been explicitly shared with them, which improves collaboration with external users as it removes the need to make sensitive maps public. As these are authenticated users, Editors can grant or revoke Guest viewer access to any map at any point, while Admins can view a complete audit trail of their activity.

For more information, head to our section on [Guest viewers](/carto-user-manual/settings/users-and-groups/managing-user-roles#guest-viewers).

<figure><img src="/files/umRrHgqwnRAWDl7Hnq8d" alt=""><figcaption></figcaption></figure>
{% endupdate %}

{% update date="2025-05-26" tags="new,workflows,analytics-toolbox" %}

## **Routing Matrix support in the Analytics Toolbox, Workflows, and LDS API**

CARTO now supports computing **travel time and distance origin–destination matrices** using third-party APIs from TravelTime and TomTom. New functions in the Analytics Toolbox allow users to build routing matrices with full control over input parameters, enabling accurate and optimized travel time analysis.

This capability is also available through a new component in Workflows, providing a low-code way to integrate travel time data into broader spatial processes. A new endpoint in the **Location Data Services (LDS) API** has been introduced to support this functionality across the Analytics Toolbox and Workflows, ensuring robust and scalable access to routing services.

The new functions and components are available in [Workflows](/carto-user-manual/workflows/components/spatial-constructors#create-routing-matrix) and the Analytics Toolbox for [BigQuery](/data-and-analysis/analytics-toolbox-for-bigquery/sql-reference/lds#create_routing_matrix), [Snowflake](/data-and-analysis/analytics-toolbox-for-snowflake/sql-reference/lds#create_routing_matrix) and [Redshift](/data-and-analysis/analytics-toolbox-for-redshift/sql-reference/lds#create_routing_matrix).

{% embed url="<https://player.vimeo.com/video/1087758614?autoplay=1>" %}
{% endupdate %}

{% update date="2025-05-13" tags="new,builder" %}

## Enhanced collaboration with User Comments now available in Builder

You can now collaborate directly in your Builder maps using **Comments**. Add notes tied to specific locations, start threaded discussions, and tag teammates to bring everyone into the conversation—right where decisions are made.

Built for collaboration, Comments help reduce back-and-forth, speed up decision-making, and turn your maps into **collaborative mapping experiences**.

Ready to start? Check our [documentation](/carto-user-manual/maps/sharing-and-collaboration/comments) to learn more.

<figure><img src="/files/aT1VMbeozgM4fyagZltm" alt=""><figcaption></figcaption></figure>
{% endupdate %}

{% update date="2025-05-12" tags="new,workflows" %}

## Automate the creation of maps with the new Create Builder Map component in Workflows

A new component is now available in CARTO Workflows to automate the creation and update of Builder maps. With support for three modes—**Create copy**, **Overwrite**, and **Update**—this component gives users full control over how maps are generated and maintained as part of a workflow.

This functionality allows users to integrate map generation into larger geospatial processes, ensuring that maps stay up to date with the latest analytical results. Whether you're building templated workflows, maintaining a dashboard, or running scheduled processes, this component helps reduce manual steps and ensures consistency across your visual outputs.

Check the [documentation](/carto-user-manual/workflows/components/input-output#create-builder-map) to get started.

{% embed url="<https://vimeo.com/1083589811?autoplay=1&share=copy>" %}
{% endupdate %}

{% update date="2025-04-03" tags="new,carto-for-developers" %}

## New developer framework-agnostic widgets for Tileset and Raster sources

Developers building custom, scalable geospatial apps with CARTO can now add custom charts and widgets on top of their **tileset** and **raster** sources, enriching their application with additional GPU-powered **filtering** capabilities. These widgets have the same features as all our developer widgets:

* **Fully-customizable:** using flexible data models and your own UI charting library.
* **Easily sync your widgets** with the deck.gl map, and seamlessly use widgets to **filter**.
* **Framework-agnostic, with minimal dependencies:** built with pure JS and Typescript, it integrates nicely in your own stack (Angular, React, Vue...).

Use cases include land use treemap charts, NDVI average scorecards, or frequency histograms over huge tilesets with millions of points, and everything in between... Get creative!

Ready to get started? Check the [technical reference](/carto-for-developers/reference/carto-widgets-reference) or play with our [examples](/carto-for-developers/examples)!

<figure><img src="/files/brsrY3i3qszkw5KLNjlB" alt=""><figcaption></figcaption></figure>
{% endupdate %}

{% update date="2025-04-03" tags="improvement,workspace" %}

## View all assets in your organization with the new Superadmin role

We have introduced a new user role –[Superadmin](/carto-user-manual/settings/users-and-groups/managing-user-roles#superadmin)– capable of viewing and managing all assets (Maps, Workflows and Connections) in the organization, regardless of who owns them or their visibility settings. This new role will help facilitate the administration and governance of large organizations with many users and many assets:

* Delete and transfer assets in bulk
* Filter assets by owner
* View detailed asset relationships, such as the Connection used by a Workflow.

For more information, see our section on the [Superadmin role](/carto-user-manual/settings/users-and-groups/managing-user-roles#superadmin-role).

<figure><img src="/files/nkARXQaTkuO7t8Ra6g6I" alt=""><figcaption></figcaption></figure>
{% endupdate %}
{% endupdates %}


# Q1 2025

New features and improvements introduced from January to March 2025

{% updates %}
{% update date="2025-03-19" tags="improvement,builder" %}

## Control layer presence in Builder’s map layer list

Editor users can now manage the presence of a layer in the map layer list directly from the [Legend](/carto-user-manual/maps/legend) tab in Builder. Previously, it was only possible to show or hide a layer’s legend. With this update, you now have full control over whether a layer itself should appear in the map layer list — what end-users see and interact with during map exploration.

<figure><img src="/files/BhTPficjkDEoWqLpXXoo" alt=""><figcaption></figcaption></figure>
{% endupdate %}

{% update date="2025-03-19" tags="new,carto-for-developers" %}

## Manage your maps, workflows, and connections at scale with our new Resources APIs

As organizations expand their usage of CARTO and *break the GIS data silo* using cloud-native maps and workflows, it becomes important to have the right tools to manage all resources at scale. This is why, starting today, all users in CARTO have access to a **new set of API endpoints where they can programmatically list and delete their maps, workflows, and connections**.

Additionally, to empower *Superadmins* on their journey to enable CARTO for large organizations, we're exposing the following functionality via the new APIs:

* List all the maps, workflows, and connections in a CARTO organization
* Bulk delete of multiple assets with a single API request
* Transfer the ownership of an asset (map, workflow, or connection) to another user

Ready to scale up? Head over to our [API reference](https://api-docs.carto.com) to get started.

<figure><img src="/files/qWPkpbKmEAZSfNd6iEkP" alt=""><figcaption></figcaption></figure>
{% endupdate %}

{% update date="2025-03-13" tags="new,workspace" %}

## Connect to Databricks using OAuth authentication

Users can now connect to their Databricks account using OAuth authentication, with both Machine-to-Machine (M2M) and User-to-Machine (U2M) authentication flows supported! This adds an extra layer of security for Databricks users since OAuth tokens are automatically refreshed by default and do not require the direct management of the access token. For these reasons, Databricks is strongly recommending its users to choose OAuth over Personal Access Tokens.

Want to learn more? head over to our [section on Databricks connections](/carto-user-manual/connections/databricks).

<figure><img src="/files/K0e6UviDp3xxYjQD2bCK" alt=""><figcaption></figcaption></figure>
{% endupdate %}

{% update date="2025-02-27" tags="new,builder" %}

## Visualize rasters in Builder, directly from your data warehouse

Raster visualization is now available in Builder, marking a major milestone in CARTO’s end-to-end support for raster data. With this release, you can seamlessly import, analyze, and visualize raster datasets stored in Google BigQuery and Snowflake—all within CARTO.

This new capability unlocks powerful use cases, allowing you to explore and analyze data at scale, seamlessly within your cloud environment, without additional data movement. Interesting in learning more? [Check our documentation](/carto-user-manual/maps/layers/raster).

<figure><img src="/files/IETG45eP7hllBvRXyCEi" alt=""><figcaption></figcaption></figure>
{% endupdate %}

{% update date="2025-02-20" tags="new,builder" %}

## Introducing AI Agents for maps - now available in Public Preview

We’re excited to announce the Public Preview of CARTO [AI Agents](/carto-user-manual/ai-agents), designed to make interacting with your maps in Builder more intuitive and dynamic. With AI Agents, users can seamlessly zoom to specific regions based on conversational input, explore map details, and apply filters using widgets—all through a natural language interface.

✨ Stay tuned—this is just the beginning. We’re already working on making AI Agents faster, smarter, and more powerful to elevate your mapping experience even further.

<figure><img src="/files/oVAcmr0bhNNVc5JCK7P4" alt=""><figcaption></figcaption></figure>
{% endupdate %}

{% update date="2025-02-18" tags="new,workflows" %}

## Expanding CARTO for Databricks: Location Data Services & Data Enrichment

We’re introducing **Location Data Services (LDS) support** and **new data enrichment components** in **CARTO for Databricks**, enabling more seamless geospatial analysis across different user roles and workflows.

* **Location Data Services (LDS) Support**: Now available in both the [**Analytics Toolbox for Databricks**](/data-and-analysis/analytics-toolbox-for-databricks) and as **Workflows components**.\
  Users can perform [**geocoding**](/carto-user-manual/workflows/components/spatial-constructors#st-geocode)**,** [**routing**](/carto-user-manual/workflows/components/spatial-constructors#create-routes)**, and** [**isoline**](/carto-user-manual/workflows/components/spatial-constructors#create-isolines) calculations via CARTO’s standard providers. The Analytics Toolbox enables direct use within **Databricks notebooks and SQL workflows**, while CARTO Workflows provides a **low-code interface**, integrating LDS into broader spatial analysis pipelines. LDS usage is subject to **CARTO licensing and quotas**, but users can also bring their own provider credentials, just as with other data warehouses.
* **Data Enrichment Components**: These new Workflows components simplify use cases like demographic enrichment, POI data integration, and trade area analysis. Users can enhance datasets with information from **CARTO’s Data Observatory** or their **own geospatial sources**, whether structured as **spatial indexes, points, or polygons**. By embedding enrichment within **CARTO Workflows**, users can more easily integrate this step into their existing analysis.

These updates further **reduce complexity** for Databricks users working with spatial data. Data scientists can leverage LDS functions directly within their Databricks environment, while Workflows opens up more advanced spatial analysis to less technical users. By bringing LDS and enrichment into CARTO Workflows, we make it easier to build complete geospatial pipelines without writing custom code.

{% embed url="<https://vimeo.com/1057936039>" %}
{% endupdate %}

{% update date="2025-02-06" tags="new,integrations" %}

## Bringing cloud-native spatial analytics to your desktop GIS with the new CARTO QGIS Plugin

The new [CARTO QGIS Plugin](/data-and-analysis/carto-qgis-plugin) allows you to access, visualize, and edit spatial data from leading cloud data warehouses directly within QGIS. With this plugin, you can seamlessly check out data from Google BigQuery, Snowflake, Databricks, AWS Redshift, and PostgreSQL, edit it within QGIS, and commit changes back to your data warehouse—all powered by the CARTO platform.

Simply connect your cloud data warehouse to CARTO, install the QGIS plugin, and gain full control over your geospatial data in a familiar GIS environment. This enables smooth workflows for spatial data management, enrichment, and analysis while ensuring your data remains centralized and up to date in your cloud ecosystem.

<figure><img src="/files/jZQ6B9hLLw9LPYHhejvb" alt=""><figcaption></figcaption></figure>
{% endupdate %}

{% update date="2025-02-03" tags="new,workspace" %}

## Connect to Snowflake using Key-pair authentication

Snowflake users can now connect to their Data Warehouse using **Key-pair authentication**! This is a much more secure alternative to basic username/password authentication as it is highly resistant to brute-force attacks, eliminates password management complexities, and can be easily used as the authentication mechanism for scripts and applications.

We've also added support for Key-pair rotation, enabling users to update the private key of Key-pair connections they own. For more information, see our section on [Key-pair authentication for Snowflake connections](/carto-user-manual/connections/snowflake#connecting-to-snowflake-using-key-pair-authentication).

<figure><img src="/files/ux3Xu2fhHYEQIzVUETrR" alt=""><figcaption></figcaption></figure>
{% endupdate %}

{% update date="2025-01-30" tags="new,builder" %}

## Support for aggregating data sources by identical geometries in Builder

Are you working with datasets where multiple rows share the same geometry but have varying attributes, such as administrative boundaries, roads, or infrastructure locations?

The new [aggregate by geometry](/carto-user-manual/maps/layers#aggregate-by-geometry) functionality allows you to aggregate those features in your layer visualization and interactions, improving performance while keeping access to detailed insights.

With this update, you can:

* Aggregate geometries in your layer to ensure optimal performance.
* Aggregate styling and interaction attributes to retrieve relevant information linked to your aggregated feature.
* Maintain widget functionality over the original source, enabling drill-down operations for deeper analysis.

<figure><img src="/files/RdXhNKX0C2XsZYRHIL4x" alt=""><figcaption></figcaption></figure>
{% endupdate %}

{% update date="2025-01-30" tags="new,workflows" %}

## Expand and tailor Workflows functionality with Extension Packages

With this new release, users and partners can now extend the capabilities of our low-code analytics tool CARTO Workflows by creating, integrating and distributing custom components tailored to their specific spatial analytics needs.

To start creating your own Workflows Extension Packages we have published [this public GitHub template](https://github.com/CartoDB/workflows-extension-template). Kick off your own repository out the template and start developing extensions for BigQuery and Snowflake connections.

Additionally, we have published a set of extensions readily available to be installed from the Workflows UI. The initial release boasts a curated collection of extensions, including:

* [**BigQuery ML**](/carto-user-manual/workflows/components/bigquery-ml)**:** Integrate machine learning workflows with your geospatial data using BigQuery ML directly within Workflows.
* [**Google Earth Engine**](/carto-user-manual/workflows/components/google-earth-engine)**:** Unleash the power of Google Earth Engine for advanced spatial analysis tasks.
* [**Google Environment APIs**](/carto-user-manual/workflows/components/google-environment-apis)**:** Bring the power of Google Environment APIs (Solar, Air Quality, Pollen) into your geospatial analytics workflows.
* [**Telco Signal Propagation Models**](/carto-user-manual/workflows/components/telco-signal-propagation-models)**:** Analyze telecommunication signals with path profiles, propagation modeling, and obstacle identification.

Head over to the CARTO Workflows documentation to learn more about [Extension Packages](/carto-user-manual/workflows/extension-packages) and explore the initial release offerings.

<figure><img src="/files/1Bm9mj54fnuMucVcc4lM" alt=""><figcaption></figcaption></figure>
{% endupdate %}

{% update date="2025-01-17" tags="new,workspace" %}

## Support for sharing maps with specific users

We've introduced the ability to share maps with individual users! Previously, maps could only be shared with the entire organization, specific user groups, or made publicly accessible via a link.

With this new feature, Editors now have more granular control over map access permissions. Users can select exactly which individuals should have access to a map (and they can revoke it at any time), making it easier to collaborate on specific projects while maintaining security. For more information, see our section on [publishing and sharing maps](/carto-user-manual/maps/sharing-and-collaboration).

<figure><img src="/files/v2a7GiQmphFfWZaOJ1Al" alt=""><figcaption></figcaption></figure>
{% endupdate %}

{% update date="2025-01-10" tags="new,workspace" %}

## Connect CARTO and Google BigQuery using Workload Identity Federation

We’re excited to announce that CARTO now supports connecting to Google BigQuery via **Workload Identity Federation**! This new capability enables secure, seamless authentication without requiring service account keys, making it easier to manage access and improving security for your cloud-native maps, workflows and applications.

With Workload Identity Federation, you can set up a trust relationship between CARTO and your Google Cloud projects for a smooth integration — In other words, you will be managing permissions to each of your CARTO users directly in Google Cloud, using IAM rules.

Another benefit of this method is that it provides a framework to effortlessly scale and distribute granular permissions across large-scale teams using CARTO and BigQuery. To get started:

* Administrators will need to set up an [integration to configure Workload Identity Federation in CARTO](/carto-user-manual/settings/advanced-settings/workload-identity-federation).
* Once the integration is set up, all users will be able to [use Workload Identity Federation when connecting CARTO and BigQuery](/carto-user-manual/connections/bigquery#using-workload-identity-federation).

<figure><img src="/files/r5V8TFRv1Exgmkln91EQ" alt=""><figcaption></figcaption></figure>
{% endupdate %}

{% update date="2025-01-07" tags="improvement,carto-for-developers" %}

## Develop completely custom widgets powered by H3 and Quadbin spatial index-based sources

A few months ago we introduced our [framework-agnostic widgets](/whats-new/q4-2024#new-framework-agnostic-widgets-in-carto-for-developers), a new system for developers to add scalable and highly-performant charts and other data components to their CARTO + deck.gl application, with support for vector-based data sources: *points*, *lines* and *polygons*.

Today, we're extremely happy to announce that developers can now build completely custom widgets using **spatial index sources** as well. These sources aggregate the data in a spatial index system, such as **H3** or **Quadbin,** for increased performance and scalability. The main benefits of the new framework-agnostic widgets apply to spatial index-based widgets as well:

* Build anything using H3 and Quadbin sources: from scorecards to bar charts, tables, time series, and everything in between.
* Bring your own UI: Use your favorite charting library or custom HTML components.
* Easily sync your widgets with the deck.gl map.
* Seamlessly use widgets to filter the map and other widgets, fully leveraging your cloud data warehouse computing power.
* Built using JS and Typescript only, they are fully compatible with the framework of your choice (Angular, React, Vue...), adding minimal dependencies.

Ready to learn more? Get started by reading the [technical reference](/carto-for-developers/reference/carto-widgets-reference) or by exploring the [examples](/carto-for-developers/examples).

<figure><img src="/files/QO2ipJ6EwNV6JkrGEIoM" alt=""><figcaption></figcaption></figure>
{% endupdate %}
{% endupdates %}


# Q4 2024

New features and improvements introduced from October to December 2024

{% updates %}
{% update date="2024-12-13" tags="improvement,workspace" %}

## Improved SSO group management

We've introduced several improvements to help Admins of organizations using SSO groups manage them more effectively. Admins can now view the composition of groups, search for specific users within them, and delete unused groups. Additionally, we've implemented a new method to synchronize only a subset of groups into CARTO. For more details, visit our article on [SSO Groups](/carto-user-manual/settings/users-and-groups/managing-user-groups).

<figure><img src="/files/xZI8cMaoIY310JTWOzeR" alt=""><figcaption></figcaption></figure>
{% endupdate %}

{% update date="2024-12-04" tags="improvement,data-observatory" %}

## Discover spatial data like never before: Meet the new Data Observatory Catalog!

We’re thrilled to announce a major update to the CARTO Data Observatory catalog! The new version introduces a completely redesigned interface, making it easier than ever to browse and discover spatial datasets. Whether you're searching for demographic insights, mobility or environmental data, the improved catalog helps you navigate a vast array of options with greater clarity and efficiency.

In addition to the new design, the updated catalog now includes richer metadata for each dataset. You can access detailed descriptions, links to product documentation, Frequently Asked Questions, and relevant use-cases for each product, enabling more informed decision-making when assessing external datasets to enrich your geospatial analysis.

[Log in](https://app.carto.com/) today to explore the new Data Observatory catalog and unlock the full potential of your projects! Access more information about the Data Observatory in our [product documentation](/carto-user-manual/data-observatory).

<figure><img src="/files/bTfBVfdLIt8qpj7vjGEs" alt=""><figcaption></figcaption></figure>
{% endupdate %}

{% update date="2024-11-24" tags="new,carto-for-developers" %}

## Avoid exposing SQL in your CARTO applications with Named Sources

There are no trade-offs between simplicity, flexibility and security: developers using CARTO can now use Named Sources to avoid exposing the SQL queries used under the hood in their applications, and without necessarily having to add additional backend or proxy services.

Developers can manage their Named Sources manually via UI or programmatically via API. To get started with Named Sources, check the [documentation](/carto-user-manual/developers/named-sources) and the [developer guides](/carto-for-developers/guides/avoid-exposing-sql-queries-with-named-sources).

<figure><img src="/files/rxK1tWFUOFbIRcAtpSTm" alt=""><figcaption></figcaption></figure>
{% endupdate %}

{% update date="2024-11-21" tags="new,deployment-methods" %}

## Fully deploy CARTO within Snowflake using Container Services

You can now deploy your own instance of CARTO fully inside of Snowflake, as a Native App using Snowflake-maaged Container Services.

From additional security benefits (from a closed environment within Snowflake) to streamlined installation, there are multiple reasons to be excited about this new deployment method, currently in BETA for specific customers.

Learn more about [deploying CARTO within Snowflake using Container Services](/carto-native-app-for-snowflake-containers/deploying-carto-using-snowflake-container-services) in our documentation or read about it in our [blog post](https://carto.com/blog/product-announcement-deploy-the-carto-platform-inside-snowflake).

<figure><img src="/files/NmtFHFuOMJ5ZujbgknYJ" alt=""><figcaption></figcaption></figure>
{% endupdate %}

{% update date="2024-11-21" tags="new,builder" %}

## Seamless data source switching in Builder maps

Builder users can now modify the location or connection of data sources directly in Builder without breaking the map configuration. This ensures that maps retain their overall configuration, as long as the fields in the updated data source have the same name and type.

For map components such as style properties, widgets, or interactions that rely on properties not found in the updated data source, the configuration will gracefully fall back to its default settings, ensuring the map remains functional.

This functionality allows users to repurpose their maps effortlessly, even when the data source location in their data warehouse changes—eliminating the need to recreate maps from scratch.\
\
[Learn more in our documentation.](/carto-user-manual/maps/data-sources/changing-data-source-location)

<figure><img src="/files/ZaE59CGiZ0QUrbWufml2" alt=""><figcaption></figcaption></figure>
{% endupdate %}

{% update date="2024-11-11" tags="new,builder" %}

## Reusable custom color palettes in Builder

Admin users can now define custom color palettes for their CARTO organization, removing the need to manually add custom color styling in each new Builder map individually. This is a quick and easy way to apply styles consistently across various maps, available to all Editors within an organization.

Custom color palettes can be created from the Settings and are applied directly in CARTO Builder. For more information, see our article on [**creating and applying custom color palettes**](/carto-user-manual/settings/customizations/configuring-custom-color-palettes).

<figure><img src="/files/oyQ2lGZMmkU3cTjVGo2c" alt=""><figcaption></figcaption></figure>
{% endupdate %}

{% update date="2024-10-31" tags="new,workflows" %}

## Databricks support for CARTO Workflows

We are thrilled to announce that CARTO Workflows now supports direct connections to Databricks, significantly enhancing our integration capabilities for the Databricks platform. This new feature empowers Databricks' vast community of data engineers, data scientists, and analysts to seamlessly perform geospatial analysis within CARTO Workflows.

This release caps off a series of Databricks-focused updates rolled out over recent months:

* We have introduced support for SQL Warehouses and Unity Catalog in [CARTO connections](/carto-user-manual/connections/databricks).
* Made Databricks connections available in [Builder and other maps](/carto-user-manual/maps/data-sources/simple-features) across the platform, as well as geospatial applications developed with CARTO.
* Enabled [table preparation](/carto-user-manual/maps/performance-considerations#tiles-postgresql) and [tileset creation](/data-and-analysis/analytics-toolbox-for-databricks/reference/legacy/tiler) for high-performance visualizations.

Workflows for Databricks leverages [Databricks Spatial SQL](https://carto.com/blog/enhancing-geospatial-analytics-with-carto-databricks), [Apache Sedona](https://sedona.apache.org/latest/) and the[ CARTO Analytics Toolbox](https://docs.carto.com/data-and-analysis/analytics-toolbox-for-databricks) to make geospatial analysis easier and more performant than ever for data scientists, engineers and analysts on Databricks. Being a cloud-native integration, CARTO pushes down all processing to Databricks, profiting from the massive computation capabilities.

By embedding these tools directly in Databricks, we are breaking down the geospatial data silo, making geospatial insights more accessible and actionable for enterprise teams.

<figure><img src="/files/i7qidtrhxUVJbfSghrP3" alt=""><figcaption></figcaption></figure>
{% endupdate %}

{% update date="2024-10-17" tags="improvement,builder" %}

## Search, highlight and zoom with Builder's Table widget

Navigating large geospatial datasets is now faster with our upgraded [Table Widget](/carto-user-manual/maps/widgets/table-widget), featuring **search**, **highlight**, and **zoom** capabilities.

You can now easily **search** for specific features within the Table Widget, making them quick to locate. **Hover** over a table row to instantly **highlight** the corresponding feature on the map, and with a click, the map will automatically **zoom** to and center on that feature.

We’ve also improved the widget’s configuration, allowing you to label, format, and reorder columns without altering your data source. \\

<figure><img src="/files/1bcMClPcYNlpowt9kUr2" alt=""><figcaption></figcaption></figure>
{% endupdate %}

{% update date="2024-10-15" tags="new,builder" %}

## New basemap selector in Builder

Many times, a single basemap doesn't fully meet all of your mapping needs. Now, with the new [basemap selector](/carto-user-manual/maps/basemaps/basemap-selector) in Builder, users can easily switch between different basemaps available in your organization. This feature allows you to tailor the visual context of your maps to specific use cases, enhancing the overall data exploration experience.

<figure><img src="/files/zuex1VAAfGkaoRz1J6QN" alt=""><figcaption></figcaption></figure>
{% endupdate %}

{% update date="2024-10-14" tags="new,builder,carto-for-developers" %}

## Elevate your point visualizations with the new `_carto_point_density` property

We’ve added a new styling property, `_carto_point_density`, for point dynamic tiling sources, perfect for visualizing point density. You can use this property in Builder or your custom apps to style your points by radius, fill, or stroke color, making your maps more insightful and visually appealing. Learn more about it in our [documentation](/carto-user-manual/maps/layers/point#using-_carto_point_density-attribute).

<figure><img src="/files/DYrrj15yd5ynIn0GyFqA" alt=""><figcaption></figcaption></figure>
{% endupdate %}

{% update date="2024-10-09" tags="new,carto-for-developers" %}

## New framework-agnostic widgets in CARTO for Developers

Developers using CARTO + deck.gl are scaling and accelerating their geospatial apps with powerful layers, using live data from their cloud data warehouse. **Now, they can also add scalable, interactive charts and widgets to their geospatial applications.**

This is what we love about the new [CARTO Widgets](/carto-for-developers/key-concepts/charts-and-widgets):

* Use flexible and scalable data models to achieve exactly and quickly what you need: From scorecards to bar charts, tables, time series, and everything in between.
* Bring your own UI: Use your favorite charting library or custom HTML components.
* Easily sync your widgets with the deck.gl map.
* Seamlessly use widgets to filter the map and other widgets, fully leveraging your cloud data warehouse computing power.
* Built with JS and Typescript, they are fully compatible with the framework of your choice (Angular, React, Vue...), adding minimal dependencies.

**We're excited to see what you build!** — To get started, head over to the [technical documentation](/carto-for-developers/key-concepts/charts-and-widgets) or check the [**new examples for CARTO Widgets**](/carto-for-developers/examples).

<figure><img src="/files/r0DrWWxiWMlqQb2U7iym" alt=""><figcaption></figcaption></figure>
{% endupdate %}

{% update date="2024-10-07" tags="new,builder" %}

## Dynamic aggregation of point layer into clusters

We've introduced a new functionality in Builder to dynamically visualize your point data as **clusters**, helping you gain deeper insights and uncover trends more effectively.

By aggregating point data into clustering, you can:

* **Reduce Visual Clutter**: Automatically group nearby points into clusters as you zoom out, helping you maintain clarity and readability, even with dense datasets.
* **Enhanced Performance**: Clustering improves performance by reducing the number of individual features rendered, making it easier to handle large datasets without compromising speed.
* **Meaningful Aggregation**: See patterns emerge as points are grouped into clusters, helping you identify hotspots, trends, and areas of interest quickly and effectively.
* **Interactive Exploration**: As you zoom in and out, clusters dynamically adjust, revealing individual points as you get closer, giving you seamless interaction with your data at different scales.

<figure><img src="/files/uTa1S8gTxsZIVc6bItIt" alt=""><figcaption></figcaption></figure>
{% endupdate %}
{% endupdates %}


# Q3 2024

New features and improvements introduced from July to September 2024

{% updates %}
{% update date="2024-10-04" tags="new,workspace" %}

## Enforcing SSO for all users within an organization

We've introduced a new toggle in the settings that allows Admins to enforce SSO within their organization. When enabled, every single user in that organization will have to authenticate using Single Sign-On, regaldless of their role. Users that try to authenticate with other mechanisms, such as *User/Password* and *Google Account* will not be allowed to log in.

For more details, check out our section on [SSO](/carto-user-manual/settings/sso).

<figure><img src="/files/PrsfnnYzsLhViHbolBsH" alt=""><figcaption></figcaption></figure>
{% endupdate %}

{% update date="2024-09-26" tags="new,workflows" %}

## New Export Feature and Enhanced Security for Workflows

We’re pleased to introduce several updates to **Workflows** designed to improve both functionality and security:

**Export Data from Any Node**

A new [**Export**](https://docs.carto.com/carto-user-manual/workflows/results-panel#export-nodes-data) button is now available on the Data tab for every executed node in your workflow canvas, allowing you to export data directly. This asynchronous export process can be tracked via the Activity Panel, similar to how [exports are managed in **Builder**](/carto-user-manual/maps/exporting-data#exporting-data-as-an-editor).

**Enhanced Security for Enterprise-Ready Components**

In line with our ongoing platform-wide security initiative, we've implemented the following updates:

* [**Send by Email**](/carto-user-manual/workflows/components/input-output#save-as-table) now works without requiring attached data, offering more flexibility in workflow automation.
* You can now specify a **custom bucket location** when using the **Send by Email** component, giving you control over where your data is sent.
* [**Export to Bucket**](/carto-user-manual/workflows/components/input-output#export-to-bucket) no longer uses public buckets. Users are now required to specify their own **bucket locations**, ensuring more secure data management.

These updates make **Workflows** an even more powerful tool for enterprise users while maintaining a focus on security and ease of use.

<figure><img src="/files/pLPMSKiBSThQTHu7rwcO" alt=""><figcaption></figcaption></figure>
{% endupdate %}

{% update date="2024-09-11" tags="new,workspace" %}

## Require Viewer Credentials for Snowflake OAuth connections

Users can now require viewer credentials for their Snowflake OAuth connections. When this option is enabled, anyone accessing data through the connection — whether they're consuming maps, running workflows, or using the data explorer — will need to authenticate with their own credentials.

This ensures that security policies set in the database, such as Row-Level Security, are enforced. For more details, visit our section on [Sharing connections](/carto-user-manual/connections/sharing-a-connection).

<figure><img src="/files/N8I6Yxth1NCmBdCQcTAx" alt=""><figcaption></figcaption></figure>
{% endupdate %}

{% update date="2024-08-30" tags="new,workspace" %}

## Monitor what's happening in your CARTO organization with the new Activity Data

As organizations roll out CARTO to different teams and larger groups of users, it becomes increasingly important **for administrators to understand and monitor how their organization is using CARTO,** and this is now easy, powerful and flexible thanks to the **new** [**CARTO Activity Data**](/carto-user-manual/settings/activity-data) **feature**

Administrator can now easily export (manually or programmatically via API) a comprehensive data collection of everything that happened within their CARTO organization.

The new Activity Data can be then analyzed to deeply understand things like:

* Basic engagement indicators: *weekly active users, workflows run per week*...
* Most used features: *most used workflow components...*
* Quota consumption: *who is consuming more quota and why*
* And many more insights about your CARTO organization

Want to get started? Head over to the [CARTO Activity Data](/carto-user-manual/settings/activity-data) documentation. Make sure to also check the full [Activity Data Reference](/carto-user-manual/settings/activity-data/activity-data-reference), as well as the [Examples](/carto-user-manual/settings/activity-data/activity-data-examples) where we share practical guides and SQL queries on how to analyze this data.

<figure><img src="/files/0HDUxidXiF1XZ5Abj7PA" alt=""><figcaption></figcaption></figure>
{% endupdate %}

{% update date="2024-07-31" tags="improvement,workspace" %}

## Improved asset ownership transfer

We've introduced an improved flow for transferring user assets (maps, workflows, connections, etc) when deleting a user or when downgrading an Editor/Admin to Viewer. From now on, Admins will be able to select the specific user that will receive the assets.

For more information, check our documentation on [Deleting users](/carto-user-manual/settings/users-and-groups/deleting-users) and [Managing user roles](/carto-user-manual/settings/users-and-groups/managing-user-roles).

<figure><img src="/files/D8eseO7uR8MK02Aguydg" alt=""><figcaption><p>Selecting the user that will inherit the assets of a deleted user</p></figcaption></figure>
{% endupdate %}

{% update date="2024-07-31" tags="new,builder" %}

## Dynamic aggregation of point layer into H3 cells

We've introduced a new functionality in Builder to dynamically visualize your point data as H3 aggregations, helping you gain deeper insights and uncover trends more effectively.

By aggregating point data, you can:

* **Simplify Complex Data**: Aggregate large volumes of point data into meaningful patterns and trends, making it easier to interpret and analyze.
* **Enhance Performance**: Improve rendering times and performance, especially with large datasets, by reducing the number of individual points displayed.
* **Identify Hotspots**: Quickly identify areas of high density or activity, helping you make data-driven decisions.
* **Visual Clarity**: Reduce visual clutter by grouping nearby points, providing a clearer and more informative map visualization.

Simply select this new visualization type and enjoy the benefits of aggregated data visualization, all with exceptional performance thanks to CARTO's native support for spatial indexes.

<figure><img src="/files/NWP2xtjcl7b180sipgYI" alt=""><figcaption></figcaption></figure>
{% endupdate %}

{% update date="2024-07-29" tags="new,builder" %}

## Enhanced layer panel and spatial source definition in Builder

We are excited to introduce an improved layer panel in Builder for configuring your layers. This update significantly enhances the UI and UX of this panel, making the experience of creating visualizations in Builder even more enjoyable and efficient.

The redesigned panel features a cleaner layout and includes a new 'Data' section at the top. In this new section, you can define the spatial definition of the source linked to your layer. This is especially useful if your source contains multiple spatial columns or if Builder cannot recognize the spatial column by default.

Learn more about the spatial definition of your sources [here](/carto-user-manual/maps/data-sources/defining-source-spatial-data). Also, explore our [updated documentation section](/carto-user-manual/maps/layers) for layers to get the most out of this update.

<figure><img src="/files/3DIAffZBEe5qBotTApSL" alt=""><figcaption></figcaption></figure>
{% endupdate %}

{% update date="2024-07-29" tags="new,workflows" %}

## Workflows Templates now available directly from Workspace

We are pleased to announce the integration of our [collection of Workflow templates](https://academy.carto.com/creating-workflows/workflow-templates) directly within the CARTO Workspace. This feature aims to streamline your workflow creation process, making it faster and more efficient to [access and utilize pre-built templates](/carto-user-manual/workflows#workflow-templates).

* **Integrated Collection**: Access a wide range of workflow templates hosted on the CARTO Academy website, now readily available in the CARTO Workspace.
* **Simplified Process**: Users no longer need to visit the Academy site to download and import templates. The new feature allows you to easily recreate templates by selecting ‘New Workflow > From template’ within the Workspace.
* **Enhanced Usability**: This integration ensures that all available templates can be accessed with just a few clicks, promoting best practices and facilitating quicker setup of workflows.

This feature is designed to ease the learning curve by providing immediate access to valuable workflow templates that illustrate both building blocks for common geospatial analytics and more complex use cases, like industry-specific analysis for Telco, Insurance, Retail and CPG, Out of Home advertising, etc

<figure><img src="/files/SEJdBGH3OCCOr5ImnDkj" alt=""><figcaption></figcaption></figure>
{% endupdate %}

{% update date="2024-07-19" tags="new,builder" %}

## Zoom to layer extent in Builder maps

We are excited to introduce the zoom to layer functionality in Builder, which allows you to easily zoom to the layer extent, providing an immediate view of your dataset. When layers are filtered by widgets or parameters, the zoom focuses on the filtered data, ensuring you see exactly what's relevant.

Additionally, we have incorporated a "Show only this/Show all layers" feature, allowing you to quickly toggle all layers on and off with a single action, especially useful for maps including multiple layers.

Whether you're exploring vast datasets or gathering insights on geospatially distributed features, these new features will ensure a better exploration experience!

Learn more about this feature in our [documentation](/carto-user-manual/maps/layers/zoom-to-layer).

<figure><img src="/files/RDDOkE07ezv04pC3LRYZ" alt=""><figcaption></figcaption></figure>
{% endupdate %}

{% update date="2024-07-15" tags="new,workflows" %}

## New Workflows Components for Creating Tilesets

We are excited to introduce a powerful new set of components in Workflows that significantly enhance your geospatial data processing capabilities. These components are designed to facilitate the creation of various types of tilesets, allowing for efficient visualization and analysis of large spatial datasets. Here are the key features:

**Create Vector Tileset**

Generate vector tilesets from point, line, or polygon tables, enabling smooth and interactive map experiences.

**Create Point Aggregation Tileset**

Aggregate point data along with their properties into tilesets, ideal for visualizing dense point data on maps.

**Create Quadbin Aggregation Tileset**

Generate tilesets by aggregating quadbin indices, providing a fast and scalable way to manage spatial hierarchies and visualize large datasets.

**Create H3 Aggregation Tileset**

Utilize H3 hexagonal indexing to create aggregated tilesets, perfect for detailed spatial analysis and representation.

These new components enable you to transform your spatial data into highly efficient and scalable tilesets, which can be seamlessly integrated into your mapping applications. For more detailed information on how to use these components, visit [our documentation](https://docs.carto.com/carto-user-manual/workflows/components/tileset-creation).

<figure><img src="/files/logGVnTYCAk8HuPAm91P" alt=""><figcaption></figcaption></figure>
{% endupdate %}
{% endupdates %}


# Q2 2024

New features and improvements introduced from April to June 2024

{% updates %}
{% update date="2024-06-28" tags="new,workspace" %}

## Support for organizing and filtering maps and workflows with tags

We are happy to announce a new system to allow users to classify and filter maps and workflows in the CARTO Workspace with tags. With this new feature, editor users will be able to create, apply and filter maps and workflows by tags, considerably improving the organization of assets within CARTO. With this new enhacement:

* You can create, apply and remove tags by editing the Map/Workflow properties from the Workspace.
* We have added a tag filter to the Workspace so you can filter by one or several tags.
* Once a tag filter is applied, you can copy the URL for sharing that Workspace view internally.
* Tags will be automatically removed when they are no longer applied to any map or workflow.

<figure><img src="/files/xPaW2k1j8EQsube9jwyk" alt=""><figcaption><p>Creating and applying a tag in the Maps Workspace</p></figcaption></figure>
{% endupdate %}

{% update date="2024-06-28" tags="new,analytics-toolbox" %}

## Network planning and coverage analysis for Telco with the Analytics Toolbox for BigQuery

We are thrilled to announce our new functions for line of sight and signal propagation analysis in the Analytics Toolbox for BigQuery. These new procedures, available in the [telco](https://docs.carto.com/data-and-analysis/analytics-toolbox-for-bigquery/sql-reference/telco) module, enable network planners to run **coverage analysis** natively within BigQuery. With this functions users can now assess the geographical areas where current or potential new network's signal is available and evaluate its quality.

This release includes procedures for:

* **Path profile** analysis to evaluate the **line of sight** and identify potential obstructions between two points;
* **Path loss** estimation of a signal as it propagates through an environment, with options for the [Close In](https://arxiv.org/pdf/1602.07533) and [Extended Hata models](https://www.itu.int/dms_pub/itu-r/opb/rep/R-REP-SM.2028-2-2017-PDF-E.pdf).

Learn more about these new features in our [documentation](https://docs.carto.com/data-and-analysis/analytics-toolbox-for-bigquery/sql-reference/telco), and start testing them by following our step-by-step [tutorial](https://academy.carto.com/advanced-spatial-analytics/spatial-analytics-for-bigquery/step-by-step-tutorials/analyzing-signal-coverage-with-line-of-sight-calculation-and-path-loss-estimation).

<figure><img src="/files/kj5sVI3ewrgoRu27NSKK" alt=""><figcaption></figcaption></figure>
{% endupdate %}

{% update date="2024-06-28" tags="new,analytics-toolbox" %}

## New space-time analysis capabilities in the Analytics Toolbox for BigQuery

We are excited to announce the addition of two new space-time analyses available in the [statistics](https://docs.carto.com/data-and-analysis/analytics-toolbox-for-bigquery/sql-reference/statistics) module of the Analytics Toolbox for BigQuery:

* [**Space-time hotspot classification**](https://docs.carto.com/data-and-analysis/analytics-toolbox-for-bigquery/sql-reference/statistics#spacetime_hotspots_classification)**,** to classify hotspots based on changes in their intensity over time, such as strengthening hotspots, declining hotspots, occasional hotspots, and more;
* [**Time-series clustering**](https://docs.carto.com/data-and-analysis/analytics-toolbox-for-bigquery/sql-reference/statistics#time_series_clustering)**,** to identify locations with similar temporal behaviors.

Learn more on how to perform these spatiotemporal analyses by exploring our tutorials for [space-time hotspot classification](https://academy.carto.com/advanced-spatial-analytics/spatial-analytics-for-bigquery/step-by-step-tutorials/spacetime-hotspot-classification-understanding-collision-patterns) and [time-series clustering](https://academy.carto.com/advanced-spatial-analytics/spatial-analytics-for-bigquery/step-by-step-tutorials/time-series-clustering-identifying-areas-with-similar-traffic-accident-patterns).

<figure><img src="/files/EBArZloUSDAMowQv7Zly" alt=""><figcaption></figcaption></figure>
{% endupdate %}

{% update date="2024-06-20" tags="new,builder,carto-for-developers" %}

## Heatmap visualizations at scale for massive point-based data

We are thrilled to announce density heatmap visualization for vast point datasets! This new feature allows you to render large point datasets as a heatmap in a scalable and performant manner. Available now in **Builder**, you can easily identify hotspot patterns and gain insights from your data.

Developers can also build their own large-scale heatmaps in their apps using **CARTO + deck.gl**, with the new `heatmapTileLayer` (Experimental). Learn more from our [documentation](https://deck.gl/docs/api-reference/carto/heatmap-tile-layer) and [examples](https://github.com/CartoDB/deck.gl-examples/tree/master/dynamic-tiling-heatmap).

<figure><img src="/files/dlgjQOIS7IfbKsGNmyQw" alt=""><figcaption></figcaption></figure>
{% endupdate %}

{% update date="2024-06-19" tags="new,workflows" %}

## Improved Data Importing Capabilities in Workflows

We are excited to introduce enhanced data importing capabilities in CARTO Workflows. This new release includes a variety of features designed to simplify and expand the ways you can import data into your workflows, providing greater flexibility and functionality.

**New Features:**

**Import from URL Component**

* This [**new component**](/carto-user-manual/workflows/components/input-output#import-from-url) allows users to import data directly from a public URL. It is compatible with BigQuery, Snowflake, Redshift, and PostgreSQL. By leveraging the CARTO Import API, this component ensures seamless data integration across different database systems.
* The [**Import from URL** ](/carto-user-manual/workflows/components/input-output#import-from-url)component supports workflows that run on a schedule or are executed via API, providing more robust and automated data management options.

**Sunset of Previous Method**

* The [previous data importing method](/carto-user-manual/workflows/workflow-canvas#import-a-file-to-your-workflow), which was limited to UI-based operations, will be deprecated. The new Import from URL component provides a more versatile and powerful alternative.

**Quick Import from your desktop**

* Users can now quickly [**import files**](/carto-user-manual/workflows/data-sources#files) from their computers directly into the workflow canvas. This feature supports drag-and-drop functionality, making it easier to integrate local files into your workflows.
* Files uploaded in this manner remain accessible within each workflow, ensuring consistent data availability and management.

<figure><img src="/files/5MZ37Nxwh539zGUl1w1q" alt=""><figcaption></figcaption></figure>
{% endupdate %}

{% update date="2024-06-03" tags="new,builder" %}

## Support for calling external API services from Workflows

We are thrilled to announce a powerful new feature for Workflows: the ability to connect your workflows with external API services. With this new capability, we enabling use cases like the following:

* Retrieve Data from External APIs: Augment your datasets by pulling in information from APIs such as Google Environment APIs, government, cadaster, parcel data, and other specialized data sources.
* Trigger Actions via API: Automatically trigger external processes, send notifications, or execute commands directly from your workflows, like:
  * Notify on chat applications: Send real-time notifications to your company's channels to keep your team updated on workflow executions.
  * Integrations with automation tools: Integrate with automation tools to trigger external actions from a Workflow execution.
* Send data from your Workflows to external APIs: Use data from any node in your workflow to build the body for a request.

Leverage all this new functionality by using the new [**HTTP Request**](https://docs.carto.com/carto-user-manual/workflows/components/input-output#http-request) component: A dedicated Workflows component that facilitates making requests to external APIs, providing enhanced versatility and extensibility. It uses the `http_request` module from the CARTO Analytics Toolbox.\
\
It also supports [custom expressions and variables](/carto-user-manual/workflows/using-variables-in-workflows#using-variables-and-expressions-in-components) to embed logic directly into component settings using SQL operators combined with variable and column values.\\

<figure><img src="/files/qQS99n35vaH0w245i4cu" alt=""><figcaption></figcaption></figure>
{% endupdate %}

{% update date="2024-05-16" tags="new,builder" %}

## Support for custom basemaps in Builder

A basemap is a crucial component of any map, providing essential context, spatial features, and the visual foundation for your creations. To meet the unique needs of each organization, we now enable you to bring your own basemap directly into your CARTO organization.

Admin users at CARTO can now upload custom basemaps and tailor the basemap gallery options available to Editor users in Builder. Unleash your creativity and enjoy an enhanced map-making experience while maintaining a cohesive and consistent selection of basemaps throughout your organization.\
\
To learn more about how you can upload custom basemaps to the CARTO platform and the supported formats, check [this page](/carto-user-manual/settings/customizations/configuring-your-organization-basemaps). For a step-by-step guide on custom basemaps, check out our [new tutorial](https://academy.carto.com/building-interactive-maps/data-visualization/customize-your-visualization-with-tailored-made-basemaps) in the Academy.

<figure><img src="/files/o6CRbLv4V7clBVuedygR" alt=""><figcaption></figcaption></figure>
{% endupdate %}

{% update date="2024-05-14" tags="improvement,builder" %}

## Performance optimizations in Builder maps

We are excited to introduce a set of enhancements in CARTO Builder designed to further improve the performance of our interactive map visualizations. With these improvements, Builder will:

* **Load only essential properties**: Builder will now load only the essential properties from your tables or SQL queries when they are needed in the map. This reduces unnecessary data transfer and speeds up processing.
* **Reduce tile requests**: The number of tile requests has been significantly reduced, resulting in faster map loading times and a smoother user experience.
* **Limit simultaneous queries**: To enhance stability and prevent overload, Builder will limit the number of simultaneous queries, ensuring a more reliable performance.

These enhancements are part of our ongoing commitment to providing the best possible experience with CARTO Builder.

<figure><img src="https://lh7-us.googleusercontent.com/DHKsMLKqCbffRfMrj4FVXCPyOaqgMhQgVCbIynNHGOiniFC1otnAa0EK6ixfaq5uejJ85aNmYhU0ACJKSBeDAI8Szy-YitWsxkOh1VmfgrBQYh1QSlmhXoIyzh-aVi1Kg429toJ9oq26-HDMozj9327z-w=s2048" alt=""><figcaption></figcaption></figure>
{% endupdate %}

{% update date="2024-04-29" tags="improvement,workspace" %}

## Redesigning our Developers section in CARTO Workspace

We believe that all paths to success start from the CARTO Workspace, and the path to successfully developing powerful geospatial apps isn't an exception. With this in mind, we've carefully redesigned the experience when accessing the Developers section, and these are the highlights:

* New Overview with a curated list of [documentation, guides and examples](https://github.com/CartoDB/gitbook-documentation/blob/master/whats-new/broken-reference/README.md).
* A simplified [Credentials](/carto-user-manual/developers/managing-credentials) system to manage all your authentication methods.
  * This change unifies the management of API Access Tokens and OAuth Clients (*previously known as Applications*) in a single section, making more clear what each method is best for.
* A new list containing all your [API-enabled Workflows](/carto-user-manual/workflows/executing-workflows-via-api), for easy access.

Additionally, we've simplified the way that organizations decide the content in their [Applications](/carto-user-manual/applications) section. Before, it was a mix of developer credentials and apps registered by the administrator. Now, administrators in CARTO are in full control of [managing Applications](/carto-user-manual/settings/advanced-settings/managing-registered-apps), including the visibility/sharing settings.

*Developer credentials created before April 25th have been duplicated as applications to maintain the same visibility level as previously.* [*Read more here.*](/carto-user-manual/developers/managing-credentials)

<figure><img src="/files/WM0kO8vcajn4f0sOdV99" alt=""><figcaption></figcaption></figure>
{% endupdate %}

{% update date="2024-04-24" tags="new,workspace,workflows" %}

## Extended support for raster data sources in Data Explorer and Workflows

We're happy to introduce a suite of powerful new features that are set to enable working with raster data in CARTO. Before these were available, working with raster data required using external CLI applications and dealing with SQL queries manually in order to leverage the analytical capabilities of the CARTO Analytics Toolbox for Snowflake and BigQuery.

**Import Cloud Optimized GeoTIFFs**: Say goodbye to cumbersome raster data ingestion processes. With our latest enhancements, you can now effortlessly import Cloud Optimized GeoTIFFs to [Snowflake](/data-and-analysis/analytics-toolbox-for-snowflake/guides/working-with-raster-data) and [BigQuery](/data-and-analysis/analytics-toolbox-for-bigquery/guides/working-with-raster-data) via both the Import API and the [Workspace UI](/carto-user-manual/data-explorer/importing-data). This provides a streamlined and efficient method for ingesting raster files into BigQuery and Snowflake, ensuring optimal storage efficiency and fast query access.

**Raster Tables in Data Explorer**: Dive deeper into your raster data in the data warehouse with full support for raster tables in the Data Explorer. Gain access to a specific set of metadata and custom actions for raster tables.

**Workflow Components for Raster Analysis**: Take your spatial analyses to the next level with our new Workflow components designed specifically for working with raster data sources. Whether you're looking to extract raster values or perform complex intersect and aggregate operations, our new components, including "[Get Raster Values](/carto-user-manual/workflows/components/raster-operations#get-values-from-raster)" and "[Intersect and Aggregate Raster](/carto-user-manual/workflows/components/raster-operations#intersect-and-aggregate-raster)", provide you with the tools you need to unlock valuable insights from your raster datasets.

<figure><img src="/files/0GN1srZeSNndV4MBeTGr" alt=""><figcaption></figcaption></figure>
{% endupdate %}

{% update date="2024-04-17" tags="new,builder" %}

## Generate PDF reports from your Builder maps

We’ve launched a new feature that allows you to download detailed PDF reports of your interactive Builder maps. These reports capture everything from the current map extent to widgets, parameters, and the map description.

Whether you're sharing insights with colleagues, presenting to stakeholders, or documenting your analysis, this new feature packs the richness of your interactive maps into a portable, easy-to-share format.

<figure><img src="/files/9dMA2LjqJ1R3tPuNm64a" alt=""><figcaption></figcaption></figure>
{% endupdate %}

{% update date="2024-04-11" tags="improvement,workspace" %}

## Get quicker, better answers with the new AI-powered help sidebar

A new **AI-powered help assistant** can now be found in the Help sidebar, available at all times from CARTO Workspace, Builder and Workflows.

It will provide quick answers based on our documentation and will link to the most relevant resource. With our documentation evolving and growing in size and depth, this AI-powered tool will save precious time and will guide you in the right direction without leaving CARTO. Ask anything!

<figure><img src="/files/KHzcOWasZfXeoy7Livv2" alt=""><figcaption></figcaption></figure>
{% endupdate %}
{% endupdates %}


# Q1 2024

New features and improvements introduced from January to March 2024

{% updates %}
{% update date="2024-03-31" tags="new,builder" %}

## Preview Builder maps during edition

This new feature simplifies the map-making process by letting Editor users switch seamlessly between editing and previewing. With [Preview mode](/carto-user-manual/maps/sharing-and-collaboration/map-preview-for-editors), these users can easily see how the map will look like to viewers, allowing them to review and refine it before sharing. This smooth workflow ensures that maps are well-presented and meet the highest standards of clarity and effectiveness.

Additionally we've enhanced our map-sharing functionality to deliver a smoother and more intuitive experience. This update focuses on streamlining the process of sharing maps with others, ensuring a more seamless interaction. Dive into the details of these improvements in our [documentation](/carto-user-manual/maps/sharing-and-collaboration).

<figure><img src="https://lh7-us.googleusercontent.com/PkJbbKvVqhiFRIzQsb77-lfhKKxBm3WAZFOLd6M2kBzArwdQ4csXPhIconCCVZBPUYtEfWtL74AQnKXQtra8yiGqaRmaNl7b-b2pNExuFd8pylNCuzCrIZ_YI7oulWLdlTbU7a3zEh2uSXXuM8U5N8U" alt=""><figcaption></figcaption></figure>
{% endupdate %}

{% update date="2024-03-27" tags="new,carto-for-developers" %}

## Introducing: deck.gl v9

A **new major version of deck.gl** is out. deck.gl is the open-source visualization library that powers all CARTO visualizations, and one of the main components of [CARTO for Developers](https://github.com/CartoDB/gitbook-documentation/blob/master/whats-new/broken-reference/README.md).

* For a complete changelog, visit the official [**deck.gl what's new**](https://deck.gl/docs/whats-new).
* To address breaking changes, read the official [**deck.gl upgrade guide**](https://deck.gl/docs/upgrade-guide). Changes in the CARTO module are also addressed there.
* We have also published a complete set of [**new examples using CARTO + deck.gl**](/carto-for-developers/examples).

We're very happy to see CARTO joining efforts with many other contributors from the vis.gl and OpenJS Foundation communities. Read more about this release in the [CARTO blog](https://carto.com/blog/announcing-deck-gl-v9-webgpu-ready-with-typescript-support).

<figure><img src="/files/d6peg1zOd9E5ZWppDmut" alt=""><figcaption></figcaption></figure>
{% endupdate %}

{% update date="2024-03-21" tags="new,workflows" %}

## Support for scheduling the execution of workflows

With this new capability, analytical pipelines created with Workflows can be [**scheduled**](/carto-user-manual/workflows/scheduling-workflows) so they are executed on a specific period:

* **Hours:** The workflow will be executed every X hours, at o'clock times.
* **Days:** The workflow will be executed every day at a specific time.
* **Weeks:** The workflow will be executed weekly, on a specific day, at a specific time.
* **Months:** The workflow will be executed monthly, on a specific day, at a specific time.
* **Custom:** Use a custom expression to define the schedule.

CARTO leverages native scheduling capabilities on each data warehouse to provide this functionality in all CARTO Data Warehouse, BigQuery, Snowflake and PostgreSQL connections.

<figure><img src="/files/K79wh1eA2frWmwiBWvdc" alt=""><figcaption></figcaption></figure>
{% endupdate %}

{% update date="2024-03-14" tags="improvement,builder" %}

## Support for private embedding of CARTO Builder maps

Maps created with CARTO Builder can now be embedded anywhere — **even when they're not shared publicly**. With private embedding you can restrict and maintain control over who can view these maps when embedded on web pages or apps.

To leverage private embedding simply share your map with the organization or with the specific groups you want to share the map with. These users need to be previously logged-in to CARTO to view the embedded map. Learn more at our [Embedding maps documentation](/carto-user-manual/maps/sharing-and-collaboration/embedding-maps).

<figure><img src="/files/Bydx31Q6bB95eNQtzsJa" alt=""><figcaption><p>An example of a private embedded map where the user does not have access to the embedded content</p></figcaption></figure>
{% endupdate %}

{% update date="2024-02-29" tags="new,workflows" %}

## New Workflows components for low-code geospatial analytics

During the last few weeks, we’ve been progressively adding new and improved components in CARTO Workflows:

* [**Case When**](https://docs.carto.com/carto-user-manual/workflows/components/data-preparation#case-when) component for supporting column values based on conditional expressions.
* [**Edit Schema**](https://docs.carto.com/carto-user-manual/workflows/components/data-preparation#edit-schema) component (replacing Refactor Columns): clean schemas, rename and cast columns.
* Added ‘Append’ mode to [**Save as Table**](https://docs.carto.com/carto-user-manual/workflows/components/import-export#save_as_table)**.**
* Added ‘Maximum distance’ setting to [**K-Nearest Neighbors**](https://docs.carto.com/carto-user-manual/workflows/components/spatial-analysis#knn_neighbors).
* Added [**Extract from JSON**](https://docs.carto.com/carto-user-manual/workflows/components/data-preparation#extract-from-json) for extracting values from JSON columns using the native syntax from each data warehouse.
* Added ‘Mode’ setting to [**H3 Polyfill**](https://docs.carto.com/carto-user-manual/workflows/components/spatial-indexes#h3_polyfill) and [**Quadbin Polyfill** ](https://docs.carto.com/carto-user-manual/workflows/components/spatial-indexes#quadbin_polyfill)components.
* [**Subdivide**](https://docs.carto.com/carto-user-manual/workflows/components/spatial-operations#subdivide) to split larger geometries into easier-to-process smaller features.
* New UI for [**Draw Custom Features**](https://docs.carto.com/carto-user-manual/workflows/components/parsers#draw-custom-features) component
* [**Composite Score Supervised**](https://docs.carto.com/carto-user-manual/workflows/components/statistics#composite-score-supervised): Create composite scores with the supervised method using this component. [Take a look at the example template](https://academy.carto.com/creating-workflows/workflow-templates/statistics#create-a-composite-score-with-the-supervised-method-bigquery).
* [**Composite Score Unsupervised**](https://docs.carto.com/carto-user-manual/workflows/components/statistics#composite-score-unsupervised)**:** Create composite scores with the supervised method using this component. [Take a look at the example ](https://academy.carto.com/creating-workflows/workflow-templates/statistics#create-a-composite-score-with-the-unsupervised-method-bigquery)template

<figure><img src="/files/cBp8YSEuWj1dU4lHFjE5" alt=""><figcaption></figcaption></figure>
{% endupdate %}

{% update date="2024-02-21" tags="improvement,builder" %}

## Extended support for URL parameters in Builder maps

Exciting news – CARTO Builder has expanded its [URL parameter](/carto-user-manual/maps/sharing-and-collaboration/url-parameters) capabilities to include widgets, SQL parameters, search locations, and feature selections. Now, when viewers interact with these elements, the URL updates in real time, making it easier to share customized map views. This update opens up possibilities for creating varied views from a single map, simplifying sharing, and minimizing the need for multiple map versions. It also enhances the embedding of maps into websites or apps, providing a seamless user experience without unnecessary redirections.

<figure><img src="/files/Y9SaJ21ws9eAWOKCSmHp" alt=""><figcaption></figcaption></figure>
{% endupdate %}

{% update date="2024-02-19" tags="improvement,workspace" %}

## Distinguish Users by authentication method

We have added a new column to the *Users and Groups* table of the Organization Settings which displays the authentication method used by each user (Google Account, Username/Password, SSO or Github). This will help Admins better manage their organization, avoid confusion and identify users quickly.

<figure><img src="https://lh7-us.googleusercontent.com/9quW27BKn-sZf7-SXOSVgA0-5mg2iII86kr2Csx0tAws15SpOmTT6WoeWR6Auy3IIpqKDVIOcuR5QJcJE530qzOJk-lh6kaWFS9mmLSHw4WIhQPess_f3bsRcePu1zjhRJUZkWc2w7AhAI90ls8Fv936dg=s2048" alt=""><figcaption></figcaption></figure>
{% endupdate %}

{% update date="2024-02-08" tags="new,workflows" %}

## Support for configuring and executing your workflows with an API call

We are excited to announce the release of a comprehensive set of new features in CARTO Workflows designed to provide the **ability to trigger the execution of your workflows by calling an API**.

* **Variable definition**: [Define variables](/carto-user-manual/workflows/using-variables-in-workflows#creating-variables) that can be used within components' settings. These variables can also be configured as parameters, allowing for inputing dynamic values during API calls.
* **Expression support**: Introducing expressions! [Embed logic](/carto-user-manual/workflows/using-variables-in-workflows#using-variables-in-components) directly into component settings, enabling the use of SQL operators in conjunction with variable and column values from your data.
* **API endpoint for triggering workflows**: [Enable an API endpoint](/carto-user-manual/workflows/executing-workflows-via-api#enabling-api-access-for-a-workflow) to initiate a workflow execution. This endpoint exposes all parameters set as variables, facilitating smooth integration.
* **Workflow status polling**: [Easily monitor](/carto-user-manual/workflows/executing-workflows-via-api#checking-status-of-a-workflow-execution) the status of workflow execution.
* **Output definition and storage**: [Define the output of a workflow API execution](/carto-user-manual/workflows/executing-workflows-via-api#output-of-a-workflow-executed-via-api), which will be stored in a temporary table. The Fully Qualified Name (FQN) of this table is included in the API response for effortless access post-execution. This output can be used along with other options like exporting result to a bucket, saving to a static table or send an email with the result.
* **Controlled caching behavior**: Have control over caching behavior across all execution modes: UI, [Scheduled (Beta)](/carto-user-manual/workflows/scheduling-workflows), and via [API](/carto-user-manual/workflows/executing-workflows-via-api#running-a-workflow-via-api-call).

All these elements have been built to enable users to **integrate workflows** into larger analytical processes, and to embed **asynchronous analytical** capabilities into web applications.

<figure><img src="/files/TUB57zf83fHuntjkMXmf" alt=""><figcaption></figcaption></figure>
{% endupdate %}

{% update date="2024-01-15" tags="improvement,workspace" %}

## Improvements when sharing map and workflow links to new users

We have released a set of improvements that affect the **experience of new users when they open a** [**shared map**](/carto-user-manual/maps/sharing-and-collaboration) **or** [**shared workflow**](/carto-user-manual/workflows/sharing-workflows) **for the first time**. Previously, you had to invite those users or have them sign up manually. Now:

* If your organization uses [Single Sign-On (SSO)](/carto-user-manual/settings/sso), all maps and workflows shared links will redirect to your SSO login page for easier adoption and onboarding of new users
* The unauthenticated screen for all shared maps and workflows has been redesigned for clarity
* Users can now login or signup through the map/workflow link, and they will be **automatically redirected to the desired map/workflow once successfully authenticated**

<figure><img src="/files/D99vROzJ5EgsjyYrjWza" alt=""><figcaption></figcaption></figure>
{% endupdate %}

{% update date="2024-01-11" tags="new,documentation" %}

## New CARTO Academy - tutorials, videos and templates to boost your spatial analysis skills

We are happy to announce the launch of our new [CARTO Academy](https://academy.carto.com), with detailed tutorials, videos and templates to boost your spatial analysis skills and make you a proficient user of the CARTO platform.

Among others, in this new CARTO Academy you will find materials to get you started with [Spatial Indexes](https://academy.carto.com/working-with-geospatial-data/introduction-to-spatial-indexes), tutorials to help you build stunning [visualizations](https://academy.carto.com/building-interactive-maps/data-visualization) and [spatial analyses](https://academy.carto.com/building-interactive-maps/data-analysis) with CARTO Builder, step-by-step [tutorials](https://academy.carto.com/creating-workflows/step-by-step-tutorials) and [templates](https://academy.carto.com/creating-workflows/workflow-templates) for Workflows, and guides to develop your advanced spatial analysis skills with [Google BigQuery](https://academy.carto.com/advanced-spatial-analytics/spatial-analytics-for-bigquery/step-by-step-tutorials), [Snowflake](https://academy.carto.com/advanced-spatial-analytics/spatial-analytics-for-snowflake/step-by-step-tutorials) and [AWS Redshift](https://academy.carto.com/advanced-spatial-analytics/spatial-analytics-for-redshift/step-by-step-tutorials).

<figure><img src="/files/qVaRYvJddvJ4DfK3W2Za" alt=""><figcaption></figcaption></figure>
{% endupdate %}
{% endupdates %}


# Older entries

Archived release notes from 2022 and 2023

{% hint style="info" %}
These are archived What's New entries from 2022 and 2023. For the latest updates, see [What's new](/whats-new).
{% endhint %}

{% updates %}
{% update date="2023-12-20" tags="improvement,builder" %}

## Enhancements to export data from Builder maps

We've upgraded the [export functionality](/carto-user-manual/maps/exporting-data) in Builder maps, shifting the data export process to work in server-side mode for an enhanced efficiency and data integrity. This improvement ensures a more reliable data retrieval experience.

Additionally, when exporting data as CSV, it now includes the geometry column in WKT (Well-Known Text) format, if applicable. This enhancement simplifies data handling and boosts compatibility with various geospatial tools, making integrations smoother.

Looking to leverage this enhanced functionality for RDS for PostgreSQL data sources? Don't forget to set up the necessary S3 bucket integration to enable the export feature. For more details and guidance, check out our [documentation](/carto-user-manual/settings/advanced-settings/configuring-s3-bucket-integration-for-rds-for-postgresql-exports-in-builder).

<figure><img src="/files/AGDtbi1vqFVtI63ymVUJ" alt=""><figcaption></figcaption></figure>

\\
{% endupdate %}

{% update date="2023-12-18" tags="new,workflows" %}

## ML Generate Text component available for Workflows

We have added a [new component](/carto-user-manual/workflows/components/generative-ai#ml-generate-text) to Workflows that leverages [BigQuery ML Generate Text](https://cloud.google.com/bigquery/docs/reference/standard-sql/bigqueryml-syntax-generate-text) capabilities to allow embedding Generative AI functionalities into your geospatial analytical pipelines.

It can be used to help analyze the result of an enrichment; to generate labels or categories based on variables on your table; or could also generate new content for each row on your data, using different variables to compose a prompt that will be evaluated on each row.

With this new addition, Generative AI capabilities are handy and readily available from Workflows.

<figure><img src="/files/BBMPy783DEXy2zfEy2bZ" alt=""><figcaption></figcaption></figure>
{% endupdate %}

{% update date="2023-11-28" tags="new,workflows" %}

## Export Workflows results to a bucket

We have just released a [new component in Workflows](/carto-user-manual/workflows/components/input-output#export-to-bucket) that allows exporting the result from any node in a workflow to a storage bucket.

The node's data will be exported as a series of files, which URLs will be stored in a table. Just inspect the Data tab in the results panel to access the links to each file.

This component is currently available for all CARTO Data Warehouse and BigQuery connections.

<figure><img src="/files/FRRL50xTyjAsifvqLBvP" alt=""><figcaption></figcaption></figure>
{% endupdate %}

{% update date="2023-11-27" tags="improvement,workflows" %}

## Improvements to the results panel in Workflows

We have added a few improvements to the results panel in Workflows that are focused on better usability and data exploration capabilities:

* Renovated, sleeker design;
* See when the workflow was executed for the last time;
* Easily find the number of columns and rows of a result;
* Explore the complete result with pagination for optimal performance;
* Copy the content of a page to the clipboard, ready to be pasted into a spreadsheet;
* Analyze statistics of each column:
  * Frequency of the Top 20 categories for string, date and timestamp columns;
  * Maximum and minimum values, average and sum for numeric columns.
* SQL control code is hidden to facilitate readability.

Find all the documentation about these improvements [here](/carto-user-manual/workflows/results-panel).

{% embed url="<https://player.vimeo.com/video/888026673?amp;app_id=58479&autopause=0&player_id=0&quality_selector=1&badge=0>" %}
{% endupdate %}

{% update date="2023-11-22" tags="new,workspace" %}

## Support for OAuth connections in Snowflake

You can now set up an OAuth integration to connect CARTO and Snowflake. This allows users to follow their usual Snowflake login flow (**Snowflake OAuth**) to set up their connections in CARTO, which has security benefits and is a more familiar process for all Snowflake users.

If you have an external identity provider integrated in Snowflake such as Azure Active Directory or Okta, we also support **External OAuth** to achieve the same process.

Read more about [Configuring OAuth connections to Snowflake](/carto-user-manual/connections/snowflake#connecting-to-snowflake-via-oauth).

<figure><img src="/files/vU8TgproZ2kcaVydDnXq" alt=""><figcaption></figcaption></figure>
{% endupdate %}

{% update date="2023-11-16" tags="new,builder" %}

## Measure point-to-point distances in Builder maps

We're excited to announce the latest feature in Builder - a [distance measure](/carto-user-manual/maps/measure-distances) tool that will allow users to measure distances between two points on their maps.

This new functionality is ideal for a diverse range of use cases, from planning tasks to gaining a deeper understanding of spatial relationships between various map elements.

<figure><img src="/files/BfRkaO1ojIC7938QGYxc" alt=""><figcaption></figcaption></figure>
{% endupdate %}

{% update date="2023-11-06" tags="new,builder" %}

## Style qualitative data using hex color codes

In Builder, you now have the capability to style your qualitative data using hex color codes pulled directly from your table or SQL query sources. If you're curious about generating these hex color codes, we've prepared a [tutorial](https://academy.carto.com/building-interactive-maps/data-visualization/style-qualitative-data-using-hex-color-codes) to assist you, detailing the steps using either Workflows or SQL. What's especially exciting? The range of possibilities this opens up. Whether you're aligning with your company's branding, looking to automatically style a high number of categories, or exploring diverse color schemes, the choice is all yours.

<figure><img src="/files/pqnUyLaSvYIOjN3v9Yja" alt=""><figcaption></figcaption></figure>
{% endupdate %}

{% update date="2023-10-25" tags="new,workflows" %}

## Collection of Workflows examples

We have just published a new collection of workflows examples, designed with a hands-on approach to empower users and ease the learning curve for using CARTO Workflows.

It showcases a wide range of scenarios, from simple building blocks for your geospatial analysis to more complex, industry-specific workflows tailored to suit specific use cases.

Take a look at our catalog of workflows examples [**here**](https://academy.carto.com/creating-workflows/workflow-templates)!

{% embed url="<https://vimeo.com/877559106?share=copy>" %}
{% endupdate %}

{% update date="2023-10-25" tags="new,workflows" %}

## Improved import capabilities in Workflows

We have added a new mechanism to [**import a workflow into your account**](/carto-user-manual/workflows/sharing-workflows#import-a-workflow-from-a-sql-file). Just download an example from the gallery, drag and drop into your CARTO Workspace (or browse a file from your computer) and the workflow will be automatically re-created in your account.

And also we have just added a new way to [**import data into a workflow**](/carto-user-manual/workflows/workflow-canvas#import-a-file-to-your-workflow). Either from a local file in your computer, or from a URL, this new feature facilitates the task of incorporating data into your analytical pipelines.

{% embed url="<https://player.vimeo.com/video/876481893?amp;app_id=58479&autopause=0&player_id=0&progress_bar=1&quality_selector=1&badge=0>" %}
{% endupdate %}

{% update date="2023-10-18" tags="new,builder" %}

## New Pie Widget available in Builder

The new [Pie Widget](/carto-user-manual/maps/widgets/pie-widget) is designed to simplify the visualization of complex categorical data in Builder, making it more user-friendly and insightful.

Thanks to this new feature you can quickly and easily analyze data proportions and category weights, allowing for better understanding of each data category within your dataset. This enhancement empowers users to make more informed decisions by providing a clearer view of their data.

<figure><img src="/files/TaIdFiwM4tU9awNhvs8B" alt=""><figcaption></figcaption></figure>
{% endupdate %}

{% update date="2023-09-30" tags="improvement,builder" %}

## Multiple series and custom temporal aggregations in the Time Series Widget

We have upgraded our Time Series Widget in Builder to boost your temporal data analysis experience. These enhancements bring a new level of customization to your data exploration, offering:

* **Enhanced temporal precision:** Our upgraded Time Series Widget empowers you with precise control over temporal data aggregation. You can now extract insights using custom time intervals and enjoy greater granularity, resulting in more accurate analyses.
* **Analysis of multiple time series:** Unlock the ability to analyze multiple time series simultaneously within the widget, enabling seamless concurrent analysis over time.

<figure><img src="/files/TpL4aYT5Z3NKS9iUkVbI" alt=""><figcaption></figcaption></figure>
{% endupdate %}

{% update date="2023-09-30" tags="new,workflows" %}

## New components in Workflows for data enrichment, statistics and retail analytics

We have released a new set of components in Workflows for **Data Enrichment**:

* [Enrich Points](/carto-user-manual/workflows/components/data-preparation#enrich-points)
* [Enrich Polygons](/carto-user-manual/workflows/components/data-preparation#enrich-polygons)
* [Enrich H3 Grid](/carto-user-manual/workflows/components/data-preparation#enrich-h3-grid)
* [Enrich Quadbin Grid](/carto-user-manual/workflows/components/data-preparation#enrich-quadbin-grid)

Each of them allows to enrich different types of geospatial data, and all of them allow using both a [Data Observatory](/carto-user-manual/data-observatory) subscription or a custom table as source for the enrichment data.

Additionally, we have released a new component for advanced **Statistics** and for **Retail Analytics**, initially supported in Google BigQuery:

* [Geographically Weighted Regression](/carto-user-manual/workflows/components/statistics#gwr-grid)
* [Commercial Hotspots](https://github.com/CartoDB/gitbook-documentation/blob/master/whats-new/broken-reference/README.md)

These additions to Workflows will make it a lot easier to leverage data enrichment and advanced statistical capabilities in CARTO, integrating these complex processes as just another step in a workflow.

{% embed url="<https://vimeo.com/870961989>" %}
{% endupdate %}

{% update date="2023-09-07" tags="improvement,carto-for-developers" %}

## Leveraging SSO in applications built with CARTO

Developers building applications with CARTO can now leverage their existing [Single Sign-On (SSO)](/carto-user-manual/settings/sso) integration enabled in their organization to authenticate users.

Given the right setup, these applications will now be able to manage existing users and also first-time users coming from the SSO Identity Provider (IdP) that didn't exist previously in CARTO. The experience for these new users is seamless, without any action or step required. This is an extension of the [Just-in-time provisioning](/carto-user-manual/settings/sso#just-in-time-provisioning) setting available in CARTO Workspace.

The changes needed to fully leverage SSO and Just-in-time provisioning are covered:

* **For custom applications:** in a new [Build a private application using SSO](/carto-for-developers/guides/build-a-private-application-using-sso) guide.
* **For new and existing CARTO for React applications:** in the [Authentication](/carto-for-developers/carto-for-react/guides/authentication-and-authorization) guide.

{% embed url="<https://vimeo.com/861971307/f5378d7bba>" %}
{% endupdate %}

{% update date="2023-09-05" tags="new,workflows" %}

## Data Observatory subscriptions as data sources in Workflows

We have just made [Data Observatory](/carto-user-manual/data-observatory) subscriptions available in the Data Sources panel in Workflows.

This will make premium and public datasets a lot easier to work with: just drag and drop your available samples or subscriptions to the canvas and start building your workflow.

With this new addition to Workflows, the largest catalog of curated geospatial datasets is readily available to be integrated with your cloud native analytical pipelines with just a few clicks. Check this new feature documentation [here](/carto-user-manual/workflows/data-sources#data-observatory-subscriptions-as-data-sources).

{% embed url="<https://player.vimeo.com/video/861182364?amp;app_id=58479&autopause=0&player_id=0&badge=0>" %}
{% endupdate %}

{% update date="2023-09-04" tags="new,builder" %}

## Richer descriptions for Builder maps

We're delighted to announce the next level of map description functionality in CARTO Builder: Richer map descriptions with support for Markdown. This upgrade takes our previous map description feature to a whole new level.

With the new richer map descriptions, you're not just adding text; you're crafting a more engaging user experience. The support for Markdown syntax allows you to include various text formats, headers, links, images, and even bullet-point lists, elevating the user's understanding and interaction with your map. To learn how to add Richer Map Descriptions to your maps, [click here](/carto-user-manual/maps/map-description).

<figure><img src="/files/kty3y8k48c1Z24caCxT6" alt=""><figcaption></figcaption></figure>
{% endupdate %}

{% update date="2023-08-09" tags="new,builder" %}

## Support for Numeric SQL Parameter

\
We're thrilled to unveil our newest addition to CARTO Builder - the Numeric SQL Parameter, expanding our portfolio of supported SQL parameter types. This innovative feature offers users enhanced interaction with numerical data within Builder.

Leveraging the Numeric SQL parameter, users can seamlessly **retrieve single or pair numeric values from a Control UI** to update the underlying data sources. It's an excellent option for those requiring to filter data by specific numeric ranges or adjusting analytical outputs based on numerical inputs.

Learn more about how to set up and use SQL Parameters in your maps [here](/carto-user-manual/maps/sql-parameters).

<figure><img src="/files/1CzWsprJw0YcQ6Z2uH4V" alt=""><figcaption></figcaption></figure>
{% endupdate %}

{% update date="2023-07-24" tags="new,workspace" %}

## Sharing controls for Applications

We have added the possibility to control the visibility of [Applications](/carto-user-manual/applications) in CARTO through the usual sharing options (private, entire organization...), including the ability to share an application only with specific groups of users.

This is especially interesting to customize what applications are shown for each user in the CARTO Workspace depending on the groups that they belong to, and also to start developing applications privately, without the app shortcut being shown to other users. You will find more information for these use cases and other details in the [Managing Applications](/carto-user-manual/developers/managing-credentials) section in this documentation.

<figure><img src="/files/SfvW5Qmv8sz5VTvGTK9y" alt=""><figcaption></figcaption></figure>
{% endupdate %}

{% update date="2023-07-20" tags="improvement,workspace" %}

## Mapping groups to user roles in CARTO

Administrators in CARTO now have the possibility to **automatically assign a role to their users based on the groups that they belong to**. To do so, just enable this feature and map each group to a user role. For example, you can map the group `acme_data_analysts` to get the editor role in CARTO, and new users belonging to that group will automatically get the editor role as well.

This is a powerful approach to quickly onboard dozens or hundreds of users into CARTO while maintaining effortless and enterprise-grade controls over the privileges of each user. [Learn more about mapping groups to user roles](/carto-user-manual/settings/users-and-groups/mapping-groups-to-user-roles).

<figure><img src="/files/LMXoiSnDzYmtBTxQxo2J" alt=""><figcaption></figcaption></figure>
{% endupdate %}

{% update date="2023-07-13" tags="new,workspace" %}

## Viewer credentials mode when sharing BigQuery connections

Previously, whenever you created a BigQuery connection using OAuth ("Sign in with Google") it had to remain private, to prevent other users from impersonating your personal credentials.

With the addition of the new [**viewer credentials**](/carto-user-manual/connections/sharing-a-connection#require-viewer-credentials) mode when sharing connections, we're unlocking several benefits for organizations using BigQuery:

* Now you can [collaborate in maps](/carto-user-manual/maps/sharing-and-collaboration#collaborative-maps) using a shared BigQuery OAuth connection
* Instead of creating one connection per user, you can create just one connection and share it with everyone, with fewer management issues.
* By requiring viewer credentials, you can leverage [row-level security and other policies](/carto-user-manual/connections/sharing-a-connection#row-level-security-and-other-policies) set in your data warehouse.

<figure><img src="/files/CaBlhpEHpxBEc70mBbbS" alt=""><figcaption></figcaption></figure>
{% endupdate %}

{% update date="2023-07-06" tags="new,builder" %}

## Search locations by latitude and longitude in Builder

We are thrilled to introduce the enhanced [Search Location Bar](/carto-user-manual/maps/search-locations#address-search-bar), formerly known as the *Address Search Bar*. This feature now includes the ability to search for locations using coordinates. Simply input latitude and longitude values, and instantly visualize the corresponding location on the map.

Whether you're exploring remote areas, analyzing specific points of interest, or seeking valuable insights, our coordinate search feature empowers you to navigate with precision and seamlessly uncover new possibilities.

<figure><img src="/files/cCFc6QoUEBsquUvQ6n5f" alt=""><figcaption></figcaption></figure>
{% endupdate %}

{% update date="2023-06-30" tags="new,workflows" %}

## Explain your Workflows with rich markdown notes and custom node names

We have just added a couple of new features in Workflows that are going to improve a lot the explainability of your multi-step analytical pipelines.

* Rich notes supporting [Markdown](https://www.markdownguide.org/basic-syntax/) syntax.
* Update nodes with more relevant and descriptive names.

{% embed url="<https://vimeo.com/842405839>" %}
{% endupdate %}

{% update date="2023-06-30" tags="improvement,workspace" %}

## Remove CARTO footer from public and embedded maps

Starting today, users with the ability to customize branding and appearance can also remove the CARTO brand and social icons from their public and embedded maps.

This is a setting that is applied to all maps created in the organization. Additionally, administrators can decide whether new users receive the generic CARTO onboarding materials, to further customize the experience for new users. [Learn more about how to activate these customizations](/carto-user-manual/settings/customizations/customizing-appearance-and-branding).

<figure><img src="/files/41SqWy9jUpn6vaTar8IB" alt=""><figcaption></figcaption></figure>
{% endupdate %}

{% update date="2023-06-27" tags="new,builder" %}

## Custom aggregation operations for Formula Widget

We are excited to introduce the latest enhancement to the [Formula Widget](/carto-user-manual/maps/widgets/formula-widget) in Builder, which allows users to create their own custom aggregation operations.

This new feature provides advanced capabilities for users to tailor calculations and derive precise insights from their data using SQL Expressions.

With custom aggregation operations, users have the flexibility to define calculations that align precisely with their unique analytical requirements. They can incorporate business-specific formulas and apply complex mathematical operations to single or multiple columns from their data source.

This level of customization empowers users to unlock valuable insights and perform advanced calculations that go beyond standard aggregations.

<figure><img src="/files/Kt9aQLeVyytyIhBNxmKZ" alt=""><figcaption></figcaption></figure>
{% endupdate %}

{% update date="2023-06-26" tags="new,workflows" %}

## Define geospatial inputs by drawing custom features in Workflows

While working with Workflows, in some occasions a component needs to be defined as a custom geography (point, line or polygon). This is currently the case with "[*Table from GeoJSON*](https://docs.carto.com/carto-user-manual/workflows/components/parsers#table-from-geojson)" but this tool will also be used in other components that might need a custom geospatial input.

We have developed a new tool, accessible through the "*Draw features*" button to define custom geographies as inputs for components.

This new tool come in quite handy in cases where one or more steps in an analysis have to be defined by a manual input, allowing faster prototyping a providing a much better user experience.

{% embed url="<https://player.vimeo.com/video/839722407?h=689a3597bd>" %}
{% endupdate %}

{% update date="2023-06-20" tags="improvement,workspace" %}

## Define a custom schema when importing files

When importing geospatial data to a cloud data warehouse, one of the challenges is to select the correct data type for each of the columns in the file, also known as schema. And in most cases, CARTO automatically does the job for you, because we analyze a sample of the data and infer the data type from it.

For those cases where the automatic detection isn't exactly what you need, CARTO now allows you to **manually defined the schema of the imported file,** both through CARTO Workspace and Builder, and through our [Imports API](https://api-docs.carto.com/#082beac1-c823-4a16-b576-615ac7214012).

An example where this new feature is useful is when dealing with postal codes, that depending on the country could be automatically detected as numbers instead of strings — it doesn't make sense to calculate the *average* postal code.

To read more about how to select a custom schema in your imports, read our [Importing data documentation](/carto-user-manual/data-explorer/importing-data).

<figure><img src="/files/5KnQzt5fke9UPjznkoEw" alt=""><figcaption></figcaption></figure>
{% endupdate %}

{% update date="2023-06-14" tags="new,workflows" %}

## New batch of components to enable more powerful workflows and provide further flexibility in data transformation pipelines

We have released a new batch of components in Workflows to keep increasing the possibilities and the value of this tool to enable the creation of data pipelines and spatial analyses for our users. The majority of components in this new batch are oriented towards providing more flexibility when manipulating and getting your data ready for the analysis. Here's the list of new components:

* Multi-Col Formula: it computes new values based on a given expression and a set of fields to apply the expression to;
* Multi-Row Formula: it creates a new table containing a new column computed using a multi-row formula based on one or several input columns;
* Find Replace: it finds a string in one column of a table and replaces it with the specified value from another table;
* Refactor columns: it refactors the columns in a table, allowing to change names and data types, and to select only certain columns from a table;
* Transpose: it rotates table columns into rows;
* Text to Columns: it adds new columns based on splitting the text string in a text column;
* Unique: it separates unique rows and duplicated rows;
* Row Number: it creates a new table with an additional column containing row numbers;
* Quadbin To Parent: it adds a new column named quadbin\_parent with the value of the parent quadbin at a specific resolution;
* H3 To Parent: it adds a new column named h3\_parent with the value of the parent h3 at a specific resolution;
* H3 KRing: it returns the neighboring indexes in all directions under the K distance size;
* H3 Distance: it computes the H3 grid distance between two H3 index column.

<figure><img src="/files/GakFMTA9TCLeGEV4dALV" alt=""><figcaption></figcaption></figure>
{% endupdate %}

{% update date="2023-06-06" tags="new,analytics-toolbox" %}

## New function to generate point-to-point routes for different transportation modes in the Analytics Toolbox for BigQuery, Snowflake and Redshift

In the lds module of the last release of the [Analytics Toolbox](https://docs.carto.com/data-and-analysis/analytics-toolbox-overview) for BigQuery, Snowflake and Redshift we have now added the function to CREATE\_ROUTES between given sets of origins and destinations (points) in a query, supporting different transportation modes and other advanced parameters. The function generates a new table with the columns of the input query plus a column with the resulting routes. Note that the routes are calculated by calling one of our external location data services providers. This functionality is also available from CARTO’s [LDS API](https://api-docs.carto.com/#544e671e-d4bc-4e52-893d-58d64efd3a7e).

<figure><img src="/files/a7RVuuV0biSCYFoMhFPJ" alt=""><figcaption></figcaption></figure>
{% endupdate %}

{% update date="2023-06-06" tags="new,analytics-toolbox" %}

## Space-time cluster analysis now available in the Analytics Toolbox for BigQuery

In the last release of the [Analytics Toolbox for BigQuery](https://docs.carto.com/data-and-analysis/analytics-toolbox-for-bigquery) we have available a new set of functions in order to perform space-time cluster analysis, for when data has both a spatial and a temporal component and you want to identify clusters looking at both dimensions at the same time (e.g. hotspots of demand for food delivery services in different periods of the day). Our implementation computes the space temporal Getis-Ord Gi\* statistic for each area and timestamp according to the method described in this [paper](https://www.tandfonline.com/doi/abs/10.1080/00330124.2019.1709215?journalCode=rtpg20). This is supported now with two new functions in the [statistics module](https://docs.carto.com/data-and-analysis/analytics-toolbox-for-bigquery/sql-reference/statistics) of the toolbox, namely [GETIS\_ORD\_SPACETIME\_QUADBIN](https://docs.carto.com/data-and-analysis/analytics-toolbox-for-bigquery/sql-reference/statistics#getis_ord_spacetime_quadbin) for quadbin indexes and [GETIS\_ORD\_SPACETIME\_H3](https://docs.carto.com/data-and-analysis/analytics-toolbox-for-bigquery/sql-reference/statistics#getis_ord_spacetime_h3) for H3 indexes.

<figure><img src="/files/BGPA7JiNpJBREnPwZ51p" alt=""><figcaption></figcaption></figure>
{% endupdate %}

{% update date="2023-05-16" tags="new,builder" %}

## Focus maps on user's device location

Finding your current location on CARTO maps is finally possible. This feature is specially helpful when users require the map zoom in to their current position in a seamlessly manner to obtain insights from their surroundings.

This is how it works:

1. Click the Focus on User's Device Location button.
2. Enable Location Services on your browsers if required.

The map display zooms in to your current location and a blue icon indicates your position on the map.

{% embed url="<https://files.gitbook.com/v0/b/gitbook-x-prod.appspot.com/o/spaces%2FybPdpmLltPkzGFvz7m8A%2Fuploads%2FHJLLGS9eZVAyeRTw8P0G%2Ffocus.gif?alt=media&token=83b6ae6b-374d-4881-b2d2-714ba6a9bfde>" %}
{% endupdate %}

{% update date="2023-05-08" tags="improvement,workspace" %}

## Access to the CARTO Data Warehouse SQL console

The [CARTO Data Warehouse](/carto-user-manual/connections/carto-data-warehouse) is a connection that comes pre-created for every CARTO organization, and it's fully managed by CARTO.

Until this release, it wasn't possible to manage the data available to this connection other than what was already available through Builder and Workflows.

Now, all users can introduce a *Google account* that they'll use to access the console. Once inside, you can run any SQL query, copy and edit existing tables or use other built-in features to import and migrate your data. Read more on [how to get access to the CARTO Data Warehouse console](/carto-user-manual/connections/carto-data-warehouse#accessing-the-console).

<figure><img src="/files/uRMnzxgUynqzC5d3dsuw" alt=""><figcaption></figcaption></figure>
{% endupdate %}

{% update date="2023-05-05" tags="new,analytics-toolbox" %}

## New module in the Analytics Toolbox for Snowflake providing access to a set of geostatistical functions

Users of our [Analytics Toolbox for Snowflake](https://docs.carto.com/data-and-analysis/analytics-toolbox-for-snowflake) have now access to a new module named “statistics” offering functions to compute statistical measures on top of your spatial data. In this last release we have added support for computing the [Moran’s I spatial autocorrelation](https://en.wikipedia.org/wiki/Moran's_I) and the Getis-ord Gi\* statistics used for the identification of hotspots based on an input feature.

<figure><img src="/files/BEKkjG4zCv34ThNbbLPX" alt=""><figcaption></figcaption></figure>
{% endupdate %}

{% update date="2023-05-05" tags="new,analytics-toolbox" %}

## Support for operating with H3 indices in the Analytics Toolbox for PostgreSQL

In this last release of the [Analytics Toolbox for PostgreSQL](https://docs.carto.com/data-and-analysis/analytics-toolbox-for-postgresql), we have added a new module named “h3” with a set of functions providing users support for operating over the [H3](https://h3geo.org/) spatial index. H3 is a multi-resolution hexagonal global grid system with hierarchical indexing developed by Uber, offering important benefits when performing spatial analytics at scale. To learn more about Spatial Indexes and H3 in particular, please have a look at our [Spatial Indexes 101](https://go.carto.com/report-spatial-indexes-101) report and our [documentation](https://docs.carto.com/data-and-analysis/analytics-toolbox-for-postgresql/key-concepts/spatial-indexes).

<figure><img src="/files/TzIcoNEwcztsUP2F7GKJ" alt=""><figcaption></figcaption></figure>
{% endupdate %}

{% update date="2023-05-05" tags="new,analytics-toolbox" %}

## New functions to compute the “Area of Applicability” of a model built with BigQuery ML in the Analytics Toolbox for BigQuery

Some areas due to their intrinsic characteristics or the data available are not suitable for running the predictive models given the large differences within the data used when training those models (e.g. training a model on big cities and then running predictions in areas of low population density). We have added new functions in the [statistics](https://docs.carto.com/data-and-analysis/analytics-toolbox-for-bigquery/sql-reference/statistics) module to allow users to compute the Area of Applicability (AOA) of a BigQuery ML model. It generates a metric which tells the user where the results from a Machine Learning (ML) model can be trusted when the predictions are extrapolated outside the training space (i.e. where the estimated cross-validation performance holds).

In the case of our [Analytics Toolbox for BigQuery](https://docs.carto.com/data-and-analysis/analytics-toolbox-for-bigquery), this functionality is particularly useful when working with our [BUILD\_REVENUE\_MODEL](https://docs.carto.com/data-and-analysis/analytics-toolbox-for-bigquery/sql-reference/retail#build_revenue_model) and [PREDICT\_REVENUE\_AVERAGE](https://docs.carto.com/data-and-analysis/analytics-toolbox-for-bigquery/sql-reference/retail#predict_revenue_average) procedures of the [retail](https://docs.carto.com/data-and-analysis/analytics-toolbox-for-bigquery/sql-reference/retail) module.

<figure><img src="/files/9VDbgoxMbEOl5vH8HIS0" alt=""><figcaption></figcaption></figure>
{% endupdate %}

{% update date="2023-04-24" tags="new,builder" %}

## Support for SQL Parameters in Builder

SQL Parameters are placeholders that can be used on any SQL Query data source in Builder.

Once defined, the actual value for the parameter can be set through a control UI in the right side panel’s '*Parameters*' tab. This allows to manipulate the actual SQL Query through an UI, by both Editor and Viewer users.

Among many different use cases, some applications for this new feature are:

* Create 'Text' or 'Dates' parameters.
* Reduce the size of a data source before rendering the map.
* Allow viewer users to define custom values in the data source in a controlled way.
* Use the same parameter in one or more queries.
* Filter a dataset before aggregating it to a spatial index grid (H3 or Quadbin).

Learn more about how to set up and use SQL Parameters in your maps [here](/carto-user-manual/maps/sql-parameters).

{% embed url="<https://vimeo.com/820914005>" %}
{% endupdate %}

{% update date="2023-04-21" tags="new,workspace" %}

## Easier authentication for developers with our API Access Tokens UI

Developers looking to create geospatial applications at scale usually face an authentication challenge: how to build the application so that data is accessed in a granular and secure way. And there are different solutions depending on your needs: from static API Access Tokens for simple, public applications to dynamic authentication using the CARTO login (with or without Single Sign-On).

Today we're making the creation and management of **API Access Tokens** much simpler, with a **complete user interface to create, edit and delete tokens**.

API Access Tokens are now the recommended method to start working with [CARTO for deck.gl](https://github.com/CartoDB/gitbook-documentation/blob/master/carto-for-developers/key-concepts/carto-for-deck.gl) and the CARTO APIs, and we've updated the documentation and [API reference](https://api-docs.carto.com) accordingly.

Learn here [how to create and manage your API Access Tokens](/carto-user-manual/developers/managing-credentials/api-access-tokens).

<figure><img src="/files/VD8VrSBDxlLPa6L7AqEf" alt=""><figcaption></figcaption></figure>
{% endupdate %}

{% update date="2023-04-13" tags="new,workspace" %}

## Optimize your data for geospatial analysis in just a few clicks with our Table Optimization wizard

CARTO is the ideal solution for geospatial visualization and analysis of large scale datasets, due to the scalability of the cloud data warehouses (eg: BigQuery, Snowflake, Redshift, Databricks...). However, dealing with such large datasets requires special attention into performance and optimizations.

Now, whenever we detect that one of your tables could perform better according to our [performance considerations](/carto-user-manual/maps/performance-considerations), we'll show a warning in Data Explorer and Builder, and you'll be able to take action immediately.

In just a few clicks, **you'll overwrite or generate an optimized copy of your data**, that will perform faster and save computing costs.

To understand in detail how these optimizations work, head to the [Optimizing your data](/carto-user-manual/data-explorer/optimizing-your-data) guide.

<figure><img src="/files/7FPSoZe7JZkYZ4mwsHvK" alt=""><figcaption></figcaption></figure>
{% endupdate %}

{% update date="2023-04-10" tags="new,workspace" %}

## Default role for new users and SSO just-in-time provisioning

We are adding two new features for admins to manage new users more easily and predictably:

* **Default role for new users**: Admins can now choose which role should be applied to new users, and by default it will be set to "viewers" following the least-privilege principle. Find more information about [roles in CARTO](/carto-user-manual/settings/users-and-groups/managing-user-roles) and [about this setting](/carto-user-manual/settings/users-and-groups/managing-user-roles#default-role-for-new-users).
* **SSO Just-in-time provisioning:** Admins that have integrated their own SSO login can now decide whether new users will get additional questions when onboarding or not. If it's enabled, we'll just provision their user as soon as they login, without any needed step. This new setting has been included in the [documentation about SSO at CARTO](/carto-user-manual/settings/sso).

<figure><img src="/files/CqrBfRfDdQt9sbAGSOzW" alt=""><figcaption></figcaption></figure>
{% endupdate %}

{% update date="2023-04-06" tags="new,builder" %}

## Supporting labels in tile layers

CARTO Builder now supports adding labels to point layers loaded via tiles, with a set of improved features:

* Support for primary and secondary label on each point.
* Now using a better typography, increasing readability.
* Collision control: Now labels are displayed in a way that they don’t collision with each other, adapting dynamically on each zoom level.
* Custom colors for the font and outline, allowing much better customization capabilities.

<figure><img src="/files/C9c3i2v9oREVETbUmSeS" alt=""><figcaption></figcaption></figure>
{% endupdate %}

{% update date="2023-04-03" tags="new,analytics-toolbox" %}

## Enabling users to create spatial scores using the Analytics Toolbox for BigQuery

In this month's release of the Analytics Toolbox for BigQuery, we have published a new functionality that consists of a set of procedures within the statistics module to enable users to [create spatial scores](https://academy.carto.com/advanced-spatial-analytics/spatial-analytics-for-bigquery/step-by-step-tutorials/how-to-create-a-composite-score-with-your-spatial-data) (also known as [composite indicators](https://www.oecd.org/sdd/42495745.pdf) or indexes) derived from a combination of different features. We have included 3 different procedures:

* [CREATE\_SPATIAL\_COMPOSITE\_SUPERVISED](/data-and-analysis/analytics-toolbox-for-bigquery/sql-reference/statistics#create_spatial_composite_supervised): to compute a spatial composite score as the residuals of a regression model which is used to detect areas of under- and over-prediction.
* [CREATE\_SPATIAL\_COMPOSITE\_UNSUPERVISED](/data-and-analysis/analytics-toolbox-for-bigquery/sql-reference/statistics#create_spatial_composite_unsupervised): to perform an aggregation of individual variables, scaled and weighted accordingly, into a spatial composite score.
* [CRONBACH\_ALPHA\_COEFFICIENT](/data-and-analysis/analytics-toolbox-for-bigquery/sql-reference/statistics#cronbach_alpha_coefficient): to measure the internal consistency of the variables used to derive the spatial composite score.

<figure><img src="/files/iB3H4EXJA0PIsiPHB8rz" alt=""><figcaption></figcaption></figure>
{% endupdate %}

{% update date="2023-03-28" tags="improvement,workspace" %}

## Introducing a new Usage quota and a new Location Data Services credits system

In order to give more flexibility to our users, we have removed a lot of the quotas that were feature-specific, such as *maps, public maps, apps* or *connections,* and we have replaced them with a combined usage metric, the **Usage quota**, that will be the main driver of consumption for all new customers through the CARTO platform.

The Usage quota is related to the number of successful API calls, excluding the metadata. Learn more about how it's calculated and how it applies to your subscription in our [documentation](/carto-user-manual/settings/understanding-your-organization-quotas#usage-quota).

Additionally, we have changed the way **LDS credits** are calculated. Before, they were monthly and separated by service: geocoding and isolines. Now, we've combined them into a single annual quota that results in more capacity and better flexibility.

<figure><img src="/files/2f4uEK2GpvYIH10JoJ2i" alt=""><figcaption></figcaption></figure>
{% endupdate %}

{% update date="2023-03-14" tags="improvement,workspace" %}

## Importing geospatial files into Amazon Redshift using CARTO

Starting today, CARTO supports [importing geospatial files](/carto-user-manual/data-explorer/importing-data) through an **Amazon Redshift** connection leveraging the [CARTO Import API](https://api-docs.carto.com/#d8fea1d4-2f80-4270-a684-75fd83b10426).

With this new functionality, CARTO users working with Amazon Redshift will be able to quickly get their geospatial data ready for advanced analysis and visualization, from no-code tools like Builder or Workflows to geospatial development libraries such as CARTO for deck.gl.

Additionally, we are giving all customers the option to [configure the AWS S3 Bucke](/carto-user-manual/settings/advanced-settings/configuring-s3-bucket-for-redshift-imports)t used to import files (instead of the default bucket provided by CARTO in cloud instances).

<figure><img src="/files/KIJQCX8HMLaYgQ9VsAs9" alt=""><figcaption></figcaption></figure>
{% endupdate %}

{% update date="2023-03-07" tags="new,analytics-toolbox" %}

## Merchant universe matching analysis to understand market penetration for CPG players available in the Analytics Toolbox for BigQuery

In this month's release of the Analytics Toolbox for BigQuery, we have published a new functionality within the [CPG module](/data-and-analysis/analytics-toolbox-for-bigquery/sql-reference/cpg) that allows our users to perform the merchant universe matching analysis in order to derive insights on market penetration and to identify expansion opportunities. With this analysis, CPG players can match their current universe of merchants/customers against the total universe of all potential ones on a given market, in order to identify in which merchants their products are still not present.

This analysis is performed with two new procedures in the Analytics Toolbox: [UNIVERSE\_MATCHING](/data-and-analysis/analytics-toolbox-for-bigquery/sql-reference/cpg#universe_matching) which performs a fuzzy match between two POI datasets based on location and name similarity, and [UNIVERSE\_MATCHING\_REPORT](/data-and-analysis/analytics-toolbox-for-bigquery/sql-reference/cpg#universe_matching_report) that generates report-like tables summarizing market penetration insights.

<figure><img src="/files/LdJPHxJiyYngGRl0ahm3" alt=""><figcaption></figcaption></figure>
{% endupdate %}

{% update date="2023-03-03" tags="new,builder" %}

## New Builder SQL Analyses available for Redshift and Snowflake connections

A set of new analyses have been added to Builder, to reach the same level of support on different data warehouses:

* **Create buffers:** Available now for Redshift and Snowflake connections.
* **Intersect and aggregate:** Available now for Snowflake connections.
* **K-means clustering:** Available now for Redshift and Snowflake connections.

Check the list of analyses available for each data warehouse and further documentation about each of them [here](/carto-user-manual/maps/sql-analyses).
{% endupdate %}

{% update date="2023-02-24" tags="beta,workflows" %}

## Enabling users to share workflows with their organization

From today, users can start [sharing workflows](/carto-user-manual/workflows/sharing-workflows) with the rest of users within their CARTO organization; who will then be able to open the shared workflow in view mode, and in the case of Editor users duplicate the workflow and edit the copied version as they wish.

Additionally, we have adapted the Workflows main page in the Workspace to allow searching workflows and managing the existing ones, in line with what’s available in the Maps section.

{% embed url="<https://vimeo.com/801995166>" %}
{% endupdate %}

{% update date="2023-02-01" tags="beta,workflows" %}

## CARTO Workflows in public beta now with support for Snowflake, Redshift and PostgreSQL

From today, customers on Snowflake, Redshift and PostgreSQL have the possibility to use the public beta version of CARTO Workflows with data sources from their data warehouse connections. Note that CARTO Workflows is a new tool that enables users of all types and skill levels to harness the power of cloud data warehouses, [spatial SQL](https://carto.com/spatial-sql/), and advanced spatial analytics.

To learn more about this new development, please check our [product documentation](/carto-user-manual/workflows).

<figure><img src="/files/AbmhC0LUTIpB6hQ6nWB0" alt=""><figcaption></figcaption></figure>
{% endupdate %}

{% update date="2023-01-31" tags="beta,analytics-toolbox" %}

## New functions to generate routing matrices and isolines natively in BigQuery

In the January 2023 release of the Analytics Toolbox for BigQuery, we have published a new and improved version of the [`routing`](https://docs.carto.com/data-and-analysis/analytics-toolbox-for-bigquery/sql-reference/routing) module. This new version includes procedures [`ROUTING_MATRIX`](https://docs.carto.com/data-and-analysis/analytics-toolbox-for-bigquery/sql-reference/routing#routing_matrix) to calculate origin-destination matrices and [`ROUTING_ISOLINES`](https://docs.carto.com/data-and-analysis/analytics-toolbox-for-bigquery/sql-reference/routing#routing_isolines) to compute isolines around a set of locations, both supporting multiple transportation modes (car, bike, and walk). These new functions run on top of [CARTO’s road network](https://carto.com/spatial-data-catalog/browser/geography/cdb_road_networ_81badfc2/) (derived from OSM segments) that is available as a public subscription in the [Data Observatory](https://docs.carto.com/data-and-analysis/data-observatory/overview/getting-started). Please note that these improvements imply breaking changes with the previous version of the routing module.

To learn more about these new procedures please check our [product documentation](https://docs.carto.com/data-and-analysis/analytics-toolbox-for-bigquery/sql-reference/routing). We have also published a [guide](https://academy.carto.com/advanced-spatial-analytics/spatial-analytics-for-bigquery/step-by-step-tutorials/using-the-routing-module) to illustrate how to benefit from this module of the Analytics Toolbox.

<figure><img src="/files/snTNc9Z4BXdt3fYP3YRy" alt=""><figcaption></figcaption></figure>
{% endupdate %}

{% update date="2023-01-31" tags="beta,analytics-toolbox" %}

## Adding raster support in BigQuery with a new module in the Analytics Toolbox

In the January 2023 release of the Analytics Toolbox for BigQuery, we have launched in beta our new [`raster`](https://docs.carto.com/data-and-analysis/analytics-toolbox-for-bigquery/sql-reference/raster) module. This feature offers a set of functions to operate with raster data natively in BigQuery, benefiting from the processing speeds and scalability of this data warehouse.

Alongside the raster module in the Analytics Toolbox, we have also made available our [Raster Loader](https://raster-loader.readthedocs.io/en/latest/), built in collaboration with [Makepath](https://makepath.com/). This publicly available Python library works as a tool for loading and optimizing GIS raster data into cloud-based data warehouses.

In order to learn more about this new module please check our [product documentation](https://docs.carto.com/data-and-analysis/analytics-toolbox-for-bigquery/sql-reference/raster). We have also published an [example](https://academy.carto.com/advanced-spatial-analytics/spatial-analytics-for-bigquery/step-by-step-tutorials/using-raster-and-vector-data-to-calculate-total-rooftop-pv-potential-in-the-us) that illustrates how to use some of our functionality to combine raster and vector data to solve a spatial analysis.

<figure><img src="/files/NIp4otE8Zq0RHSnJpGAh" alt=""><figcaption></figcaption></figure>

<figure><img src="/files/g4TyWSEMv54Revp8RboQ" alt=""><figcaption></figcaption></figure>
{% endupdate %}

{% update date="2023-01-26" tags="new,workspace" %}

## New space for private data available for every user in the CARTO Data Warehouse

Starting with this release, users that explore their CARTO Data Warehouse connection in [Data Explorer](/carto-user-manual/data-explorer) will find two datasets (represented as folders) inside their organization data: **private** and **shared**.

The new dataset *"private"* is a unique dataset for each user, and all the tables and tilesets in this dataset will **only be available to that user**. Private datasets have a unique qualified name that identifies the user, extracted from their email.

The "*shared*" dataset will remain available to all the editor users in that organization. You can find all the documentation for this feature in the [CARTO Data Warehouse documentation](/carto-user-manual/connections/carto-data-warehouse#private-private).

<figure><img src="/files/r3ZF3lnavDxR85WlvlCP" alt=""><figcaption></figcaption></figure>
{% endupdate %}

{% update date="2023-01-24" tags="improvement,builder-workspace" %}

## Search, list view and breadcrumbs when browsing your data in Builder and Workspace

An important step of most processes in CARTO is to browse and select data sources and data locations:

* A data source (eg: adding a [source in Builder](/carto-user-manual/maps/data-sources), using a [SQL Analysis](/carto-user-manual/maps/sql-analyses)...)
* A future location to save results (eg: [creating a tileset](https://github.com/CartoDB/gitbook-documentation/blob/master/whats-new/broken-reference/README.md), [importing data](/carto-user-manual/data-explorer/importing-data), [running an enrichment](https://github.com/CartoDB/gitbook-documentation/blob/master/whats-new/broken-reference/README.md)...)

We have improved the user experience for these cases by **adding a search bar** that works at every level of your data, **adding a new view: the list view,** and adding **breadcrumbs** to help you navigate your data. The list view is similar to the one used in [Data Explorer](/carto-user-manual/data-explorer) (including the search bar and breadcrumbs) and will now make the experience more consistent across the CARTO platform. If you would rather focus on the hierarchy of your data, the tree view is still available on the top right.

This is especially beneficial if you have a large number of projects/databases, schemas/datasets, or tables and tilesets: where previously you would need to scroll indefinitely, now you can perform a quick search.

{% embed url="<https://vimeo.com/792285694/69deb00037>" %}
{% endupdate %}

{% update date="2023-01-23" tags="new,builder" %}

## Dynamic aggregation of point layers into Quadbin grids

With this new feature, point layers can be [transformed dynamically into an aggregated grid](https://docs.carto.com/carto-user-manual/maps/layer/layer-styles#dynamic-aggregation-of-points-into-quadbin-grids) leveraging our Quadbin spatial index.

This produces a very significant increment in performance, but also allows aggregating data from the original features to make sure that all data is taken into consideration.

Some highlights:

* Available for all point tile layers from all data warehouses
* Implemented with pure SQL in our Maps API, no external dependencies such as the Analytics Toolbox or third-party libraries.
* It allows aggregating properties from the original points and also the number of points per cell.
* Inherits all the advantages and features of the previously existing Spatial Index layers.
* The aggregation happens transparently so no need to manually type any SQL code to aggregate the points.

{% embed url="<https://vimeo.com/791222940>" %}
{% endupdate %}

{% update date="2023-01-18" tags="beta,workflows" %}

## CARTO Workflows in public beta with support for Google BigQuery and CARTO Data Warehouse

Today we are excited to announce that CARTO Workflows is now publicly available in beta with support for Google BigQuery and CARTO Data Warehouse. CARTO Workflows is a new tool that enables users of all types and skill levels to harness the power of cloud data warehouses, [spatial SQL](https://carto.com/spatial-sql/), and advanced spatial analytics.

CARTO Workflows provides a visual language to design and execute multi-step spatial analytics procedures, reducing the complexity and the high dependance on specialist knowledge to leverage the power of location intelligence. To learn more about this new development, please check our [product documentation](/carto-user-manual/workflows).

In the coming weeks we will add support to run CARTO Workflows on Snowflake, Redshift and PostgreSQL-based data warehouses, if you want to know more about that please contact us through our [Support team](/faqs/support-packages).

{% embed url="<https://vimeo.com/790490986>" %}
{% endupdate %}

{% update date="2023-01-18" tags="improvement,documentation" %}

## New documentation layout

Our documentation portal just got a new look and feel! This new layout should provide the following benefits:

* Cleaner look that uses more screen space if available
* A search bar to quickly find content
* All the documentation is organized and available on the left menu
* All pages now have an "*On this page*" index on the right sidebar \_\_ to quickly locate sections

Hopefully, you'll have a better experience using this documentation. If you have any feedback about it, contact us through our [Support team](/faqs/support-packages). We'll keep working on documentation improvements during the following weeks.

<figure><img src="/files/fH3jWhKsILI2oyYWuVtd" alt=""><figcaption></figcaption></figure>
{% endupdate %}

{% update date="2023-01-13" tags="new,builder" %}

## Multiple editor users working on the same map

Collaborating on CARTO maps is finally possible, in asynchronous mode. This is helpful in setups such as production-ready maps, where the original owner might be out of the office; or in situations where the data, analysis, and cartography are each accomplished by different users. This is how it works:

1. The map owner first needs to **enable collaboration** for that map.
2. From that moment, all editors with access to the map will be able to edit it.
3. If two editors try to edit at the same time, the last one will be locked out, with the option of requesting to take over editing.

Happy collaboration!

{% embed url="<https://player.vimeo.com/video/761460659?h=cb31af417c>" %}
{% endupdate %}

{% update date="2022-12-29" tags="new,builder" %}

## Builder SQL Analyses available for PostgreSQL connections

Customers relying on [PostgreSQL](https://www.postgresql.org/) and [PostGIS](https://postgis.net/) for their geospatial data will now be able to create and execute analyses directly from Builder.

These analyses are created as dynamically generated SQL queries that are pushed down to a PostgreSQL database through a [CARTO connection](https://docs.carto.com/carto-user-manual/connections/creating-a-connection/#connection-to-postgresql).

The result can be visualized, used as input for another step of the analysis, or persisted into a new table.

{% embed url="<https://player.vimeo.com/video/784973603>" %}
{% endupdate %}

{% update date="2022-12-27" tags="improvement,analytics-toolbox" %}

## Additional options to configure the creation of isolines in the Analytics Toolbox

In the last release of the Analytics Toolbox for [BigQuery](https://docs.carto.com/analytics-toolbox-bigquery/release-notes/), [Snowflake](https://docs.carto.com/analytics-toolbox-snowflake/release-notes/) and [Redshift](https://docs.carto.com/analytics-toolbox-redshift/release-notes/) we have added the possibility to configure more options as parameters when executing the functions to CREATE\_ISOLINES. These new options, which depend on the LDS service provider, allow the user to configure more transportation modes such as truck or bike, the possibility of specifying departure or arrival times allowing the creation of reverse isolines, and other options like different routing modes. Additionally, we have added new confidence/relevance metadata to the results of the geocoding function GEOCODE\_TABLE.

<div><figure><img src="/files/OQCJ4BjuxTfDKGZcT8yt" alt=""><figcaption></figcaption></figure> <figure><img src="/files/OQCJ4BjuxTfDKGZcT8yt" alt=""><figcaption></figcaption></figure></div>
{% endupdate %}

{% update date="2022-12-27" tags="improvement,workspace" %}

## Importing geospatial files into PostgreSQL databases through CARTO Workspace

CARTO Workspace now supports [importing geospatial files](https://docs.carto.com/carto-user-manual/data-explorer/importing-data/) through a PostgreSQL connection leveraging [CARTO Import API](https://api-docs.carto.com/#d8fea1d4-2f80-4270-a684-75fd83b10426).

With this new functionality, CARTO users working with a PostgreSQL database will be able to get their geospatial data ready for advanced analysis and visualization in Builder and [CARTO for deck.gl](https://docs.carto.com/deck-gl/getting-started/).
{% endupdate %}

{% update date="2022-12-27" tags="beta,analytics-toolbox" %}

## New function to identify similar locations, such as merchants or stores, based on the characteristics of their trade areas in the Analytics Toolbox for BigQuery

We have released within the [cpg module](https://docs.carto.com/whats-new/analytics-toolbox-bigquery/sql-reference/cpg/) of the [Analytics Toolbox for BigQuery](https://docs.carto.com/analytics-toolbox-bigquery/overview/getting-started/) a new function named [FIND\_SIMILAR\_LOCATIONS](https://docs.carto.com/analytics-toolbox-bigquery/sql-reference/cpg/#find_similar_locations) that allows users to identify which locations (e.g. merchants, stores) are more similar to a chosen location (e.g. top performant) based on the characteristics of their surrounding areas (or trade areas), which can be configured to be based on demographic features, environmental, nearby points of interest, footfall, etc. In [this example](https://docs.carto.com/analytics-toolbox-bigquery/examples/similar-locations-iowa/) we illustrate how to use this new analysis function to solve the aforementioned use-case.

<figure><img src="/files/Bgxn3Kp4vvRtlL00gmwl" alt=""><figcaption></figcaption></figure>
{% endupdate %}

{% update date="2022-12-05" tags="improvement,workspace" %}

## Improvements for Google BigQuery connections: re-connect and billing project

We’ve improved some scenarios for users who created a [Google BigQuery connection](https://docs.carto.com/whats-new/carto-user-manual/connections/creating-a-connection/#connection-to-bigquery):

* Now CARTO should behave smoothly when your credentials *(Service Account or OAuth)* have access to **more than 2000 projects**. You should be able to select any of them as your billing project, and the Data Explorer will also let you explore all of them in a quick search.
* Now it’s possible to **repair Google OAuth connections**. Before, if you connected using “Sign in with Google” (often referred as OAuth), this connection could break after this authorization is revoked. This could happen automatically after changing your password, for example. Using the new re-connect flow will authorize CARTO again in the same connection, so all your maps will continue working as usual.
  {% endupdate %}

{% update date="2022-11-29" tags="beta,analytics-toolbox" %}

## Assisted process to install the Analytics Toolbox for Snowflake from the CARTO Workspace

Today we are making available the option for Admin users to install the Analytics Toolbox in their Snowflake accounts with a simplified process assisted by the CARTO UI.

From the Settings section of the CARTO Workspace users can now install, update and uninstall the [Analytics Toolbox for Snowflake](https://docs.carto.com/analytics-toolbox-snowflake/overview/getting-started/) without external support. All details for setting up your Snowflake resources and to carry out the installation process can be found in [our documentation](http://docs.carto.com/analytics-toolbox-snowflake/overview/getting-access/#assisted-installation-from-the-carto-workspace).

{% embed url="<https://player.vimeo.com/video/776177085>" %}
{% endupdate %}

{% update date="2022-11-18" tags="new,developer-tools" %}

## Announcing CARTO for React 1.4.7

A new version of [CARTO for React](https://docs.carto.com/react/overview/) has been released with the following main highlights:

* Support for parameterized queries. Now, a user can define queries that allow for external parameters to be injected into the query and create more powerful dynamic queries without having to modify the SQL; this, will result in filtering being applied from the backend side to the sources and will be reflected in layers and widgets. For more information, a guide has been included in our documentation and can be accessed [here](https://docs.carto.com/react/guides/query-parameters/).
* Several bug fixes.
  {% endupdate %}

{% update date="2022-11-15" tags="new,applications" %}

## Batch simulation of locations in Site Selection application

Batch simulation of candidate locations is now possible in the Site Selection application. Instead of simulating locations one by one, users can now use a CSV template to upload in bulk the location details of their candidates. They can subsequently edit and remove their locations in the application as they see fit before running a batch simulation.

This feature enables users to process in bulk lists of candidate locations often provided by separate research teams, rather than one by one.

{% embed url="<https://player.vimeo.com/video/770839433>" %}
{% endupdate %}

{% update date="2022-11-15" tags="new,applications" %}

## Feature importance widget for revenue predictions in Site Selection application

Users can now explore the impact of the revenue prediction model features directly through the Site Selection application.

For each simulated location and associated predicted revenue, the widget showcases the magnitude of the impact of the features included in the model (i.e. population, mobility, POIs, etc.), as well as whether they contribute to predictions positively or negatively.

{% embed url="<https://player.vimeo.com/video/770832116>" %}
{% endupdate %}

{% update date="2022-11-15" tags="new,builder" %}

## Logarithmic scales in Builder

Logarithmic scales are now available as a data classification option in Builder.

While they’re available for all kind of sources, a logarithmic scales based on powers of `10` will be the default option for [aggregated data sources](https://docs.carto.com/carto-user-manual/maps/data-sources/#aggregated-grids).

This new addition will make it easier to create better cartography when working with spatial indexes, as well as a handy additional method of classification for other types of maps.

<figure><img src="/files/oj6ss2K7eTlBFs5bTNhl" alt=""><figcaption></figcaption></figure>
{% endupdate %}

{% update date="2022-11-07" tags="improvement,workspace" %}

## Geocoding, Isolines and Tokens quotas now available for tracking in Workspace

Following the release of [geocoding and isolines for Google BigQuery](https://docs.carto.com/whats-new/geocoding-and-isolines-in-google-bigquery/), and the [new layout for the Settings](https://docs.carto.com/whats-new/new-layout-in-settings-section/), we’re adding new trackers for quotas in Workspace so users can understand and predict their consumption.

1. We added a new **“CARTO for Developers”** section, including:
   * Existing quota: *Applications*, for applications created using Workspace
   * A new quota: *Tokens*, for tokens generated using the Tokens API
2. We also added a new **“Location Data Services”** section, including tracking for **Geocoding** and **Isolines** operations. These quotas are reset every month, and each unit represents a row processed.
3. Finally, the “Connections” quota was removed, and will be gradually removed so users can create as many connections as needed without any warnings.

<figure><img src="/files/TLP2FXYi2h8kVbd1j77K" alt=""><figcaption></figcaption></figure>
{% endupdate %}

{% update date="2022-11-07" tags="new,builder" %}

## Resolution selector and aggregation methods for categorical data in spatial index layers

Users working with Spatial Indexes data (Quadbin or H3) in Builder have a couple of new additions that will help them create better and more insightful visualizations:

* The possibility of adjusting the aggregation resolution for a finer control over the aggregation.
* Aggregation operations for categories: `MODE` to get the most frequent category in the aggregated cells; `ANY VALUE` to get *any* of the aggregated categories.

{% embed url="<https://player.vimeo.com/video/768188257>" %}
{% endupdate %}

{% update date="2022-10-27" tags="new,analytics-toolbox" %}

## Visualize very large datasets based on H3 thanks to our support for spatial index tilesets in Databricks

Starting today, our Databricks users have the possibility to generate [spatial index tilesets based on H3](https://docs.carto.com/analytics-toolbox-databricks/reference/tiler/#create_spatial_index_tileset) natively in Databricks.

The tiler is a module of our advanced Analytics Toolbox for Databricks that allows to process and visualize very large spatial datasets stored in Databricks. If you are interested in it, please contact with <support@carto.com> to receive more information about it.

{% embed url="<https://player.vimeo.com/video/764328258>" %}
{% endupdate %}

{% update date="2022-10-25" tags="new,analytics-toolbox" %}

## Data Enrichment functions in the Analytics Toolbox for AWS Redshift

Users can now enrich their data tables in Amazon Redshift with features from both their Data Observatory subscriptions and from their other 1st party data tables.

Procedures for Data Enrichment are now included in the Data module of the Analytics Toolbox for Redshift, specific for working with point data, polygons or spatial indexes. Please check out our [documentation](https://docs.carto.com/analytics-toolbox-redshift/sql-reference/data/#data) to find all the details and examples.

{% embed url="<https://player.vimeo.com/video/763824853>" %}
{% endupdate %}

{% update date="2022-10-18" tags="improvement,workspace" %}

## Improvements and new design in login and signup

Continuing our efforts to improve our sign up and login processes, we’re now launching a new experience. Users should be able to join CARTO in a more smooth way with these new additions:

* A screen now will offer users the chance to create a new organization or join an existing one if there are users from the same domain.
* The list of organizations to join now has details about the users, the plan and a search bar to find the desired organization.
* When you [request to join](https://docs.carto.com/carto-user-manual/overview/getting-started/#joining-an-existing-organization) an organization you can now cancel that request (if it was undesired or the admin is unresponsive).
* When following an invitation the signup form will now be already pre-filled.
* The process to join an organization is now simpler with less steps.
* Multiple bug fixes and minor improvements.

<figure><img src="/files/uJjKkWZgLNfjYy8JNJNb" alt=""><figcaption></figcaption></figure>
{% endupdate %}

{% update date="2022-10-18" tags="beta,analytics-toolbox" %}

## Leverage CARTO’s Analytics Toolbox and visualize data natively from your data warehouse without leaving your Python notebook

CARTO now provides a set of [Python packages](http://docs.carto.com/carto-python/overview/) to allow data scientists to work with our platform from within Python notebooks. These packages allow users to work with geospatial data in a fully cloud native way without having to leave their Python environment, and taking advantage of all the potential that [Analytics Toolbox](https://docs.carto.com/analytics-toolbox/about-the-analytics-toolbox/) provides to execute advanced spatial analytics in [Spatial SQL](https://carto.com/spatial-sql/) natively within the leading cloud data warehouse platforms.

{% embed url="<https://player.vimeo.com/video/761440464>" %}
{% endupdate %}

{% update date="2022-10-18" tags="private-beta,builder" %}

## Multiple editor users working on the same map

{% hint style="info" %}
**Update January 13th, 2023:** this feature is now in General Availability and it's available to all CARTO cloud users. [Read all details here](/whats-new#multiple-editor-users-working-on-the-same-map).
{% endhint %}

Collaborating on CARTO maps is finally possible, in asynchronous mode. This is helpful in setups such as production-ready maps, where the original owner might be out of the office; or in situations where the data, analysis, and cartography are each accomplished by different users.
{% endupdate %}

{% update date="2022-10-13" tags="new,workspace" %}

## Spatial Index and Point Aggregation tilesets available from Data Explorer

Starting today, it is available to all users the possibility of generating both Spatial Index and Point Aggregation tilesets on their own data tables directly from the Data Explorer UI. This feature complements the [existing workflow](https://docs.carto.com/carto-user-manual/data-explorer/creating-a-tileset-from-your-data/), with the possibility of generating tilesets of large datasets based on spatial index (H3 and quadbin) and points, by defining aggregations on the interested features. The platform detects automatically if the table is based on spatial indexes or points and provides the new options in the “Create Tileset” wizard.

{% embed url="<https://player.vimeo.com/video/760991749>" %}
{% endupdate %}

{% update date="2022-10-11" tags="new,builder" %}

## New filter to select date ranges in your temporal data when creating maps in Builder

We have just added a new exciting component to Builder. The new [**Date Filter**](/carto-user-manual/maps/sql-parameters) allows you to reduce the size of a data source by selecting a specific time range from a date or timestamp column in your data.

It is available for dynamically tiled data sources, which basically means tables bigger than 30MB and Custom SQL queries. Find more information about data source sizes [here](https://docs.carto.com/carto-user-manual/maps/performance-considerations).

When dealing with temporal series it is very common to find overlapping points, repeated geometries or spatial indexes… which make the analysis and visualization of the data cumbersome and difficult to visualize. This new component lets the user select a specific time range to filter their data, making all these problems easier to work around.

This new filter actually pushes down a SQL filter, which reduces the amount of data processed and transferred, while the [Time-Series widget](/carto-user-manual/maps/widgets/time-series-widget) allows filtering the data when it has already been loaded in the browser. They can play very well together, using the filter to pre-select a time range to work with, and the Time-Series widget for finer client-side filtering, visualizing the series, animations, etc

As an Editor, you can decide whether or not to include the Date selector in the public map. This allows deeper data exploration for viewer and public users.

{% embed url="<https://player.vimeo.com/video/759915982>" %}
{% endupdate %}

{% update date="2022-10-06" tags="beta,analytics-toolbox" %}

## New analytical functions to run Customer Segmentation use-cases for the CPG industry

We have released in beta a new domain-specific module in the [Analytics Toolbox for BigQuery](https://docs.carto.com/analytics-toolbox-bigquery/overview/getting-started/) to solve advanced geospatial analysis for the CPG / FMCG sector, starting with [customer segmentation](https://docs.carto.com/analytics-toolbox-bigquery/sql-reference/cpg/). We now offer a set of procedures that allow users in that industry to solve this use-case end-to-end, from the generation of trade areas to running multiple segmentation scenarios of merchants based on a customisable set of spatial features. In this [recent blogpost](https://carto.com/blog/trade-area-analysis-cpg-merchants/) we showcase how to use these analytical routines with a specific example.

<figure><img src="/files/MuY3jAmjSyxxVKzTBzif" alt=""><figcaption></figcaption></figure>
{% endupdate %}

{% update date="2022-09-19" tags="new,builder" %}

## Custom Markers in Builder

Now users can include [custom icons as marker](/carto-user-manual/maps/layers/point)[s](/carto-user-manual/maps/layers/point) for point data in Builder maps.This feature includes two differents ways of selecting an icon:

* Using one from our preset collection; based on the well-known Maki icon library, which is designed for cartography purposes;
* Uploading a custom icon in .png or .svg formats.

Different markers can also be defined by the values of a categorical column, and can even be rotated based on a numeric value; which enables different use-cases such as rotating an arrow based on azimuth for telecommunication antennas or the wind direction in weather maps.

{% embed url="<https://player.vimeo.com/video/759208322?h=a7525f3a09>" %}
{% endupdate %}

{% update date="2022-09-16" tags="improvement,apis" %}

## Caching performance improvements

We have released a few changes in how we cache API requests in the CDN that will produce a significant improvement in the overall performance of the platform; specifically applying to Builder maps and applications developed using our APIs. Learn more about such changes in our documentation for developers at [api-docs.carto.com](https://api-docs.carto.com/); each end-point in Maps API and SQL API now contains a reference about our caching strategies.

In Builder, users have new a couple of new features:

* “Refresh data source”: to make sure users get non-cached versions of the data. Note that with this option your map will be skipping the CDN and getting the data each time from your data warehouse.
* “Refresh data source every X”: to allow the user to control the update frequency of the data displayed on public maps.

<figure><img src="/files/B1m6H4qlWBuT04G4SqCZ" alt=""><figcaption></figcaption></figure>
{% endupdate %}

{% update date="2022-09-15" tags="improvement,workspace" %}

## New layout in Settings section

We have improved the layout in the Settings section in the CARTO Workspace; providing a better way to organize different areas by topic and providing a smoother interface for explaining the different Settings options for your CARTO account.

<figure><img src="/files/pYwBccS4y33JkqAIngkK" alt=""><figcaption></figcaption></figure>
{% endupdate %}

{% update date="2022-09-13" tags="improvement,apis" %}

## Performance improvements in Dynamic Tiling

A couple important fixes have been implemented to our [Dynamic Tiling](https://docs.carto.com/carto-user-manual/maps/performance-considerations/#medium-size-datasets-and-sql-queries) strategies. Dynamic Tiling is the technology CARTO has developed to dynamically generate tiles for medium sized dataset and layers loaded as SQL Queries from your cloud data warehouse.

* When working with points, many times widgets were not showing data due to our “visual aggregation” strategy when points were very close to each other. We have now removed this type of aggregation, and we are only applying a limit of 200k points per tile to prevent performance issues. If now you encounter widgets not showing data, you just need to zoom in to reduce the number of points per tile.
* With our previous strategy some polygons or lines that were falling in the intersection of multiple tiles were splitted for visualization purposes, which was making the same data point count multiple times in widgets. We have solved this problem by asking the user to identify a unique id property for the data source at the time of creating widgets.

<figure><img src="/files/KEb02KTcD2vfFWaDWkHz" alt=""><figcaption></figcaption></figure>
{% endupdate %}

{% update date="2022-09-07" tags="improvement,workspace" %}

## Improvements in invitation & request management for Admin users

As part of an active taskforce to improve our sign up and login processes, we have now released an improved interface for Admin users to [manage invitations](https://docs.carto.com/carto-user-manual/settings/inviting-users-to-your-organization/) to join the CARTO organization and to manage user requests to join it.

<figure><img src="/files/JRe9JaRltDauvbmGpbzT" alt=""><figcaption></figcaption></figure>
{% endupdate %}

{% update date="2022-08-26" tags="new,analytics-toolbox,builder,workspace" %}

## Geocoding and isolines in Google BigQuery

We are very excited to announce that users of Google BigQuery can now geocode their tables with address data and create trade areas around locations based on drive/walk time isolines natively from their data warehouse. These procedures call external location data service providers such as TomTom, HERE and Mapbox. Please check the [SQL Reference](https://docs.carto.com/analytics-toolbox-bigquery/sql-reference/lds/) of our [Analytics Toolbox for BigQuery](https://docs.carto.com/analytics-toolbox-bigquery/overview/getting-started/) for more details, and also refer to our examples on how to [geocode your data](https://docs.carto.com/analytics-toolbox-bigquery/examples/geocoding-your-address-data/) and [create isolines](https://docs.carto.com/analytics-toolbox-bigquery/examples/trade-areas-based-on-isolines/).

Note that these functionalities are also enabled from the Data Explorer and Builder tools.

{% embed url="<https://player.vimeo.com/video/760993303>" %}
{% endupdate %}

{% update date="2022-08-26" tags="new,analytics-toolbox" %}

## Geostatistics functions in the Analytics Toolbox for AWS Redshift

Users of AWS Redshift can now access a new set of [geostatistics functions](https://docs.carto.com/analytics-toolbox-redshift/sql-reference/statistics/) to expand the spatial capabilities of their data warehouse with CARTO’s Analytics Toolbox. We have released [Getis-ord Gi\*](https://docs.carto.com/analytics-toolbox-redshift/sql-reference/statistics/#getis_ord_quadbin), [Moran’s I](https://docs.carto.com/analytics-toolbox-redshift/sql-reference/statistics/#morans_i_quadbin) and [p-value](https://docs.carto.com/analytics-toolbox-redshift/sql-reference/statistics/#p_value) methods that can run natively with your data hosted in Redshift. Learn more about these analytical functions in our [product documentation](https://docs.carto.com/analytics-toolbox-redshift/sql-reference/statistics/).
{% endupdate %}

{% update date="2022-08-05" tags="new,builder" %}

## New Range widget in Builder

From today, users of Builder can add a new type of widgets to their interactive maps. The [Range widget](/carto-user-manual/maps/widgets/range-widget) allows you to filter data based on precise numeric ranges.

{% embed url="<https://player.vimeo.com/video/759208408?h=1900194ed7>" %}
{% endupdate %}

{% update date="2022-08-04" tags="new,analytics-toolbox" %}

## Cannibalization Analysis available in the Retail module of the Analytics Toolbox for BigQuery

Retailers working with Google BigQuery and CARTO can now analyze the potential cannibalization cased by a set of new stores into their existing networks, based on the overlap of the different trade areas in terms of geographic area but also in terms of any other spatial feature that the user wants to use in the analysis (e.g. population, number of households). Check out [our documentation](https://docs.carto.com/analytics-toolbox-bigquery/sql-reference/retail/#cannibalization_overlap) and [this example](https://docs.carto.com/analytics-toolbox-bigquery/examples/store-cannibalization/) to learn more about how to run this analysis with our [Analytics Toolbox for BigQuery](https://docs.carto.com/analytics-toolbox-bigquery/overview/getting-started/).

<figure><img src="/files/dINxndkN36wMG0IuKRLV" alt=""><figcaption></figcaption></figure>
{% endupdate %}

{% update date="2022-07-28" tags="improvement,builder" %}

## Renaming of data sources in Builder

Users can now rename the [data sources](https://docs.carto.com/carto-user-manual/maps/data-sources/#data-sources) added to a Builder map; although seemingly a small product addition, this new feature brings a big improvement in terms of user experience for our users.

{% embed url="<https://player.vimeo.com/video/759208440?h=9576b51762>" %}
{% endupdate %}

{% update date="2022-07-15" tags="improvement,workspace" %}

## New Data Explorer UI

We have introduced a new design in the [Data Explorer](https://docs.carto.com/carto-user-manual/data-explorer/introduction/) that brings a good amount of improvements for our users: it allows to search and sort data objects within connections, provides pagination and infinite scrolling for connections with access to thousands of tables, facilitates access to Data Observatory subscriptions, includes shortcuts for creating new connections and importing data, etc.

<figure><img src="/files/ASCCLkAaSExu0kSj7Fdm" alt=""><figcaption></figcaption></figure>
{% endupdate %}

{% update date="2022-07-15" tags="new,analytics-toolbox" %}

## Spatial Index tilesets for Postgresql

Postgresql users can now generate tilesets based on spatial index data (i.e. H3, Quadbin) natively in their databases. This [new functionality](https://docs.carto.com/analytics-toolbox-postgres/sql-reference/tiler/#create_spatial_index_tileset) from our [Analytics Toolbox for Postgresql](https://docs.carto.com/analytics-toolbox-postgres/overview/getting-started/) enables our users to build high performance data visualizations from very large datasets. Check out [this example](https://docs.carto.com/analytics-toolbox-postgres/examples/creating-spatial-index-tilesets/) to learn more about how to use this feature.

<figure><img src="/files/BAo79qr2uKaqeFg7tbjZ" alt=""><figcaption></figcaption></figure>
{% endupdate %}

{% update date="2022-07-12" tags="new,developer-tools" %}

## CARTO for React 1.3

We are excited to announce a new release of our CARTO for React library, packed with awesome new features to extend the CARTO platform and provide more capabilities for building custom solutions:

* We have added support for [spatial indexes](https://docs.carto.com/react/guides/data-sources#spatial-indexes), so now you can visualize layers and add widgets when you are working with datasets using H3 and Quadbin indexes, in addition to traditional geometries. This is specially useful when you are dealing with large datasets.
* We have support now for dynamic tiling. By default the CartoLayer will work with [dynamic tiles](https://docs.carto.com/react/guides/upgrade-guide/) and the widgets have been updated to work with them.
* Widgets now have two different [modes](https://docs.carto.com/react/guides/widgets#modes-behavior): viewport and global.
* The [GeocoderWidget](https://docs.carto.com/react/library-reference/widgets#geocoderwidget) now is compatible with the new [LDS API](https://api-docs.carto.com/#f70786a4-8d69-46f3-9794-4e021ab43df8).
* We have a new [BarWidget](https://docs.carto.com/react/library-reference/widgets#barwidget) to display categorical/qualitative data using vertical bars.
  {% endupdate %}

{% update date="2022-07-08" tags="new,workspace" %}

## Sharing maps and connections with groups

You can now synchronize the user groups coming from your Single Sign-On (SSO) directory (e.g. SAML, LDAP, etc.) with CARTO. Thanks to this new feature users can now share maps and connections with those inherited groups. You can access full details in our documentation on [sharing with groups](https://docs.carto.com/carto-user-manual/maps/publishing-and-sharing-maps/#sharing-with-certain-groups) and [group management](https://docs.carto.com/carto-user-manual/settings/managing-user-groups/).

<figure><img src="/files/zjPw1S6Ub4Wc8AkmiZZP" alt=""><figcaption></figcaption></figure>
{% endupdate %}

{% update date="2022-07-07" tags="new,builder" %}

## Custom Pop-ups in Builder maps

We have released a new feature for [pop-up windows](/carto-user-manual/maps/interactions) in Builder maps. Now users can customize their pop-ups using HTML and a templating system that allows accessing feature’s properties. This kind of flexibility allows users to add dynamic content to their maps, such as: Google Street View images, custom links based on data properties, images, logos, GIFs, etc. Check out this [blogpost](https://carto.com/blog/google-street-view-pop-ups-with-carto/) to see some examples of this feature in action.

{% embed url="<https://player.vimeo.com/video/759208359?h=ab6839b29d>" %}
{% endupdate %}

{% update date="2022-07-01" tags="new,developer-tools" %}

## CARTO for deck.gl 8.8

We are really happy to announce a new release of “CARTO for deck.gl” to allow developers to build even more awesome apps and map visualizations with the CARTO platform. This new release comes from:

* Support in the CartoLayer for datasets using spatial indexes such as H3 and Quadbin. You can now build visualizations with very large datasets without the need of geometry data at an incredible performance and reduced costs.
* You can now leverage our Dynamic Tiling system with SQL Queries, providing great scaling capabilities to your maps.
* deck.gl code base is now migrated to TypeScript. This improves the robustness and maintainability of TypeScript apps using deck.gl as well as the deck.gl codebase itself.

{% embed url="<https://player.vimeo.com/video/759208307?h=1cf5523cb0>" %}
{% endupdate %}
{% endupdates %}


# FAQs

Frequently Asked Questions about the CARTO platform and its components.

## **CARTO Accounts**

* [What is the new version of the CARTO platform?](/faqs/accounts#what-is-the-new-version-of-the-carto-platform)
* [Is the previous version of CARTO going to be deprecated?](/faqs/accounts#is-the-previous-version-of-carto-going-to-be-deprecated)
* [How can I log into the legacy CARTO platform?](/faqs/accounts#how-can-i-log-into-the-legacy-carto-platform)
* [Can I login to both versions of the CARTO platform with the same credentials?](/faqs/accounts#can-i-login-to-both-versions-of-the-carto-platform-with-the-same-credentials)
* [Will all my data in the previous platform be readily available when I access the new version of CARTO?](/faqs/accounts#will-all-my-data-in-the-previous-platform-be-readily-available-when-i-access-the-new-version-of-cart)
* [Will I be forced to move all my data to the new version of the CARTO platform?](/faqs/accounts#will-i-be-forced-to-move-all-my-data-to-the-new-version-of-the-carto-platform)
* [Is CARTO’s Student Package still available?](/faqs/accounts#is-cartos-student-package-still-available)
* [Can I setup a Single Sign-On integration in the new platform?](/faqs/accounts#can-i-setup-a-single-sign-on-integration-in-the-new-platform)
* [Where can I see my current quotas and usage?](/faqs/accounts#where-can-i-see-my-current-quotas-and-usage)

## **Migration to the new platform**

* [Why should I migrate to the new version of the CARTO platform?](/faqs/migration-to-the-new-platform#why-should-i-migrate-to-the-new-version-of-the-carto-platform)
* [Is CARTO going to provide me assistance if I would like to migrate to the new platform?](/faqs/migration-to-the-new-platform#is-carto-going-to-provide-me-assistance-if-i-would-like-to-migrate-to-the-new-platform)
* [What type of objects can be migrated between platforms?](/faqs/migration-to-the-new-platform#what-type-of-objects-can-be-migrated-between-platforms)
* [Can I migrate my maps from the previous version to the new version of CARTO?](/faqs/migration-to-the-new-platform#can-i-migrate-my-maps-from-the-previous-version-to-the-new-version-of-carto)
* [What information will you need to provide to receive assistance with the migration?](/faqs/migration-to-the-new-platform#what-information-will-you-need-to-provide-to-receive-assistance-with-the-migration)
* [Do I need to provide an authorization for CARTO to work on my platform migration?](/faqs/migration-to-the-new-platform#do-i-need-to-provide-an-authorization-for-carto-to-work-on-my-platform-migration)
* [If my data tables are migrated to the CARTO Data Warehouse in the new platform, are there any associated costs with its usage?](/faqs/migration-to-the-new-platform#if-my-data-tables-are-migrated-to-the-carto-data-warehouse-in-the-new-platform-are-there-any-associa)
* [Will the platform migration tasks interfere with the standard service?](/faqs/migration-to-the-new-platform#will-the-platform-migration-tasks-interfere-with-the-standard-service)

## Users & account setup

* [My screen is stuck on the "Creating an Organization" page.](/faqs/user-and-organization-setup#my-screen-is-stuck-on-the-creating-an-organization-page)
* [How can I join an existing organization on CARTO?](/faqs/user-and-organization-setup#how-can-i-join-an-existing-organization-on-carto)
* [Can I be a member of multiple CARTO organizations?](/faqs/user-and-organization-setup#can-i-be-a-member-of-multiple-carto-organizations)
* [I have previously used CARTO (including signing up for a free trial). Can I create a new organization or user with the same email?](https://docs.carto.com/pages/YpAygBR0PIl9E5gxW7KV#i-have-previously-used-carto-including-signing-up-for-a-free-trial-.-can-i-create-a-new-organization)
* [Can I extend my free trial to longer than 14 days?](/faqs/user-and-organization-setup#can-i-extend-my-free-trial-to-longer-than-14-days)
* [Can I start multiple free trials with CARTO?](/faqs/user-and-organization-setup#can-i-start-multiple-free-trials-with-carto)

## **General**

* [What cloud data warehouses can I use with CARTO?](/faqs/workspace#what-cloud-data-warehouses-can-i-use-with-carto)
* [What are the device/web browser requirements for CARTO?](/faqs/workspace#what-are-the-device-web-browser-requirements-for-carto)
* [When I connect to a data warehouse, do you copy or store any data?](/faqs/workspace#when-i-connect-to-a-data-warehouse-do-you-copy-or-store-any-data)
* [What happens if I do not have any cloud data warehouse platform to connect?](/faqs/workspace#what-happens-if-i-do-not-have-any-cloud-data-warehouse-platform-to-connect)
* [Can I import geospatial files into CARTO’s new platform?](/faqs/workspace#can-i-import-geospatial-files-into-cartos-new-platform)
* [What are the Location Data Services (LDS) providers configured by default in a CARTO organization?](#general)

## **Builder**

* [What methods can I use to create a map layer?](/faqs/builder#what-methods-can-i-use-to-create-a-map-layer)
* [How can I run spatial analyses in Builder?](/faqs/builder#how-can-i-run-spatial-analyses-in-builder)
* [How does the export mechanism from Builder works?](#how-does-the-export-mechanism-from-builder-works)

## Workflows

* [When creating a new workflow, I cannot see the data sources available in my connection - what may be happening?](/faqs/workflows#when-creating-a-new-workflow-i-cannot-see-the-data-sources-available-in-my-connection-what-may-be-ha)
* [Working with my data sources from a BigQuery connection I receive an error message about not having permissions to query the table or that the table does not exist on a specific region - What may be happening?](/faqs/workflows#working-with-my-data-sources-from-a-bigquery-connection-i-receive-an-error-message-about-not-having)
* [Working with my data sources from a Snowflake connection I receive the following error message: "cannot get Workflow schema" - What may be happening?](/faqs/workflows#working-with-my-data-sources-from-a-snowflake-connection-i-receive-the-following-error-message-canno)
* [My workflow is producing the error message “No value assigned.” What could be causing this?](https://docs.carto.com/pages/DZ4UBfLTuI0ccXtBWiS1#my-workflow-is-producing-the-error-message-no-value-assigned.-what-could-be-causing-this)

## **Data Observatory**

* [Can I license premium data with a trial or student account?](/faqs/data-observatory#can-i-license-premium-data-with-a-trial-individual-or-student-account)
* [Are premium data subscriptions based on perpetual licenses?](/faqs/data-observatory#are-premium-data-subscriptions-based-on-perpetual-licenses)
* [Can I export the data from CARTO and use it on other platforms?](/faqs/data-observatory#can-i-export-the-data-from-carto-and-use-it-on-other-platforms)

## **Analytics Toolbox**

* [What is CARTO’s Analytics Toolbox?](/faqs/analytics-toolbox#what-is-cartos-analytics-toolbox)
* [How can I use the functions available in the Analytics Toolbox?](/faqs/analytics-toolbox#how-can-i-use-the-functions-available-in-the-analytics-toolbox)
* [Can I use the Analytics Toolbox from the CARTO Data Warehouse connection?](/faqs/analytics-toolbox#can-i-use-the-analytics-toolbox-from-the-carto-data-warehouse-connection)
* [In the Analytics Toolbox for BigQuery, are there differences when using it from different GCP regions?](/faqs/analytics-toolbox#in-the-analytics-toolbox-for-bigquery-are-there-differences-when-using-it-from-different-gcp-regions)

## **Development Tools**

* [What frameworks and libraries can I use for developing custom apps with CARTO?](/faqs/development-tools#what-frameworks-and-libraries-can-i-use-for-developing-custom-apps-with-carto)
* [Are “CARTO for deck.gl” and “CARTO for React” compatible with the new version of the platform?](https://docs.carto.com/pages/p8BaYli2tNgoTXw3XKFs#are-carto-for-deck.gl-and-carto-for-react-compatible-with-the-new-version-of-the-platform)
* [Does CARTO provide an SDK for the development of Mobile applications?](/faqs/development-tools#does-carto-provide-an-sdk-for-the-development-of-mobile-applications)

## **Deployment Options**

* [What are the different deployment options for the CARTO platform?](/faqs/deployment-options#what-are-the-different-deployment-options-for-the-carto-platform)
* [Where can I find information about the requirements for deploying CARTO as Self-hosted?](/faqs/deployment-options#where-can-i-find-information-about-the-requirements-for-deploying-carto-as-self-hosted)
* [How are updates and product releases managed in a Self-hosted deployment?](/faqs/deployment-options#how-are-updates-and-product-releases-managed-in-a-self-hosted-deployment)
* [Where can I find information about deploying CARTO with Snowflake Container Services?](/faqs/deployment-options#where-can-i-find-information-about-deploying-carto-with-snowflake-container-services)

## **Support Packages**

* [What support packages are available at CARTO?](/faqs/support-packages#what-support-packages-are-available-at-carto)
* [Who is entitled to Support?](/faqs/support-packages#who-is-entitled-to-support)
* [What are CARTO Business Hours?](/faqs/support-packages#what-are-carto-business-hours)
* [What are Customer Success Managers (CSMs)?](/faqs/support-packages#what-are-customer-success-managers-csms)
* [How to submit an issue to our Support team?](/faqs/support-packages#how-to-submit-an-issue-to-our-support-team)
* [What is the issue and severity classification?](/faqs/support-packages#what-is-the-issue-and-severity-classification)
* [What are CARTO’s Target Response Times (business hours)?](/faqs/support-packages#what-are-cartos-target-response-times-business-hours)

## **CARTO Basemaps**

* [Does CARTO provide a basemap service?](/faqs/carto-basemaps#does-carto-provide-a-basemap-service)
* [What is the pricing for CARTO basemaps? Is it free?](#what-is-the-pricing-for-carto-basemaps-is-it-free)
* [How frequently does CARTO update its basemaps?](#how-frequently-does-carto-update-its-basemaps)
* [Can I use other basemaps in CARTO?](#can-i-use-other-basemaps-in-carto)

## **CARTO for Education**

* [How can I get a Student account in CARTO?](/faqs/carto-for-education#how-can-i-get-a-student-account-in-carto)
* [How can I get an Educator account?](/faqs/carto-for-education#how-can-i-get-an-educator-account)
* [We need Enterprise capabilities for our institution or academic research, can you help?](/faqs/carto-for-education#we-need-enterprise-capabilities-for-our-institution-or-academic-research-can-you-help)
* [What is the process for getting a CARTO Student account?](/faqs/carto-for-education#what-is-the-process-for-getting-a-carto-student-account)
* [I am an educator and my course materials use the previous version of CARTO. What can I do?](https://docs.carto.com/pages/l5e2QX8UeoNbf9fcV8sV#i-am-an-educator-and-my-course-materials-use-the-previous-version-of-carto.-what-can-i-do)

## Security and Compliance

* [Is the CARTO Platform SOC 2 Type II-certified?](/faqs/security-and-compliance#is-the-carto-platform-soc-2-type-ii-certified)
* [Does it comply with GDPR, CCPA and other data privacy laws?](/faqs/security-and-compliance#does-it-comply-with-gdpr-ccpa-and-other-data-privacy-laws)
* [What are the password and login management controls in CARTO?](/faqs/security-and-compliance#what-are-the-password-and-login-management-controls-in-carto)
* [When we create a connection to CARTO, does it make any copies of our data?](/faqs/security-and-compliance#when-we-create-a-connection-to-carto-does-it-make-any-copies-of-our-data)
* [How does CARTO manage user data?](/faqs/security-and-compliance#how-does-carto-manage-user-data)
* [Where is my data stored?](/faqs/security-and-compliance#where-is-my-data-stored)
* [How does CARTO manage security when a map, a workflow or an application are shared?](/faqs/security-and-compliance#how-does-carto-manage-security-when-a-map-workflow-or-an-application-are-shared)


# Accounts

[What is the new version of the CARTO platform?](#what-is-the-new-version-of-the-carto-platform)

[Is the previous version of CARTO going to be deprecated?](#is-the-previous-version-of-carto-going-to-be-deprecated)

[How can I log into the legacy CARTO platform?](#how-can-i-log-into-the-legacy-carto-platform)

[What happens to my current CARTO subscription? Will I have to pay extra to access the new platform?](#what-happens-to-my-current-carto-subscription-will-i-have-to-pay-extra-to-access-the-new-platform)

[Can I login to both versions of the CARTO platform with the same credentials?](#can-i-login-to-both-versions-of-the-carto-platform-with-the-same-credentials)

[Will all my data in the previous platform be readily available when I access the new version of CARTO?](#will-all-my-data-in-the-previous-platform-be-readily-available-when-i-access-the-new-version-of-cart)

[Will I be forced to move all my data to the new version of the CARTO platform?](#will-i-be-forced-to-move-all-my-data-to-the-new-version-of-the-carto-platform)

[Is CARTO’s Student Package still available?](#is-cartos-student-package-still-available)

[Can I setup a Single Sign-On integration in the new platform?](#can-i-setup-a-single-sign-on-integration-in-the-new-platform)

[Where can I see my current quotas and usage?](#where-can-i-see-my-current-quotas-and-usage)

***

#### **What is the new version of the CARTO Platform?**

In October 2021, we launched a fully revamped version of the [CARTO platform](http://www.carto.com/carto3/). The new platform offers a complete cloud native experience, allowing to run CARTO on top of the leading cloud data warehouse platforms (e.g. Google BigQuery, AWS Redshift, Snowflake, Databricks, Oracle, etc.), eliminating ETL complexity and limits on scalability.

This new platform works completely independent of the previous version of CARTO; hence, requires a different set of user credentials to access. You can learn more about the new platform with our [User Manual](https://docs.carto.com/carto-user-manual/overview/getting-started/#getting-started).

***

#### **Is the previous version of CARTO going to be deprecated?**

No, we don’t have plans to deprecate the previous version of our platform for our existing Enterprise customers, so you don’t need to worry about that now. However, it is important to note that any new product developments will happen only in the new version of CARTO.

You can continue to login to the previous version of CARTO from [this page](https://carto.com/login).

Free trials for the new CARTO platform are already available on our [Sign up page](http://www.carto.com/signup). We also welcome all of our existing enterprise customers to contact us so we can provision them an account to the new platform for the reminder of their subscription term.

***

#### **How can I log into the legacy CARTO platform?**

Although direct login to the legacy platform was removed from CARTO's website homepage in February 2024, you can continue to log into your account in the previous version of CARTO from [this page](https://carto.com/login).

***

#### **What happens to my current CARTO subscription? Will I have to pay extra to access the new platform?**

If you are an existing CARTO Enterprise customer, we will give you an account to the new version of our platform without any additional cost for the reminder of your subscription term. Please get in touch with your CARTO representative or our Support team and we will provision you an enterprise account to the new platform according to your subscription plan.

***

#### **Can I login to both versions of the CARTO platform with the same credentials?**

No, the two platforms are completely independent, and hence they require their own set of credentials to login. In our login page users can select which version of CARTO they want to access. To access your old account, select “CARTO Dashboard”.

***

#### **Will all my data in the previous platform be readily available when I access the new version of CARTO?**

No, by default it is not. Both versions of the platform are completely independent. Get in touch with your CARTO representative or our Support team, and we can assist you to migrate your datasets across our two platform versions.

***

#### **Will I be forced to move all my data to the new version of the CARTO platform?**

No, you won’t. If you are an existing CARTO customer you can enjoy both versions of the platform. If you are an existing enterprise customer, and you would like to make available in the new platform some of the tables you have in your existing account, please get in touch with your CARTO representative or our Support team, and we can assist you to migrate data across our two platform versions.

***

#### **Is CARTO’s Student Package still available?**

Yes, it is. Check [our guide here](https://docs.carto.com/faqs/categories/carto-for-education/) and learn how to activate your CARTO Student account using the Github Student Developer Pack.

***

#### **Can I setup a Single Sign-On integration in the new platform?**

Yes, check all the details in [our SSO documentation](/carto-user-manual/settings/sso). To get started, just get in touch with your contact or with <support@carto.com> and we’ll guide you through the process. In the end, users in your organization will see your SSO integration as the only way to access your organization.

***

#### **Where can I see my current quotas and usage?**

To understand the current plan limits (quotas) and how far are you from reaching them, there’s a section located in Workspace > Settings > Subscription > Quotas where you can check all this information at any time. Check [Understanding your Organization Quotas](/carto-user-manual/settings/understanding-your-organization-quotas) for examples and more information.


# Migration to the new platform

[Why should I migrate to the new version of the CARTO platform?](https://docs.carto.com/faqs/categories/migration-to-the-new-platform/#why-should-i-migrate-to-the-new-version-of-the-carto-platform)

[Is CARTO going to provide me assistance if I would like to migrate to the new platform?](https://docs.carto.com/faqs/categories/migration-to-the-new-platform/#is-carto-going-to-provide-me-assistance-if-i-would-like-to-migrate-to-the-new-platform)

[What type of objects can be migrated between platforms?](https://docs.carto.com/faqs/categories/migration-to-the-new-platform/#what-type-of-objects-can-be-migrated-between-platforms)

[Can I migrate my maps from the previous version to the new version of CARTO?](https://docs.carto.com/faqs/categories/migration-to-the-new-platform/#can-i-migrate-my-maps-from-the-previous-version-to-the-new-version-of-carto)

[What information will you need to provide to receive assistance with the migration?](https://docs.carto.com/faqs/categories/migration-to-the-new-platform/#what-information-will-you-need-to-provide-to-receive-assistance-with-the-migration)

[Do I need to provide an authorization for CARTO to work on my platform migration?](https://docs.carto.com/faqs/categories/migration-to-the-new-platform/#do-i-need-to-provide-an-authorization-for-carto-to-work-on-my-platform-migration)

[If my data tables are migrated to the CARTO Data Warehouse in the new platform, are there any associated costs with its usage?](https://docs.carto.com/faqs/categories/migration-to-the-new-platform/#if-my-data-tables-are-migrated-to-the-carto-data-warehouse-in-the-new-platform-are-there-any-associated-costs-with-its-usage)

[Will the platform migration tasks interfere with the standard service?](https://docs.carto.com/faqs/categories/migration-to-the-new-platform/#will-the-platform-migration-tasks-interfere-with-the-standard-service)

***

#### **Why should I migrate to the new version of the CARTO platform?**

The new platform offers you a complete cloud native experience, and unparalleled geospatial analysis and visualization capabilities on top of the leading cloud data warehouse platforms (i.e. Google BigQuery, Snowflake, AWS Redshift, Oracle and Databricks), eliminating the need of complex ETLs and the limits of scalability that our previous platform had.

In the new CARTO, we have implemented a new and more powerful version of CARTO Builder, further advanced our Data Observatory and Development tools, and created a new suite of geospatial analytics functions that can be run natively in the aforementioned cloud data warehouse platforms.

Our teams are currently laser focused on evolving both functionality and user experience to make the new CARTO the most powerful spatial analytics platform available in the market. Although we currently do not have any plans to deprecate the previous version, **we recommend you to start your new projects in the new CARTO platform**. CARTO will not be doing any further developments on the components of the old version of the platform, which will remain “as is”.

***

#### **Is CARTO going to provide me assistance if I would like to migrate to the new platform?**

CARTO offers technical assistance for platform migrations to all our enterprise customers at no additional cost. If you have an Enterprise plan and you would like our assistance to migrate to the new version of our platform, please contact your CARTO representative or the Support team at <support@carto.com>.

***

#### **What type of objects can be migrated between platforms?**

We can only offer migration support between platform versions for data tables and your active Data Observatory subscriptions.

***

#### **Can I migrate my maps from the previous version to the new version of CARTO?**

No. Unfortunately, since the technology stack between platforms is completely different, we cannot offer compatibility of maps built in the previous version of CARTO with our new technology. If you have TAM hours in your Support package, please ask your Customer Success Manager for an evaluation of the effort required to build your maps in the new platform.

***

#### **What information will you need to provide to receive assistance with the migration?**

In order for us to assist you with the migration to the new CARTO platform, we will need to receive the following information about your CARTO account in the previous version of the platform:

* The name(s) of the CARTO organization(s) in the previous version of the platform that you want to migrate to the new version;
* The name of the CARTO organization in the new platform to which you want to migrate your data to;
* A list of the data tables to migrate;
* An estimate on the size of the tables that you want to migrate;
* Whether you have a cloud data warehouse from the supported ones (i.e. Google BigQuery, AWS Redshift, Snowflake, Databricks, Oracle) or your own PostgreSQL database to which you want to migrate the data to use it with the new platform. If not, we will migrate your data to your instance in the [CARTO Data Warehouse](https://docs.carto.com/carto-user-manual/connections/carto-data-warehouse/).

***

#### **Do I need to provide an authorization for CARTO to work on my platform migration?**

Yes. For us to be able to actively assist you with the platform migration, we will need you to send us a written authorization with the following text in order to give us the required permissions:

{% hint style="info" %}
**Authorization**

“I request CARTO to create an additional Editor user in my CARTO organization account on the new platform version.

This Editor user will be only used by the CARTO team to migrate my data from the previous version of CARTO to the new platform (“Migration Services”).

I also grant CARTO access to my organization account {NAME OF THE ACCOUNT} in the previous platform version of CARTO as part of the Migration Services.

Once the Migration Services are completed, CARTO will hand over the tables created and will remove the additional Editor user created in my CARTO organization account.

CARTO’s team will only have access to the data in my CARTO accounts in order to perform the Migration Services.”
{% endhint %}

#### **If my data tables are migrated to the CARTO Data Warehouse in the new platform, are there any associated costs with its usage?**

CARTO provides an instance of the CARTO Data Warehouse and monthly usage quotas with every subscription plan depending on the tier. Please get in touch with your CARTO representative to understand the service level associated with your subscription plan. You can read more information on this topic [here](https://docs.carto.com/carto-user-manual/connections/carto-data-warehouse/).

***

#### **Will the platform migration tasks interfere with the standard service?**

Any task associated with the platform migration is not expected to interfere with your CARTO service. In any case, CARTO will agree with you on a timeframe to carry out the migration activities, so you are completely informed on when these will be performed and therefore reduce the chances of any interference with your own usage of your CARTO accounts.


# User & organization setup

[My screen is stuck on the "Creating an Organization" page.](#my-screen-is-stuck-on-the-creating-an-organization-page)

[How can I join an existing organization on CARTO?](#how-can-i-join-an-existing-organization-on-carto)

[Can I be a member of multiple CARTO organizations?](#can-i-be-a-member-of-multiple-carto-organizations)

[I have previously used CARTO (including signing up for a free trial). Can I create a new organization or user with the same email?](#i-have-previously-used-carto-including-signing-up-for-a-free-trial-.-can-i-create-a-new-organization)

[Can I extend my free trial to longer than 14 days?](#can-i-extend-my-free-trial-to-longer-than-14-days)

[Can I start multiple free trials with CARTO?](#can-i-start-multiple-free-trials-with-carto)

***

### My screen is stuck on the "Creating an Organization" page.

If you have never signed up for CARTO before, this can normally be fixed by clearing your browser’s cache. If you have previously used CARTO or created another CARTO organization - including a free trial - please see the FAQs below.

***

### How can I join an existing organization on CARTO?

A CARTO user with an admin role from your organization will be able to add you to their organization through the CARTO Workspace via Settings > Users and Groups.

If you have a previous or existing CARTO login (including free trials) which are not attached to this organization, you will not be able to immediately join. In this instance, you should contact your customer success manager or <support@carto.com> who can help you.

***

### Can I be a member of multiple CARTO organizations?

You cannot join multiple CARTO organizations with the same email address. If you have a requirement like this, you should contact your customer success manager or <support@carto.com> who can help you.

***

### I have previously used CARTO (including signing up for a free trial). Can I create a new organization or user with the same email?

CARTO accounts are currently limited to one account per email, including historic accounts. If you have specific requirements around this, please contact your customer success manager or <support@carto.com> who can help you.

If you are attending a CARTO event where a free trial is a requirement, please contact the event organizers who will be able to coordinate this for you.

***

### Can I extend my free trial to longer than 14 days?

In most cases free trials are limited to 14 days. Please fill in our [Request a demo](https://carto.com/request-live-demo) form to discuss your requirements if you weren’t able to evaluate the platform within 14 days.

***

### Can I start multiple free trials with CARTO?

Free trials are limited to one per user. Please fill in our [Request a demo](https://carto.com/request-live-demo) form to discuss your requirements if you weren’t able to evaluate the platform with a single trial.

If you are attending a CARTO event where a free trial is a requirement, please contact the event organizers who will be able to coordinate this for you.


# General

[What cloud data warehouses can I use with CARTO?](#what-cloud-data-warehouses-can-i-use-with-carto)

[What are the device/web browser requirements for CARTO?](#what-are-the-device-web-browser-requirements-for-carto)

[When I connect to a data warehouse, do you copy or store any data?](#when-i-connect-to-a-data-warehouse-do-you-copy-or-store-any-data)

[What happens if I do not have any cloud data warehouse platform to connect?](#what-happens-if-i-do-not-have-any-cloud-data-warehouse-platform-to-connect)

[Can I import geospatial files into CARTO’s new platform?](#can-i-import-geospatial-files-into-cartos-new-platform)

[What are the Location Data Services (LDS) providers configured by default in a CARTO organization?](#what-are-the-location-data-services-lds-providers-configured-by-default-in-a-carto-organization)

***

#### **What cloud data warehouses can I use with CARTO?**

CARTO's new platform is designed to give you a fully cloud native experience, allowing you to run CARTO on top of your leading cloud data warehouse platform of choice (i.e. Google BigQuery, Snowflake, AWS Redshift, Oracle, Databricks, and any PostgreSQL-based data warehouse platform).

***

#### **What are the device/web browser requirements for CARTO?**

CARTO is designed to work in all modern browsers that meet the following criteria:

* Complete support, including hardware acceleration, for [WebGL2](https://get.webgl.org/)
* A browser version not older than 2 years

This includes the latest stable versions of Google Chrome, Safari, Firefox, Microsoft Edge, and Opera, but other browsers using standard technology and meeting the criteria above should be compatible as well.

While CARTO should work in all browsers meeting the criteria above, the best performance and compatibility are expected with Chromium-based browsers.

Please note that the user's device must also have hardware that supports these features. A desktop device with a dedicated GPU and at least 8 GB of RAM is recommended.

***

#### **When I connect to a data warehouse, do you copy or store any data?**

No, your connection allow us to perform queries against your data on your behalf, and the results are either stored again in your data warehouse or rendered in the client, as visible maps. CARTO being fully cloud native means no storage needs, less security concerns and no need for data replication or complex ETL processing.

***

#### **What happens if I do not have any cloud data warehouse platform to connect?**

For users who do not have any cloud data warehouse platform to which they want to connect CARTO, we are offering cloud storage and computing resources in what we call the CARTO Data Warehouse. A CARTO Data Warehouse connection is offered by default with your CARTO subscription.

***

#### **Can I import geospatial files into CARTO’s new platform?**

Yes, at the moment you can import both local or remote (via URL) Shapefiles, CSV or GeoJSON files. You have more details available in the corresponding section of our [User Manual](https://docs.carto.com/carto-user-manual/data-explorer/importing-data/).

***

#### **What are the Location Data Services (LDS) providers configured by default in a CARTO organization?**

CARTO offers access to Location Data Services (LDS) such as geocoding, isolines and routing by leveraging the APIs of 3rd party service providers. Since December 2023, by default, CARTO uses [TomTom](https://developer.tomtom.com/documentation) APIs for geocoding and routing, and [TravelTime](https://docs.traveltime.com/api/overview/introduction) for isolines.

CARTO retains the right to adjust the default configuration of these services at its sole discretion when deemed necessary. Other options to the default can be made available under special commercial and usage terms.


# Builder

[What methods can I use to create a map layer?](https://docs.carto.com/faqs/categories/builder/#what-methods-can-i-use-to-create-a-map-layer)

[How can I run spatial analyses in Builder?](https://docs.carto.com/faqs/categories/builder/#how-can-i-run-spatial-analyses-in-builder)

[How does the export mechanism from Builder works?](#how-does-the-export-mechanism-from-builder-works)

***

#### **What methods can I use to create a map layer?**

To add a data source to a map as a new layer you can either:

* Pick a table or tileset from one of your active connections to cloud data warehouses
* Add data resulting from applying a custom SQL Query. You can also leverage the SQL functions available in CARTO’s [Analytics Toolbox](https://docs.carto.com/carto-user-manual/maps/add-source/#custom-queries-using-the-analytics-toolbox).
* Importing data from a local or remote file. Right now we currently support GeoJSON, Shapefile (in a zip package), and CSV files. We’re working to support more formats in the future.

***

#### **How can I run spatial analyses in Builder?**

To run spatial analysis in Builder, you can use the SQL Editor, which is accessible when adding a data source as a custom query. The SQL Editor allows you to execute SQL commands directly in your cloud data warehouse (e.g., BigQuery, Snowflake, etc.), taking advantage of the full capabilities of the platform, including functions and operations available there. Additionally, you can leverage UDFs from the Analytics Toolbxo for enhanced spatial analysis.\
\
While the SQL Editor is ideal for performing simple analysis or utilizing SQL Parameters, for more complex or multi-step analysis, we recommend using Workflows. Workflows enable you to perform detailed, step-by-step analysis and save the results as a materialized table, which can then be used as a source in Builder. This approach provides greater flexibility and scalability for more advanced spatial analysis tasks.

***

#### How does the export mechanism from Builder works?

The export mechanism in Builder leverages the built-in export functionality of the connected cloud data warehouse to handle and process data. This ensures efficient export of datasets, aligning with the performance optimization strategies of the underlying platform.

When using BigQuery specifically, the export process stores data in a Google Cloud Storage (GCS) bucket. For performance and scalability, BigQuery splits the exported data into multiple smaller files rather than a single large file. This behavior is expected and is a result of BigQuery's internal strategies to parallelize the export jobs for optimal performance.

***

#### Does Builder support GEOMETRYCOLLECTION geometry type?

No, Builder does not support GEOMETRYCOLLECTION geometry types. If your data contains geometry collections, you'll need to convert them to individual geometry components (Point, LineString, or Polygon) using SQL transformations before visualization. See the [Simple Features documentation](/carto-user-manual/maps/data-sources/simple-features) for workaround examples using ST\_Dump.

\
\\


# Workflows

[When creating a new workflow, I cannot see the data sources available in my connection - what may be happening?](#when-creating-a-new-workflow-i-cannot-see-the-data-sources-available-in-my-connection-what-may-be-ha)

[Working with my data sources from a BigQuery connection I receive an error message about not having permissions to query the table or that the table does not exist on a specific region - What may be happening?](#working-with-my-data-sources-from-a-bigquery-connection-i-receive-an-error-message-about-not-having)

[Working with my data sources from a Snowflake connection I receive the following error message: "cannot get Workflow schema" - What may be happening?](#working-with-my-data-sources-from-a-snowflake-connection-i-receive-the-following-error-message-canno)

[My workflow is producing the error message “No value assigned.” What could be causing this?](#my-workflow-is-producing-the-error-message-no-value-assigned.-what-could-be-causing-this)

#### When creating a new workflow, I cannot see the data sources available in my connection - what may be happening?

This may be because the data warehouse connection associated with the workflow does not have the required permissions to run Workflows in the data warehouse, such as the permission of creating schemas in the Workflows temp. location (configured in the advanced options of the connection card). Please choose or create another connection with data owner permissions or modify the permissions in the current connection and try again. If the issue persists, please contact our support team at <support@carto.com>.

#### Working with my data sources from a BigQuery connection I receive an error message about not having permissions to query the table or that the table does not exist on a specific region - What may be happening?

In order to function, CARTO Workflows creates a temporal dataset in BigQuery named `workflows_temp` in where to store temporary objects needed to fully execute a workflow. In BigQuery, we create such dataset in the default region of the GCP project associated to the [BigQuery connection](https://docs.carto.com/carto-user-manual/connections/creating-a-connection#connection-to-bigquery). If you then want to include in a workflow data sources that are stored in another region different to the "default" one of your GCP project, then you need to create a new `workflows_temp` dataset in that other region and specify its location in the Advanced options of your BigQuery connection.

<figure><img src="/files/HZhwuxyOLu4fjcvv7CNw" alt=""><figcaption></figcaption></figure>

#### Working with my data sources from a Snowflake connection I receive the following error message: "cannot get Workflow schema" - What may be happening?

In order to guarantee a successful execution of a workflow via a Snowflake connection, please make sure that in the settings of the [connection](/carto-user-manual/connections) you have specified the database of your Snowflake account with which you want to work via that specific connection. This field is now required by CARTO Workflows. Note that you can [edit](https://github.com/CartoDB/gitbook-documentation/blob/master/faqs/broken-reference/README.md) an existing connection at any time.

#### My workflow is producing the error message "no value assigned." What could be causing this?

Usually this error occurs when either the input data sources have not finished loading, or the workflow has not had time to fully initialize before you’ve run it. This means that your later components have not had a chance to work out which values it will be receiving from the previous components.

This can usually be fixed by re-running the workflow.


# Data Observatory

[Can I license premium data with a trial or student account?](https://docs.carto.com/faqs/categories/data-observatory/#can-i-license-premium-data-with-a-trial-individual-or-student-account)

[Are premium data subscriptions based on perpetual licenses?](https://docs.carto.com/faqs/categories/data-observatory/#are-premium-data-subscriptions-based-on-perpetual-licenses)

[Can I export the data from CARTO and use it on other platforms?](https://docs.carto.com/faqs/categories/data-observatory/#can-i-export-the-data-from-carto-and-use-it-on-other-platforms)

***

#### **Can I license premium data with a trial, or student account?**

No, premium data subscriptions are only available for Enterprise plans. For Trial and Student plans, you will only have access to data samples or public data products from the Data Observatory.

Individual plans do not get access to the Data Observatory. If you need to use it, you would need to upgrade to a Starter plan, or get in touch with <sales@carto.com>

***

#### **Are premium data subscriptions based on perpetual licenses?**

Premium subscriptions are offered on a Data-as-a-Service model based on yearly or multi-yearly licenses. Once the subscription expires and it is not renewed, the user needs to stop using and delete the associated datasets from the account.

***

#### **Can I export the data from CARTO and use it on other platforms?**

It will depend on the data provider and the type of license you have purchased for your premium data subscription. Some data providers offer different types of licenses if their data is going to be used only within a CARTO application or exported into other technologies.


# Analytics Toolbox

[What is CARTO’s Analytics Toolbox?](https://docs.carto.com/faqs/categories/analytics-toolbox/#what-is-cartos-analytics-toolbox)

[How can I use the functions available in the Analytics Toolbox?](https://docs.carto.com/faqs/categories/analytics-toolbox/#how-can-i-use-the-functions-available-in-the-analytics-toolbox)

[Can I use the Analytics Toolbox from the CARTO Data Warehouse connection?](https://docs.carto.com/faqs/categories/analytics-toolbox/#can-i-use-the-analytics-toolbox-from-the-carto-data-warehouse-connection)

[In the Analytics Toolbox for BigQuery, are there differences when using it from different GCP regions?](https://docs.carto.com/faqs/categories/analytics-toolbox/#in-the-analytics-toolbox-for-bigquery-are-there-differences-when-using-it-from-different-gcp-regions)

***

#### **What is CARTO’s Analytics Toolbox?**

CARTO’s Analytics Toolbox is a set of UDFs and Store Procedures to unlock Spatial Analytics directly on top of your cloud data warehouse platform. It is organized in a set of modules based on the functionality they offer.

***

#### **How can I use the functions available in the Analytics Toolbox?**

You can use the functions in the Analytics Toolbox via CARTO Builder, SQL Notebooks, and directly in the console of your cloud data warehouse platform.

To learn how to get access to the toolbox please visit the Documentation page for the:

* [Analytics Toolbox for BigQuery](/data-and-analysis/analytics-toolbox-for-bigquery) (also valid for the CARTO Data Warehouse)
* [Analytics Toolbox for Snowflake](/data-and-analysis/analytics-toolbox-for-snowflake)
* [Analytics Toolbox for Redshift](/data-and-analysis/analytics-toolbox-for-redshift)
* [Analytics Toolbox for Databricks](/data-and-analysis/analytics-toolbox-for-databricks)

In CARTO Builder, you can use the Analytics Toolbox functions in your custom SQL queries when [adding a source](https://docs.carto.com/carto-user-manual/maps/add-source/#custom-queries-using-the-analytics-toolbox) to your map.

***

#### **Can I use the Analytics Toolbox from the CARTO Data Warehouse connection?**

Yes, you can. CARTO Data Warehouse connection works under the hood as a connection to Google BigQuery in the same region in which you have provisioned your CARTO organization account. Follow the same guides and reference for the [Analytics Toolbox for BigQuery](https://docs.carto.com/analytics-toolbox-bigquery/overview/getting-access/) to use this functionality from your CARTO Data Warehouse connection.

***

#### **In the Analytics Toolbox for BigQuery, are there differences when using it from different GCP regions?**

Yes, there are. The projects in which we install the Analytics Toolbox functions vary depending on the [cloud region](https://cloud.google.com/compute/docs/regions-zones). In this [section of the documentation](https://docs.carto.com/analytics-toolbox-bigquery/overview/regions-table/) you can find the BigQuery Project name for the Analytics Toolbox depending on the cloud region to which you have created a connection between CARTO and BigQuery.

For BigQuery connections in US and EU regions, we recommend to use the Analytics Toolbox we have enabled in US multi-region (project name: carto-un) and EU multi-region (project name: carto-un-eu)

Note that this also applies if you want to leverage the Analytics Toolbox from your CARTO Data Warehouse connection.


# Development Tools

[What frameworks and libraries can I use for developing custom apps with CARTO?](https://docs.carto.com/faqs/categories/development-tools/#what-frameworks-and-libraries-can-i-use-for-developing-custom-apps-with-carto)

[Are “CARTO for deck.gl” and “CARTO for React” compatible with the new version of the platform?](https://docs.carto.com/faqs/categories/development-tools/#are-carto-for-deckgl-and-carto-for-react-compatible-with-the-new-version-of-the-platform)

***

#### **What frameworks and libraries can I use for developing custom apps with CARTO?**

You can use any framework or visualization library because CARTO is based on industry-standards. If there is not a hard requirement, we recommend using deck.gl for visualization and CARTO for React for creating apps that extend the platform functionality.

***

#### **Are “CARTO for deck.gl” and “CARTO for React” compatible with the new version of the platform?**

Yes, you can use both tools with the previous and the new version of the platform.

***

#### **Does CARTO provide an SDK for the development of Mobile applications?**

CARTO does not currently offer an SDK for the development of mobile apps as a component of our cloud native platform. In order to develop mobile applications with geospatial data, we recommend using the relevant SDK of your cloud vendor, or from products such as Google Maps, Apple Maps, Mapbox or Maplibre.

Particularly for the visualization of small datasets with spatial data (< 30MB), all SDKs will support visualization of GeoJSON files (e.g. [Google’s Maps SDK for Android](https://developers.google.com/maps/documentation/android-sdk/utility/geojson)), and CARTO’s [Maps API](https://api-docs.carto.com/#75feef02-1e8d-4d95-be36-17276228544a) can be the technology to serve them.

The Mobile SDK in the previous version of the CARTO platform will not be further developed, and we don’t recommend starting new projects with it.


# Deployment Options

[What are the different deployment options for the CARTO platform?](https://docs.carto.com/faqs/categories/deployment-options/#what-are-the-different-deployment-options-for-the-CARTO-platform)

[Where can I find information about the requirements for deploying CARTO as Self-hosted?](https://docs.carto.com/faqs/categories/deployment-options/#where-can-i-find-information-about-the-requirements-for-deploying-CARTO-as-self-hosted)

[How are updates and product releases managed in a Self-hosted deployment?](https://docs.carto.com/faqs/categories/deployment-options/#how-are-updates-and-product-releases-managed-in-a-self-hosted-deployment)

[Where can I find information about deploying CARTO with Snowflake Container Services?](#where-can-i-find-information-about-deploying-carto-with-snowflake-container-services)

***

#### **What are the different deployment options for the CARTO platform?**

There are two different deployment options for the CARTO platform:

* **CARTO Cloud**: A fully managed deployment that CARTO hosts on our own cloud. When you use CARTO in our cloud, we manage configuration, updates, and versioning. This option is available in different regions that you can select when [creating your organization](https://docs.carto.com/carto-user-manual/overview/getting-started/#create-a-new-organization).
* **Self-Hosted**: With this option, you host your own CARTO tenant. That means it can be deployed in your virtual private cloud (VPC) or behind your virtual private network (VPN).
* **(BETA) Snowflake Container Services:** Fully deploy CARTO inside Snowflake by leveraging Snowflake Native Apps and Container Services.

#### **Where can I find information about the requirements for deploying CARTO as Self-hosted?**

Find links to the documentation and technical requirements [here](https://github.com/CartoDB/gitbook-documentation/blob/master/faqs/broken-reference/README.md).

#### **How are updates and product releases managed in a Self-hosted deployment?**

While in CARTO Cloud updates and product releases are continously added to the platform, if you’re self-hosting your own CARTO tenant, it will need to be updated periodically to enjoy the latest version of the platform.

The CARTO team publishes versioned releases on the public Self-hosted repositories that can be used to upgrade your deployment. Find the latest releases for [Docker](https://github.com/CartoDB/carto-selfhosted/releases/latest) and [Kubernetes](https://github.com/CartoDB/carto-selfhosted-helm/releases/latest)

#### **Where can I find information about deploying CARTO with Snowflake Container Services?**

Find links to the documentation [here](https://github.com/CartoDB/gitbook-documentation/blob/master/faqs/broken-reference/README.md).


# CARTO Basemaps

[Does CARTO provide a basemap service?](#does-carto-provide-a-basemap-service)

[What is the pricing for CARTO basemaps? Is it free?](#what-is-the-pricing-for-carto-basemaps-is-it-free)

[How frequently does CARTO update its basemaps?](#how-frequently-does-carto-update-its-basemaps)

[Can I use other basemaps in CARTO?](#can-i-use-other-basemaps-in-carto)

***

### **Does CARTO provide a basemap service?**

Yes. We provide a basemap service using vector tiles, and we make them automatically available in all the components in the CARTO platform (Builder, Workflows, etc...), for all users.

Our basemaps are also compatible with Maplibre GL JS, so that [developers using deck.gl and CARTO for Developers can make use of it in their own applications](/carto-for-developers/key-concepts/carto-for-deck.gl/basemaps).

The data for the CARTO basemaps is based on OpenStreetMap. Our basemaps are fully managed and powered by CARTO, including our own CDN, which makes them performant, scalable and customizable. Developers and users can choose between multiple [predefined basemap styles](https://github.com/CartoDB/basemap-styles), or even design their own styles following the *OpenMapTiles* specifications.

<figure><img src="/files/Niw8WBUBVcoXkxQp3wec" alt=""><figcaption></figcaption></figure>

### **What is the pricing for CARTO basemaps? Is it free?**

For commercial purposes, you will need an Enterprise license in order to use the CARTO Basemaps. To find out more about [pricing](https://carto.com/pricing/), [request a demo](https://carto.com/request-live-demo/) & we’ll be able to discuss your use case with you.

For non-commercial purposes, our basemaps can be used for free in applications and visualizations by [CARTO grantees](https://carto.com/grants/) (full T\&Cs available [here](https://carto.com/legal/)).

Once you have a license or a grant, basemaps do not incur in additional costs, and you can use them as much as needed.

### **How frequently does CARTO update its basemaps?**

At a minimum, CARTO updates the underlying data for its basemaps **at least once a year,** including new roads, labels, areas, and other data points. Most years we provide updates every 3 or 6 months so that data is fresh and up-to-date, but the schedule and frequency is not guaranteed.

### **Can I use other basemaps in CARTO?**

Yes! While customers and grantees can automatically make use of our basemaps, you can use any other basemap service of your preference:

* CARTO provides out-of-the-box integration for [Google Maps basemaps in Builder](/carto-user-manual/maps/basemaps#google-maps-basemaps).
* Admins can configure [additional custom basemaps ](/carto-user-manual/settings/customizations/configuring-your-organization-basemaps)that will be available for their users in Builder
* Developers can integrate [any basemap provider in their CARTO + deck.gl applications](/carto-for-developers/key-concepts/carto-for-deck.gl/basemaps).


# CARTO for Education

[How can I get a Student account in CARTO?](https://docs.carto.com/faqs/categories/carto-for-education/#how-can-i-get-a-student-account-in-carto)

[How can I get an Educator acccount?](https://docs.carto.com/faqs/categories/carto-for-education/#how-can-i-get-an-educator-account)

[We need Enterprise capabilities for our institution or academic research, can you help?](https://docs.carto.com/faqs/categories/carto-for-education/#we-need-enterprise-capabilities-for-our-institution-or-academic-research-can-you-help)

[What is the process for getting a CARTO Student account?](https://docs.carto.com/faqs/categories/carto-for-education/#what-is-the-process-for-getting-a-carto-student-account)

[I am an educator and my course materials use the previous version of CARTO. What can I do?](https://docs.carto.com/faqs/categories/carto-for-education/#i-am-an-educator-and-my-course-materials-use-the-previous-version-of-carto-what-can-i-do)

{% hint style="info" %}
**Why do you need this?**

🎓 You are a student

🏫 You are an educator or academic institution
{% endhint %}

We routinely hear from students, teachers, professors, and university administrators that they’d love to use CARTO in the classroom. Here is how schools and individual students may make use of CARTO:

* Individual Student Accounts: free CARTO accounts via GitHub Student Developer Pack
* Educator Accounts: free CARTO accounts by request
* Enterprise Accounts for Education: discounts and grants on a case by case basis

***

#### **How can I get a Student account in CARTO?**

Students can create a free CARTO account via [GitHub’s Student Developer Pack](http://education.github.com/pack). When they sign up for the pack, they’ll also get access to a ton of other free development tools! See the process and eligibility requirements below.

***

#### **How can I get an Educator account?**

Educators are also eligible for a free CARTO account. Request an Educator account by completing the following [request form](https://share.hsforms.com/1_dMkP1UzSsuY00Oz6zkccAa6if), attaching a document that accredits your educator status. We welcome educators from accredited institutions as well as bootcamps and similar training organizations.

[–> Request your Educator account here](https://share.hsforms.com/1_dMkP1UzSsuY00Oz6zkccAa6if)

***

#### **We need Enterprise capabilities for our institution or academic research, can you help?**

Academic researchers and others in the education field, whether at a school, university, independent research center, or boot camp, can make use of CARTO Enterprise at a discount. [Contact sales](https://carto.com/#request-demo) to learn more.

***

#### **What is the process for getting a CARTO Student account?**

To verify that only eligible students are accessing CARTO, we take advantage of Github’s verification system. This means you will need to go through their channels to ensure you receive the proper student account:

**Step 1:** Sign up for Github

1. Sign up for a free Github account, using your university issued email to do so: <https://github.com/signup>
   1. ✅ `yourname@university.edu`
   2. ❌ `yourname@gmail.com`
2. Here’s a video-tutorial with all the steps:

{% embed url="<https://player.vimeo.com/video/689236688>" %}

**Step 2:** Apply for the Github Education Pack

* [Apply here](https://education.github.com/pack) with your GitHub account

**To be eligible, you must**

* Be a student aged 13+ and enrolled in a degree or diploma granting course of study
* Verify who you are with one of the following:
  * a school-issued email address
  * provide a valid student identification card
  * other official proof of enrollment

**Step 3:** Wait for verification and confirm

Once you apply, Github will need to verify you are, in fact, a student. This could take from *1 hour to several days*. Please be patient and wait for your official verification, it is important for the process.

Upon verification, you will receive an email from Github that you have access to the Education Pack

If you have any questions regarding Github’s verification process, please reach out to their support team at <education@github.com>. Please also keep an eye on your spam folder, as your university email policies might route the verification message there.

**Step 4:** Claim your CARTO student account

🎉 Congratulations! You can now claim your free CARTO Student account here: <https://app.carto.com/students>

This process will connect your GitHub account. Remember you should that URL for login too, although it will always be available from the general login page.

<figure><img src="/files/kqBZyUsztYHA4unuUiT6" alt=""><figcaption></figcaption></figure>

{% hint style="info" %}
**Remember**

To login to your CARTO Student account you’ll need to always use this specific URL: <https://app.carto.com/students>
{% endhint %}

#### **I am an educator and my course materials use the previous version of CARTO. What can I do?**

First of all, thank you for using CARTO to unlock the potential of geospatial analysis with your students. We believe the new version of CARTO will carve out a new path for cloud native Location Intelligence for the years to come — Happy to have you onboard!

To update your teaching materials to reflect the new version of CARTO, we recommend you follow these simple steps. As an example, if your course content consisted of 5 datasets and 10 maps, updating content to the new CARTO platform shouldn’t take longer than a couple of hours.

1. First, access your previous CARTO account: <https://carto.com/login>
2. Open the dataset(s) you need and export them in CSV format. More info [here](https://carto.com/help/tutorials/export-data-guide/).
3. Use your new credentials to access your CARTO account: [https://app.carto.com](https://app.carto.com/)
4. Import the .CSV datasets you have exported
   * If you don’t have a data warehouse, you can use the CARTO Data Warehouse provided by us
   * Follow our detailed guide for importing [here](https://docs.carto.com/carto-user-manual/data-explorer/importing-data/)
5. Finally, using our new Builder tool, recreate the maps you’ll need for your course content.

We appreciate these updates require some time and effort on your side, but rest assured, we won’t be limiting access to your previous CARTO account any time soon.

{% hint style="warning" %}
**If you're in a rush**

For this semester: don’t panic! Students can still sign up for the previous version of CARTO using the student pack until April 30th 2022. They just need to follow this link: <https://carto.com/student-pack/signup/?plan=student-engine>

From May 1st onwards, the signup process will be closed, but existing student and educator accounts will remain active. You can continue to use them for this semester, giving you time to update your materials for the next academic year.
{% endhint %}


# Support Packages

[What support packages are available at CARTO?](https://docs.carto.com/faqs/categories/support-packages/#what-support-packages-are-available-at-carto)

[Who is entitled to Support?](https://docs.carto.com/faqs/categories/support-packages/#who-is-entitled-to-support)

[What are CARTO Business Hours?](https://docs.carto.com/faqs/categories/support-packages/#what-are-carto-business-hours)

[What are Customer Success Managers (CSMs)?](https://docs.carto.com/faqs/categories/support-packages/#what-are-customer-success-managers-csms)

[What are Service Hours?](#what-are-service-hours)

[How to submit an issue to our Support team?](https://docs.carto.com/faqs/categories/support-packages/#how-to-submit-an-issue-to-our-support-team)

[What is the issue and severity classification?](https://docs.carto.com/faqs/categories/support-packages/#what-is-the-issue-and-severity-classification)

[What are CARTO’s Target Response Times (business hours)?](https://docs.carto.com/faqs/categories/support-packages/#what-are-cartos-target-response-times-business-hours)

***

### **What support packages are available at CARTO?**

CARTO offers comprehensive Support Packages to our enterprise customers. CARTO is committed to helping you make the most of your CARTO solution. These Packages are structured to help organizations at any stage of using location data to solve complex problems. We offer the following Packages with a combination of services to best suit your specific needs, available in both annual and pay-as-you-go subscription models.

#### Annual Subscriptions

A fixed yearly commitment that gives you predictable budgeting. Best suited for organizations with ongoing projects and a clear view of their support needs throughout the year.

<table><thead><tr><th width="200">Support Package</th><th>Standard</th><th>Premium</th><th>Elite</th><th data-hidden>Individual</th></tr></thead><tbody><tr><td><strong>Support Access</strong></td><td>email</td><td>email</td><td>email or videoconference</td><td>email</td></tr><tr><td><strong>Documentation</strong></td><td>✓</td><td>✓</td><td>✓</td><td>✓</td></tr><tr><td><strong>Support Coverage</strong></td><td>Business Hours<br>(1 region)</td><td>Business Hours<br>(2 regions)</td><td>24 / 7</td><td>Business Hours<br>(1 region)</td></tr><tr><td><strong>Target Response Times</strong></td><td>Standard</td><td>Premium</td><td>Elite</td><td>Pro</td></tr><tr><td><strong>Customer Success Manager (CSM)</strong></td><td></td><td>✓</td><td>✓</td><td></td></tr><tr><td><strong>Onboarding</strong></td><td>Online</td><td>CSM-led</td><td>CSM-led</td><td>Online</td></tr><tr><td><strong>Success Plans</strong></td><td></td><td>✓</td><td>✓</td><td></td></tr><tr><td><strong>Quarterly Business Reviews</strong></td><td></td><td>✓</td><td>✓</td><td></td></tr><tr><td><strong>Access to CARTO-organized communities of practice</strong></td><td></td><td>✓</td><td>✓</td><td></td></tr><tr><td><strong>Product Updates</strong></td><td>Online</td><td>CSM-led review</td><td>CSM-led review</td><td>Online</td></tr><tr><td><strong>Feature Request elevation</strong></td><td></td><td></td><td>✓</td><td></td></tr><tr><td><strong>Services Hours</strong></td><td></td><td>max. 20h</td><td>max. 40h</td><td></td></tr></tbody></table>

#### Pay As You Go

A flexible monthly billing model, well suited for organizations with variable or seasonal needs. Support tier is standard by default and can be upgraded at any point, keeping the selected tier in effect for the duration of the PAYG engagement.

<table><thead><tr><th width="200">Support Package</th><th width="182">Standard</th><th>Premium</th><th>Elite</th><th data-hidden>Individual</th></tr></thead><tbody><tr><td><strong>Support Access</strong></td><td>email</td><td>email</td><td>email or videoconference</td><td>email</td></tr><tr><td><strong>Documentation</strong></td><td>✓</td><td>✓</td><td>✓</td><td>✓</td></tr><tr><td><strong>Support Coverage</strong></td><td>Business Hours<br>(1 region)</td><td>Business Hours<br>(2 regions)</td><td>24 / 7</td><td>Business Hours<br>(1 region)</td></tr><tr><td><strong>Target Response Times</strong></td><td>Standard</td><td>Premium</td><td>Elite</td><td>Pro</td></tr><tr><td><strong>Customer Success Manager (CSM)</strong></td><td></td><td>Available after 1st year</td><td>Available after 1st year</td><td></td></tr><tr><td><strong>Onboarding</strong></td><td>Online</td><td>Online</td><td>Online</td><td>Online</td></tr><tr><td><strong>Success Plans</strong></td><td></td><td>Available after 1st year</td><td>Available after 1st year</td><td></td></tr><tr><td><strong>Quarterly Business Reviews</strong></td><td></td><td>Available after 1st year</td><td>Available after 1st year</td><td></td></tr><tr><td><strong>Access to CARTO-organized communities of practice</strong></td><td></td><td>✓</td><td>✓</td><td></td></tr><tr><td><strong>Product Updates</strong></td><td>Online</td><td>Online</td><td>Online</td><td>Online</td></tr><tr><td><strong>Feature Request elevation</strong></td><td></td><td></td><td>✓</td><td></td></tr><tr><td><strong>Services Hours (monthly)</strong></td><td></td><td>max. 2h</td><td>max. 4h</td><td></td></tr></tbody></table>

***

### **Who is entitled to Support?**

Users of the CARTO Platform are entitled to support according to their Support Package, described above. CARTO is not responsible for providing support to end users of CARTO-powered applications.

***

### **What are CARTO Business Hours?**

CARTO Support provides business hours coverage across 3 regions:

* European Region ( 9am - 6pm Central European Time (CET) )
* American Region ( 9am - 8pm Eastern Standard Time (ET) )
* APAC Region (8am - 5pm Singapore Time (SGT) )

Business hours coverage is determined by your selected Support Package.

For those customers on a Standard Package, you will be offered the option of selecting 1 of the regions as your indicated coverage times.

For those customers on a Premium Package, “business hours” are defined by the indicated hours across two regions.

Customers with an Elite Support Package are provided with 24/7 support for P1 priority issues (see more below on issue classification). Customers with an Elite Support Package will be given specific access to information and guidance regarding how and when to leverage 24/7 support.

CARTO works in good faith to respond to all submitted issues in a timely fashion. Slower than usual responses can be expected due to regional holidays of our Team.

***

### **What are Customer Success Managers (CSMs)?**

Customer Success Managers at CARTO bring geospatial expertise and hands-on guidance in applying Location Intelligence to business needs, based on our experience working with hundreds of enterprise customers in diverse industries and fields. CSM’s also act as the “voice of the customer” communicating to and, as required, connecting customers with Product, Support, and other CARTO teams.

***

### **What are Service Hours?**

Service Hours are pre-allocated blocks of expert time included with the Premium and Elite Support Packages. They can be used for activities that go beyond standard support — for example, technical guidance on advanced use cases, architecture reviews, custom enablement sessions, or hands-on assistance with specific projects.

Service Hours are allocated annually or monthly (depending on your subscription) and must be used within that term. **Unused hours do not roll over to the following term** — they expire at the end of the term. We recommend planning their usage together with your Customer Success Manager early in the term to ensure you get the full value from them.

***

### **How to submit an issue to our Support team?**

Support issues should be submitted via the indicated email address based on your selected Support Package.

* Enterprise account users will contact Support with <enterprise-support@carto.com>.
* Elite accounts will have dedicated email addresses for P1 that will be shared when the Elite Support Package coverage starts.
  * For P2 and P3, they will contact support with <enterprise-support@carto.com>.

***

### **What is the issue and severity classification?**

All support issues received will be first triaged and assigned a prioritization level based on the severity of the reported issue. CARTO will work to first investigate and understand the issue at hand to ensure the appropriate severity level is assigned. CARTO classifies support issues as follows:

| **Classification** | **Description**                                             |
| ------------------ | ----------------------------------------------------------- |
| **P1**             | Critical issue; full service is unusable                    |
| **P2**             | Issue with significant operational impact                   |
| **P3**             | Issue with limited operational impact and general questions |

Customers should indicate the level of impact being experienced when submitting their support request. This will give CARTO’s Support Engineering team a sense of the potential impact and urgency of the issue. CARTO’s Support Engineering team will ultimately determine the issue severity based on initial investigation and correspondence with the issue submitter.

***

### **What are CARTO’s Target Response Times (business hours)?**

<table data-header-hidden><thead><tr><th></th><th></th><th></th><th></th><th data-hidden></th></tr></thead><tbody><tr><td><strong>Severity</strong></td><td><strong>Standard</strong></td><td><strong>Premium</strong></td><td><strong>Elite</strong></td><td><strong>Individual</strong></td></tr><tr><td><strong>P1</strong></td><td>4</td><td>2</td><td>1*</td><td>8</td></tr><tr><td><strong>P2</strong></td><td>6</td><td>4</td><td>2</td><td>12</td></tr><tr><td><strong>P3</strong></td><td>16</td><td>8</td><td>6</td><td>24</td></tr></tbody></table>

All response times are expressed in business hours, except for Elite P1 issues (\*) that are expressed in regular hours.


# Security and Compliance

[Is the CARTO Platform SOC 2 Type II-certified?](#is-the-carto-platform-soc-2-type-ii-certified)

[Does it comply with GDPR, CCPA and other data privacy laws?](#does-it-comply-with-gdpr-ccpa-and-other-data-privacy-laws)

[What are the password and login management controls in CARTO?](#what-are-the-password-and-login-management-controls-in-the-carto-platform)

[When we create a connection to CARTO, does it make any copies of our data?](#when-we-create-a-connection-to-carto-does-it-make-any-copies-of-our-data)

[How does CARTO manage our data?](#how-does-carto-manage-user-data)

[Where is my data stored?](#where-is-my-data-stored)

[How does CARTO manage security when a map, a workflow or an application are shared?](#how-does-carto-manage-security-when-a-map-workflow-or-an-application-are-shared)

***

### Is the CARTO Platform SOC 2 Type II-certified?

Yes. As part of its SOC 2 Type II certification, CARTO undergoes annual auditing of its system and organization controls, performed by an independent, third-party certified auditor.

CARTO’s latest SOC 2 Type II report is available upon request for customers and prospects. Please note that prospects must have signed an NDA (Non-disclosure agreement) with CARTO before receiving the SOC 2 Type II report.

Visit <https://security.carto.com/> to request the latest report.

***

### **Does it comply with GDPR, CCPA and other data privacy laws?**

Yes. CARTO complies with GDPR, CCPA and other data privacy laws where applicable. You can read more about it in our [Privacy Policy.](https://carto.com/privacy)

***

### **What are the password and login management controls in CARTO?**

There are three ways for users to access their CARTO accounts:

* **Single Sign-On (SSO):** In this case, your organization will define the password requirements and will leverage all security policies such as rotation, MFA, etc.
* **Sign in with Google:** The password requirements and policies are defined in your Google account preferences, which may be managed by your organization.
* **Username/Password:** CARTO uses Auth0 to securely process the data and enforces sufficient length and complexity standards.

If you're looking for password rotation, expiration or history controls we recommend you integrate [Single Sign-On](/carto-user-manual/settings/sso), so that you can set up and leverage your existing company policies.

***

### When we create a connection to CARTO, does it make any copies of our data?

No, CARTO does not make any copies of the data available through your [Connections](/carto-user-manual/connections).

CARTO is cloud-native by design, and we have no need to replicate your data — never. Maps, Workflows, and Applications built with CARTO will launch queries against live data in your own data warehouse (BigQuery, Snowflake, Redshift, Databricks, Oracle, PostgreSQL, etc) and the result of these queries is not stored for further uses, with the exception of a temporal cache layer for performance and cost optimization, that is encrypted and distributed securely. This applies to all kinds of deployments.

***

### How does CARTO manage our data?

To understand how CARTO processes your data we first need to describe the three categories of data that CARTO processes:

* **Connected Data:** This is the data in your data warehouse (BigQuery, Snowflake, Redshift, Databricks, Oracle, PostgreSQL, etc) that you'll be using in CARTO. As seen above, CARTO does not make any copies of your data. This data is encrypted in transit, and the credentials are never exposed in the frontend.
* **User-generated Content:** These are the map details, workflows, credentials and configurations created by the users in a CARTO organization. User-generated Content is managed by CARTO. We carry out daily backups and encryption, except for self-hosted deployments. It is encrypted at rest and in transit.
* **Personal Data:** This is the additional data needed by the platform to identify and provide service to the user such as settings, contact information, name, etc; User Data is managed by CARTO. We carry out daily backups and encryption, except for self-hosted deployments. It is encrypted at rest and in transit.

***

### Where is my data stored?

* **Connected Data:** Stored in your connected cloud data warehouse, including the result of all analysis done in CARTO.
  * If you are using the [CARTO Data Warehouse](/carto-user-manual/connections/carto-data-warehouse), then it will be stored in the [organization's region of choice](/carto-user-manual/overview/carto-cloud-regions).
* **User-generated Content:** This data is stored in the [organization's region of choice](/carto-user-manual/overview/carto-cloud-regions) for SaaS deployments. For Self-Hosted deployments this is stored in your Self-Hosted resources.
* **Personal Data:** Personal user data is stored securely in a server in the United States, on the Google Cloud Platform. You can read more about it in our [Privacy Policy.](https://carto.com/privacy)

***

### How does CARTO manage security when a map, workflow or an application are shared?

CARTO provides several controls to make sure viewers and editors don't gain unauthorized access to the underlying data of a map, workflow or application.

* Editors can create connections to their data by providing credentials that are stored, encrypted, and never exposed in the browser in any case. These connections can then be shared with all editors in the organization (or with specific groups).
  * Editors can also [require viewer credentials on their connections](/carto-user-manual/connections/sharing-a-connection#require-viewer-credentials) for added security.
* Maps, workflows and applications relying on a connection will stop working as soon as the credentials used are revoked.
* Maps, workflows, and applications can be shared with all users within an organization (including viewers), or with specific groups, but **this does not grant them access to the connection**.
* Published maps [can be protected with a password](/carto-user-manual/maps/sharing-and-collaboration#password-protected-maps) for additional security.


# What is CARTO?

CARTO is the leading Agentic GIS and Location Intelligence platform. It enables organizations to use AI, spatial data and analysis for more efficient delivery routes, better behavioral marketing, strategic store placements, and much more.

Data Scientists, Developers, and Analysts use CARTO and its Agentic GIS approach to optimize business processes and predict future outcomes through the power of Spatial Data Science and AI Agents reasoning.

CARTO is the only cloud-first spatial platform built for accelerated, modern GIS. It runs natively on top of your cloud data warehouse platform (e.g. Google BigQuery, Snowflake, AWS Redshift, Oracle, Databricks, PostgreSQL, etc.), providing easy access to highly scalable spatial analysis and visualization capabilities in the cloud - be it for analytics, app development, data engineering, AI-powered decision-making, and more.

Users can use CARTO in both cloud and self-hosted deployments, giving enterprises full control over their data, and infrastructure while ensuring security, compliance, and seamless integration with existing systems.

CARTO offers enterprise-grade secure connectivity to your own vetted AI models, authenticated through your organization’s credentials and proxy configuration. Supported providers include Google, Snowflake, AWS Bedrock, Databricks, Oracle, OpenAI, Anthropic, and more, ensuring full compliance, governance, and flexibility for enterprise AI deployments.

<figure><img src="/files/OL1uRo9vswqDOEnCJwC7" alt=""><figcaption></figcaption></figure>

## Who uses CARTO? <a href="#components-of-the-carto-platform" id="components-of-the-carto-platform"></a>

Different type of users leverage our platform in different ways, such as:

<details>

<summary>🧑‍💼 Data Analysts</summary>

A Data Analyst might use [Builder](/faqs/builder) to create maps and dashboards, and [Workflows](/faqs/workflows) to design analysis pipelines. They can also develop [AI Agents](/carto-user-manual/ai-agents) powered by their own [MCP Tools](/carto-user-manual/workflows/workflows-as-mcp-tools), making spatial insights accessible through natural language.

</details>

<details>

<summary>🧑‍💻 Data Engineers</summary>

A Data Engineering might automate [geospatial pipelines](/faqs/workflows) and enrich data from the [Data Observatory](/carto-user-manual/data-observatory), exposing curated results as [tools](/carto-for-agents/mcp-server) for [AI Agents](/carto-user-manual/ai-agents) and enterprise applications.

</details>

<details>

<summary>🧑‍🔬 Data Scientists</summary>

A Data Scientist might use [Workflows](/faqs/workflows) and the [Analytics Toolbox](/data-and-analysis/analytics-toolbox-overview) to engineer spatial features and perform advanced analyses, then visualize and share results through [Builder](/faqs/builder) dashboards. They might also leverage [AI Agents](/carto-user-manual/ai-agents) and [MCP Tools](/carto-for-agents/mcp-server) to explore correlations and generate insights conversationally.

</details>

<details>

<summary>🧑‍💻 Developers</summary>

A Developer might build scalable and performant [geospatial apps](/carto-for-developers/overview) faster and on top of their own cloud data warehouse by using the CARTO module in [deck.gl](https://github.com/CartoDB/gitbook-documentation/blob/master/carto-for-developers/key-concepts/carto-for-deck.gl), CARTO APIs, and custom [MCP tools](/carto-for-agents/mcp-server) that connect to internal data or trigger workflows.

</details>

<details>

<summary>📈 Analytics and GIS leaders</summary>

An Analytic and GIS Leader might empower teams across the organization to use spatial data effectively, from [Builder](/faqs/builder) dashboards and [Workflows](/faqs/workflows) for analysis to [AI Agents](/carto-user-manual/ai-agents) and [MCP Tools](/carto-for-agents/mcp-server) that make insights accessible through natural language.<br>

</details>

<details>

<summary>🗺️ GIS Analysts</summary>

A GIS Analyst might use [Workflows](/faqs/workflows) to analyze data exposing them as [MCP Tools](/carto-user-manual/workflows/workflows-as-mcp-tools) to be reused by [AI Agents](/carto-user-manual/ai-agents) within [map-powered dashboards](/carto-user-manual/maps) or other systems, turning complex spatial analysis into modular and accessible insights

</details>

<details>

<summary>☁️ Cloud Architects</summary>

A Cloud Architect might implement CARTO to speed up the migration of geospatial workloads to the cloud.

</details>

### What makes CARTO unique? <a href="#what-makes-carto-unique" id="what-makes-carto-unique"></a>

We believe that CARTO does some things extremely well — And those things make us unique versus other geospatial platforms:

<table data-view="cards"><thead><tr><th></th></tr></thead><tbody><tr><td><p><strong>Cloud Native</strong></p><ul><li>Direct connection to your cloud data warehouse — no migration or ETLs needed.</li><li>Use native SQL across the platform and leverage your data warehouse geospatial capabilities.</li><li>Our Analytics Toolbox functions are installed and run natively in your data warehouse, expanding its geospatial capabilities.</li><li>Streamlined security and governance by inheriting data and user access controls.</li><li>Easy to ramp up for people with limited exposure to geospatial, unlike traditional GIS tools.</li></ul></td></tr><tr><td><p><strong>Scale and Performance</strong></p><ul><li>Process millions and billions of records by leveraging your cloud data warehouse computational power.</li><li>Full support for spatial indexing techniques such as H3, optimizing transformations, enrichment, and analysis for superior performance with large datasets.</li><li>Create performant visualizations regardless of data scale using dynamic and static tiling strategies.</li><li>Use Builder to create and share dashboards in minutes; create spatial workflows easily in Workflows, our no-code visual model builder</li><li>Faster development of scalable geospatial applications by leveraging CARTO and Deck.gl, allowing you to focus on driving value with your application</li></ul></td></tr><tr><td><p><strong>Agentic GIS</strong></p><ul><li>CARTO brings AI-powered spatial reasoning to the cloud with AI Agents capable of understanding, analyzing, and visualizing your data through natural language.</li><li>Combine the scale of cloud-native processing with the adaptability of AI to assist in complex analyses, build workflows, and generate spatial insights conversationally.</li><li>Securely connect CARTO to your own vetted AI models using your organization’s credentials and proxy.</li><li>Integrate these capabilities through the CARTO MCP Server, fully aligned with the Model Context Protocol (MCP).</li></ul></td></tr></tbody></table>

## Components of the CARTO platform <a href="#components-of-the-carto-platform" id="components-of-the-carto-platform"></a>

Depending on your usage of the CARTO platform, whether it’s for visualization, analysis, data access, or application development, you will be using different components of the platform.

### **Workspace**

The central location of all your experience with CARTO; connect to multiple cloud data warehouses, explore your geospatial data, access Maps, Workflows and AI Agents and access the different CARTO tools. [Login or create an account](https://app.carto.com/login).

<div align="left"><figure><img src="/files/c4JrmQfJMyMjNBdf7Cl5" alt="" width="399"><figcaption></figcaption></figure></div>

### **Builder**

CARTO Builder offers powerful map making capabilities, interactive data visualizations, collaboration and publication options - everything running natively from your cloud data warehouse.[ Learn more](/carto-user-manual/maps).

<div align="left"><figure><img src="/files/A0FX3jLfeCX6yb49PNgl" alt="" width="399"><figcaption></figcaption></figure></div>

### **AI Agents**

CARTO AI Agents provide a powerful conversational interface that allows anyone, regardless of technical expertise, to ask questions in natural language and receive instant, actionable insights. This marks a fundamental shift beyond dashboards to a dynamic, intuitive way of exploring your geospatial data. [Learn more](/carto-user-manual/ai-agents).

<div align="left"><figure><img src="/files/MxYG7OwaHdbqlBXRxRGe" alt="" width="375"><figcaption></figcaption></figure></div>

### **Workflows**

CARTO Workflows is a visual model builder that allows you to build complex spatial analyses and data preparation and transformation workflows without writing code. As with the rest of our platform, Workflows is fully cloud-native and runs in your own data warehouse. [Learn more](/carto-user-manual/workflows).

<div align="left"><figure><img src="/files/Xc98jJfbfQriBxip6dL4" alt="" width="399"><figcaption></figcaption></figure></div>

### **CARTO MCP Server**

The CARTO MCP Server enables AI Agents to use geospatial tools built with Workflows. By exposing workflows as MCP Tools, GIS teams can empower agents to answer spatial questions with organization-specific logic. Learn more.

<div align="left"><figure><img src="/files/iEIVWN7B2OYRd5EVHvBv" alt="" width="375"><figcaption></figcaption></figure></div>

### **Platform APIs and libraries**

For the Developer community, we have created a complete library of APIs, frameworks, connectors, and development tools to accelerate your spatial app development process. [View all libraries and APIs](https://api-docs.carto.com/).

<div align="left"><figure><img src="/files/fwXP6ExtE6bWBT20KReZ" alt="" width="396"><figcaption></figcaption></figure></div>

### **Analytics Toolbox**

The CARTO Analytics Toolbox is a suite of functions and procedures to easily enhance the geospatial capabilities available in the different cloud data warehouses. It contains more than 100 advanced spatial functions, grouped in different modules such as tiler, data, clustering, statistics, etc. [Learn more](https://docs.carto.com/analytics-toolbox/about-the-analytics-toolbox/).

<div align="left"><figure><img src="/files/UwxT6sFlMs2ygieQpEsq" alt="" width="396"><figcaption></figcaption></figure></div>

### **Data Observatory**

We catalog and distribute thousands of vetted public and premium spatial datasets, covering most global markets. These datasets are available across the different components of CARTO, so you can use them for data enrichment or as additional layers for your spatial apps and analyses. [Explore our Spatial Data Catalog](https://docs.carto.com/data-observatory/overview/getting-started/).

<div align="left"><figure><img src="/files/dLzDeEWC5mzs6QLPP3uO" alt="" width="399"><figcaption></figcaption></figure></div>

## Next steps

Now that you're familiar with CARTO, here are some beginner-friendly next steps you can take to get started:

1. [Create a new CARTO organization](/carto-user-manual/overview/creating-your-carto-organization) if you haven't already: our 14-day free trial does not require a credit card and allows you for unlimited testing.
2. Read our first-steps guides to [connect to your data](/getting-started/quickstart-guides/connecting-to-your-data), [create your first map](/getting-started/quickstart-guides/creating-your-first-map), [create your first agent](/carto-user-manual/ai-agents/creating-your-agent), [create your first workflow](/getting-started/quickstart-guides/creating-your-first-workflow), [create your first MCP tool](/carto-user-manual/workflows/workflows-as-mcp-tools) and [develop your first application](/getting-started/quickstart-guides/developing-your-first-application).
3. Discover our [CARTO Academy](https://academy.carto.com) where you will find easy-to-follow steps to build your first use cases using the CARTO platform.


# Quickstart guides

These guides will help you get started with CARTO. They're easy to follow with detailed steps, and will help you kickstart your project with your own connections, maps, workflows, and applications.

<table data-card-size="large" data-view="cards"><thead><tr><th></th><th></th><th>Featuring</th><th data-hidden data-card-target data-type="content-ref"></th><th data-hidden data-type="content-ref"></th><th data-hidden data-card-cover data-type="image">Cover image</th></tr></thead><tbody><tr><td><strong>Connecting to your data</strong></td><td>Learn how to connect CARTO to your own cloud data warehouse and how to easily import your local geospatial files.</td><td><a href="/pages/l2BiOKA9SNc13eZDITuk">CARTO Workspace</a></td><td><a href="/pages/MNmYzwF7nniCXpAddNWk">/pages/MNmYzwF7nniCXpAddNWk</a></td><td></td><td><a href="/files/mELDETLDoQzyLuNfrS4E">/files/mELDETLDoQzyLuNfrS4E</a></td></tr><tr><td><strong>Creating your first map</strong></td><td>Create interactive dashboards and web maps with your geospatial data using our map-making tool, CARTO Builder.</td><td><a href="/pages/0LlRC3jpq6dCamOYNGWo">CARTO Builder</a></td><td><a href="/pages/1Eqbkz5FIO9ZoFrifVIj">/pages/1Eqbkz5FIO9ZoFrifVIj</a></td><td></td><td><a href="/files/f8lC3pBhhAUowUhS5vEU">/files/f8lC3pBhhAUowUhS5vEU</a></td></tr><tr><td><strong>Creating your first workflow</strong></td><td>Learn how to use CARTO to build spatial analysis and data preparation workflows with our visual model builder.</td><td><a href="/pages/8nKcRFcXLRnDBhxWoUhX">CARTO Workflows</a></td><td><a href="/pages/TJKlTRHoTL82lExGeB7n">/pages/TJKlTRHoTL82lExGeB7n</a></td><td></td><td><a href="/files/Zd5gDRwldY4mw8lblPMQ">/files/Zd5gDRwldY4mw8lblPMQ</a></td></tr><tr><td><strong>Developing your first application</strong></td><td>Build a public application with CARTO + deck.gl and learn how to create powerful geospatial apps faster than ever.</td><td><a href="https://github.com/CartoDB/gitbook-documentation/blob/master/carto-for-developers/key-concepts/carto-for-deck.gl">CARTO + deck.gl</a></td><td><a href="/pages/bOzeP4Jse8xL68KEBSd2">/pages/bOzeP4Jse8xL68KEBSd2</a></td><td><a href="https://github.com/CartoDB/gitbook-documentation/blob/master/getting-started/quickstart-guides/broken-reference/README.md">https://github.com/CartoDB/gitbook-documentation/blob/master/getting-started/quickstart-guides/broken-reference/README.md</a></td><td><a href="/files/zXLDxcKKujLODSXS659r">/files/zXLDxcKKujLODSXS659r</a></td></tr></tbody></table>
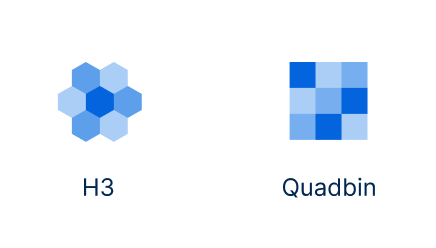

# Connecting to your data

While using demo data during your onboarding process is great for learning and exploring the platform, nothing feels more real than using your own data in CARTO to create stunning maps, powerful analyses, and interactive applications.

The main way to use your own data in CARTO is to [**connect CARTO to your data warehouse**](#creating-your-first-connection)**,** but if you still don't have a data warehouse (or if you don't have your geospatial files there) you can also [import files from your computer or from a URL](#importing-your-first-file).

But first, let's dig in a little bit to understand what happens when you connect your data to CARTO.

## CARTO connectivity explained

The CARTO platform is cloud-native by design. This means that we will always query the live data in your data warehouse, and your data warehouse will return the results, removing the need for ETLs and other costly and inefficient systems. We never make a copy or store the data on our servers, which means:

* If you change the data in your data warehouse, your map will also reflect the changes *(except cached results)*
* If you add to or modify the data in your data warehouse, it will also be immediately available in CARTO for you to create maps, workflows, and more.

Because of this, CARTO allows for unparalleled performance and scalability.

<div data-full-width="false"><figure><img src="/files/mELDETLDoQzyLuNfrS4E" alt=""><figcaption></figcaption></figure></div>

Now that we've reviewed the meaning and benefits of going cloud-native, let's create your first live connection to your data.

***

## Creating your first connection

You can connect CARTO to your data in:

* **Google BigQuery**
* **Snowflake**
* **Amazon Redshift**
* **PostgreSQL**
* **Databricks**
* **Oracle** *(private preview)*

{% hint style="info" %}
If you still don't use any of these data warehouses (or you aren't ready to connect just yet), you can skip this part and go directly to [Importing your first file](#importing-your-first-file).
{% endhint %}

Check out this video to learn how to create your first connection. The video shows a Google BigQuery connection, but the process is similar when connecting to other data warehouses. Each step is also explained in detail below the video:

{% embed url="<https://vimeo.com/855122596>" %}

<details>

<summary><strong>Step 1: Go to Workspace > Connections and create a new connection</strong></summary>

Access your CARTO Workspace and click on Connections in the left menu. A list of your current connections will be shown, but since this is your first time, it will only contain a connection to the CARTO Data Warehouse. Click on "**Create your first connection**" to get started.

</details>

<details>

<summary><strong>Step 2: Choose your Data Warehouse provider</strong></summary>

As discussed, you can choose between any of the available data warehouses. Some of them will have an additional step to choose the *authentication method* you want to use to connect.

*For example, to connect to Google BigQuery you can choose between a "Service Account" or the "Sign in with Google" method.*

</details>

<details>

<summary><strong>Step 3: Finish the connection setup</strong></summary>

Fill in the remaining fields to complete the connection. The information required is different depending on the data warehouse and the authentication method. Here you will find the full documentation for each option:

* [Connecting to Google BigQuery](/carto-user-manual/connections/bigquery)
* [Connecting to Snowflake](/carto-user-manual/connections/snowflake)
* [Connecting to Amazon Redshift](/carto-user-manual/connections/redshift)
* [Connecting to PostgreSQL](/carto-user-manual/connections/postgresql)
* [Connecting to Databricks](/carto-user-manual/connections/databricks)
* [Connecting to Oracle](/carto-user-manual/connections/oracle)

If your data warehouse requires you to whitelist incoming connections, here is a link to [our IP addresses to whitelist](https://github.com/CartoDB/gitbook-documentation/blob/master/getting-started/quickstart-guides/broken-reference/README.md).

You will also have the option to share your connection. Connections are private by default, but you can consider [sharing your connection](/carto-user-manual/connections/sharing-a-connection) if you want to collaborate with other users.

**Connections can be edited at any time**, so don't worry about other advanced fields for now. Later in your CARTO journey, you will learn about the [Analytics Toolbox](/data-and-analysis/analytics-toolbox-overview) (our set of native geospatial functions for your data warehouse) and other exciting features.

</details>

<details>

<summary><strong>Step 4: Test your connection</strong></summary>

Click on "Connect" and let CARTO test your connection:

* ❌ **If unsuccessful:** You will stay on the connections creation page and the error will give you more details about what's wrong. If you need assistance, our [Support Team](/faqs/support-packages) will be happy to help. Some things you should check:
  * Look for typos and double-check the data in each field
    * Check that your data warehouse is up and running
    * Make sure you have permission to read and write data in your data warehouse
* ✅ **If successful:** You will be redirected to the list of connections and you will see a new card with your connection details. Go back to this card at any time to edit or delete the connection.

🎉 **Congratulations!** You have now connected your data to CARTO. A quick way to test and explore this data is to open the [Data Explorer](/carto-user-manual/data-explorer) and list tables coming from your data warehouse. If you click on a table you will immediately see metadata and a map preview. From here, you can start your next geospatial project!

</details>

***

## Importing your first file

If your geospatial data is not yet in the cloud, CARTO can help you import it. There are many solutions to move data to the cloud data warehouses, but not many support geospatial formats, so let's take advantage of the CARTO platform.

Check out this video to learn how to import your first file. Each step is explained below the video:

{% embed url="<https://player.vimeo.com/video/853031730?badge=0&autopause=0&autoplay=1&player_id=0&app_id=58479>" fullWidth="false" %}

<details>

<summary><strong>Step 1: Prepare your data</strong></summary>

Before you start with your data import process, please make sure you've checked the [**import requirements**](/carto-user-manual/data-explorer/importing-data#supported-formats)**.** A few additional best practices:

* We recommend you give the name `geom` to the column containing the geometries for maximum compatibility.
* Check that your geometry data does not contain [invalid geometries](https://github.com/chrieke/geojson-invalid-geometry). These will be skipped in most cases, up to a certain threshold (see [error tolerance](/carto-user-manual/data-explorer/importing-data#supported-formats-1)), but could also cause the import process to fail.

</details>

<details>

<summary><strong>Step 2: Go to Data Explorer and start importing data</strong></summary>

Now that your data is ready, access your CARTO Workspace and click on Data Explorer in the left menu. Once there, click the "*Import data*" button in the top-right corner of the screen. Let's start our import process!

</details>

<details>

<summary>Step 3: Choose a file, a name, and a destination</summary>

There are two possible sources for your file:

* **A local file on your computer**: Click 'Browse' and select a file from your computer.
* **A file coming from a public URL**: Alternatively, you can provide the URL to the file. This URL must be publicly accessible by anyone on the internet. Please remember that CARTO won't sync this URL, it's a one-time import to your data warehouse.

Now click "Continue" and you will see two settings:

1. First, check and customize the "**Imported table name"**. This is the name of the table that we will create with your data.
2. Next, navigate through your connections to **select a destination** (i.e. a location in your data warehouse) where we will create the new table with the imported data.

If you're new to CARTO and you don't have any connections of your own, a safe way to get started is to import data into `CARTO Data Warehouse > organization data > shared`. Here you can [learn more about the CARTO Data Warehouse](/carto-user-manual/connections/carto-data-warehouse).

Once you're ready, click "*Save here*" to continue.

</details>

<details>

<summary><strong>Step 4: Choose a schema strategy</strong></summary>

When importing your data, it's necessary to assign a valid data type (`STRING`, `NUMBER, etc.`) to each column, and these data types need to match those in the destination data warehouse. For example: `VARCHAR` is valid in Snowflake, but not in Google BigQuery. The combined structure of columns and their data types is called **schema.**

There are two strategies for the schema:

* **Let CARTO automatically define the schema:** CARTO will read your table and guess the schema based on the data.
* **Customize the schema manually:** You will see a preview, and you can customize the data type for each column. Read more about [customizing the schema](/carto-user-manual/data-explorer/importing-data#custom-schema-limitations).

For this guide, let CARTO automatically set the schema - it works well in most cases. Click "*Continue*".

![](/files/y14Rit35DUBZTLMsCCJa)

</details>

<details>

<summary><strong>Step 5: Confirm and let CARTO take care of the import process</strong></summary>

On the next screen, you will see a summary of your import, including the name of the file, the desired destination and table name, and the schema strategy.

If everything looks okay, click "***Import***" and CARTO will start importing your file.

While importing your file, a progress bar will appear. You can minimize this window and the process will continue to run in the background, even if you close the browser tab. Some tips to understand this process:

* The larger the file, the longer the import will take. A 1 GB file could take up to a few minutes.
* If there are rows with errors *(e.g. invalid geometries, invalid values for a column, etc.),* the process will continue without those rows until a certain threshold. Learn more about [error tolerance when importing files](/carto-user-manual/data-explorer/importing-data#supported-formats-1).
* Finally, if there are too many errors or there's a major problem, an *<mark style="color:red;">error block</mark>* ❌ will appear with further details on why this import failed. If you need assistance, please contact our [Support Team](/faqs/support-packages).

</details>

<details>

<summary>Step 6: Use your imported data</summary>

Once the import process is finished, you can click on the "*<mark style="color:green;">Imported Successfully</mark> ✅*" block and it will redirect you to the Data Explorer, with that file opened. You can go back to this file at any time - it's already stored in your data warehouse!

🎉 **Congratulations!** From this page (which includes a map preview and a data preview), you can start creating maps and workflows.

</details>

***

## Next steps

Your data is now in CARTO! This is a major step toward unlocking all the potential that the platform has to offer. Using this data, there are a few options for what to do next:

1. Create a stunning map using [CARTO Builder](/carto-user-manual/maps), our map-making tool.
2. Use [CARTO Workflows](/carto-user-manual/workflows) to visually build a geospatial analysis block by block, with your data as a starting point or an input, with no coding skills required.
3. Use this data in a [simple public application created with CARTO + deck.gl](/carto-for-developers/guides/build-a-public-application).
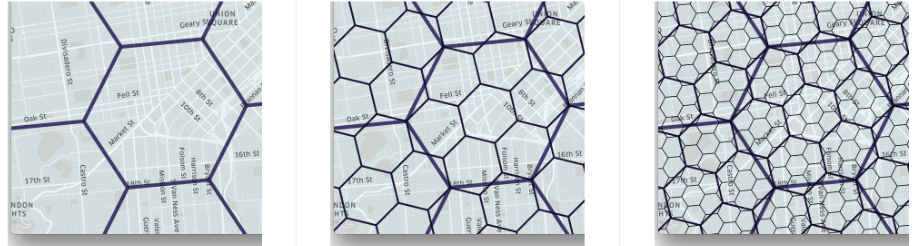

# Creating your first map

Begin your journey with [CARTO Builder](/carto-user-manual/maps), our dedicated tool for crafting and sharing interactive web maps using your geospatial data.

This guide introduces you to the core of CARTO Builder. From styling your layers to adding widgets and sharing an interactive map with other users; it's the ideal resource for both newcomers and those revisiting the foundational aspects of Builder.

### **Create a map**

The *Maps* section enables you to create and manage maps built with CARTO Builder in the CARTO Workspace.

From your *Maps* page, click *Create your first map*. This will open the CARTO's map-making tool, Builder.

<figure><img src="/files/iPbAPZTwdLKvj0RWM4Oi" alt=""><figcaption></figcaption></figure>

### **Add your Data Source**

1. Start by clicking on "*Add Source from...*" button. In CARTO Data Warehouse, navigate to *demo\_data > demo\_tables* and select “fires\_worldwide” dataset.

<figure><img src="/files/OFklbgGQfYmVf8Omo0YM" alt=""><figcaption><p><em>Add a source from CARTO Data Warehouse</em></p></figcaption></figure>

### Style the Layer

Once your data source is selected, CARTO Builder will automatically generate the default layer.

2. It's a good practice to rename this layer for clarify. Let's call it "Fires".
3. Navigate to the Layer Style settings. Here, under the "Fill Color" option, you'll find "More Options". In this section, you can select "Frp" column to style the layer based on the fire radiative power. Remember to select a color palette that makes sense for your data.

<figure><img src="/files/IBBDNXE63EWTYUJaJnfz" alt=""><figcaption><p><em>Style the layer based on fire radiative power</em></p></figcaption></figure>

4. For better visibility, specially at lower zoom levels, adjust the "Radius" to 1.5.

<figure><img src="/files/PYuwDq2QgLZSnGAasKr8" alt=""><figcaption><p><em>Setting the radius of your layer</em></p></figcaption></figure>

### Add Widgets

Widgets elevate the user experience by facilitating data exploration. Users can derive insights by interactive with interconnected filters that not only relate to each other but also adapt based on the map's viewport.

5. Configure a [*Formula Widget*](/carto-user-manual/maps/widgets/formula-widget) to calculate and display the total number of recorded fires.

<figure><img src="/files/IyFVq2qDJgBSUIDkgE4m" alt=""><figcaption><p><em>Configuring a Formula Widget</em></p></figcaption></figure>

6. Set up a [*Category Widget*](/carto-user-manual/maps/widgets/category-widget) to compare the total number of fires that started at night versus those during the day.

<figure><img src="/files/jL9saF2lSjrqqHVxHoL1" alt=""><figcaption><p><em>Adding a Category Widget</em></p></figcaption></figure>

7. Create a [*Histogram Widget*](/carto-user-manual/maps/widgets/histogram-widget) based on the "bright\_ti4" column to showcase the range and frequency of observed bright temperatures. Ensure you adjust the "*Custom min. value*" to 290 to filter out outliers.

<figure><img src="/files/Z8dPq51BqUbwitUgA9b1" alt=""><figcaption><p><em>Creating a Histogram Widget</em></p></figcaption></figure>

### Enable Interactions

8. Enable Interactions on your layer. We will choose the "*Click*" option so that Interactions are displayed when users "click" over specific features within the map. Here you can also decide what specific information will be displayed in the pop-up as well as the labelling and formatting.

<figure><img src="/files/YGA7PF0f9vD9i7dth7Fn" alt=""><figcaption><p><em>Enabling feature interactions</em></p></figcaption></figure>

### Setting Up the Legend

9. Adjust the legend to clarify the color indicator of your layer, such as "Fire Radiative Power (FRP)" for better understanding.
10. Under the "*Layer Control*", activate the "*Layer Selector*". Also, ensure the legend is set to display when the map is loaded by enabling the "*Open the legend when loading the map*" option.

<figure><img src="/files/JNEB5vVsOHM2B70igZgh" alt=""><figcaption><p><em>Setting up the legend properties</em></p></figcaption></figure>

### Choosing the right Basemap

11. With CARTO Builder, you have a wide range of choices when it comes to basemaps. For our current data, the CARTO Dark Matter provides an apt background, highlighting the fires.

<figure><img src="/files/Aq88COmX2t3vhd9BPEzx" alt=""><figcaption><p><em>Changing Basemap to CARTO Dark matter</em></p></figcaption></figure>

### Provide a Map Description

Map descriptions are essential for providing context and enhancing user experience.

12. To edit the Map Description, click the "i" button at the top right corner. This will open an editable template. Our description field supports Markdown, allowing you to format text, insert links, images, and bullet lists for clearer, more engaging descriptions. For a preview, toggle to View mode by clicking the "eye" icon.

<figure><img src="/files/kD5k9AyQHmtXs1Ztgbe2" alt=""><figcaption><p><em>Adding a Map Description for context</em></p></figcaption></figure>

### Ready to share?

13. Before sharing, give your map a meaningful title. How about "Fires across the globe"?

<figure><img src="/files/ga2x3w4j7QkVNwrPSj5b" alt=""><figcaption><p><em>Give a title to your map</em></p></figcaption></figure>

14. Once named, the "*Share*" button becomes active. Open it and choose the **Public** mode. This way, your map becomes accessible to anyone with the link.

<figure><img src="/files/gqESAxNe8gOJiDMuWlEk" alt=""><figcaption><p><em>Share your map publicly</em></p></figcaption></figure>

And voilà! Copy the map link, and you're ready to share.

<figure><img src="/files/5ot7O44TzTtfXPdypoUH" alt=""><figcaption></figcaption></figure>


# Creating your first workflow

[CARTO Workflows](/carto-user-manual/workflows) is a visual model builder that allows you to build complex spatial analyses and data preparation and transformation workflows without writing code. As with the rest of our platform, Workflows is fully cloud-native and runs in your own data warehouse leveraging its full scalability.

In order to learn more about the main sections of CARTO Workflows' interface and its available components, please check [this section](/carto-user-manual/workflows) of our documentation.

<figure><img src="/files/a5xAO5tci1dJEA2D6YIw" alt=""><figcaption></figcaption></figure>

In this first example we will create drive-time isolines for selected retail locations and we will then enrich them with population data leveraging the power of the H3 spatial index. This tutorial includes some examples of simple data manipulation, including filtering, ordering and limiting datasets, plus some more advanced concepts such as polyfiling areas with H3 cells and joining data using a spatial index in common.

As input data we will leverage a point-based dataset representing retail location that is available in the demo data accessible from the CARTO Data Warehouse connection (i.e. retail\_stores), and a table with data from CARTO's Spatial Feature dataset in the USA aggregated at H3 Resolution 8 (i.e. derived\_spatialfeatures\_usa\_h3res8\_v1\_yearly\_v2).

Let's get to it!

### **Creating a workflow and loading your data**

1. In your CARTO Workspace under the Workflows tab, create a new workflow.

<figure><img src="/files/8zSCHdkRTwVyBb4VPVXA" alt=""><figcaption></figcaption></figure>

2. Select the data warehouse where you have the table with the point data accessible. We'll be using the CARTO Data Warehouse, which should be available to all users.
3. Navigate the data sources panel to locate your table, and drag it onto the canvas. In this example we will be using the `retail_stores` table available in demo data. You should be able to preview the data both in tabular and map format.

<figure><img src="/files/fRPzfMXGILuUe8bOo5Bt" alt=""><figcaption></figcaption></figure>

### **Filtering data to select the relevant stores**

In this example, we want to select the 100 stores with the highest revenue, our top performing locations.

4. First, we want to eliminate irrelevant store types. Drag the **Select Distinct** component from the Data Preparation toolbox onto the canvas. Connect the stores source to the input side of this component (the left side) and change the column type to **storetype**.
5. Click run.

<figure><img src="/files/IjKlsl9DP5C59uhP74OZ" alt=""><figcaption></figcaption></figure>

6. Once run, click on the Select Distinct component and switch to the data preview at the bottom of the window. You will see a list of all distinct store type values. In this example, let’s say we’re only interested in supermarkets.
7. To select supermarkets, add a **Simple Filter** component from the Data Preparation toolbox.
8. Connect the retail stores to the filter, and specify the **column** as storetype, the **operator** as equal to, and the **value** as Supermarket (it's case sensitive).
9. Run!

<figure><img src="/files/QkEJyrTJcwHXAZk3Mf56" alt=""><figcaption></figcaption></figure>

This leaves us with 10,202 stores. The next step is to select the top 100 stores in terms of revenue.

10. Add an **Order By** component from the Data Preparation toolbox and connect it to the top output from Simple Filter. Note that the top output is all features which match the filter, and the bottom is all of those which don't.
11. Change the column to revenue and the order to descending.

<figure><img src="/files/NdF2KRVJzjzPhrBcqHYJ" alt=""><figcaption></figcaption></figure>

12. Next add a **Limit** component - again from Data Preparation - and change the limit to 100, connecting this to the output of Order By.
13. Click run, to select only the top 100 stores in terms of generated revenue.

<figure><img src="/files/SdNxjllGXfJAEhE95RIU" alt=""><figcaption></figcaption></figure>

### **Creating walk-time isolines around the stores**

14. Next, add a **Create Isolines** component from the Spatial Constructors toolbox. Join the output of Limit to this.
15. Change the **mode** to *walk*, the **range type** to time and **range limit** to 600 (10 minutes).

<figure><img src="/files/PnHFfDn7VS380pepie94" alt=""><figcaption></figcaption></figure>

16. Click run to create 10-minute drive-time isolines. Note this is quite an intensive process compared to many other functions in Workflows (it's calling to an external location data services provider), and so may take a little longer to run.

<figure><img src="/files/Bdjq8gW4IJIAq2p1XGhC" alt=""><figcaption></figcaption></figure>

### Leveraging the H3 spatial index to enrich geospatial data

17. We now add a second input table to the canvas, we will drag and drop the table `derived_spatialfeatures_usa_h3res8_v1_yearly_v2` from `demo_tables`. This table include different spatial features (e.g. population, POIs, climatology, urbanity level, etc.) aggregated at H3 grid with resolution 8.

<figure><img src="/files/rfXBnJj5pb7KCnHxdqXR" alt=""><figcaption></figcaption></figure>

18. In order to be able to join the population data with the areas around each retail store, we will use the component **H3 Polyfill** in order to compute the H3 grid cells in resolution 8 that cover each of the isolines around the stores. We configure the node by selecting the Geo column "geom", configuring the Resolution value to 8 and enabling the option to **Keep input table columns**.

<figure><img src="/files/mtazYpIIb1niZWbWbsQD" alt=""><figcaption></figcaption></figure>

19. Next step is to join both tables based on their H3 indices. For that, we will use the **Join** component. We select the columns named h3 present in both tables to perform the join operation.

<figure><img src="/files/bTAHQemNJ8Ca92snTGuO" alt=""><figcaption></figcaption></figure>

20. Check in the results tab that now you have joined data coming from the retail\_stores table with data from CARTO's spatial features dataset.

<figure><img src="/files/2pcYvLSceWigUljUfcv1" alt=""><figcaption></figcaption></figure>

21. As we now have multiple H3 grid cells for each retail store, what we want to do is to aggregate the population associated with the area around each store (the H3 polyfilled isoline). In order to do that we are going to use the **Group By** component, and we are going to aggregate the `population_joined` column with a SUM as the aggregation operation and we are going to group by the table by the `store_id` column.

<figure><img src="/files/j5ehiQKnDCoRiipR2aGc" alt=""><figcaption></figcaption></figure>

22. Now, check that in the results what we have again is one row per retail store (i.e. 100 rows) and in each of them we have the store\_id and the result of the sum of the population\_joined values for the different H3 cells that were associated with the isoline around each store.

<figure><img src="/files/rFWS2jCr17ItAa1nKo2y" alt=""><figcaption></figcaption></figure>

23. We are going to re-join with a **Join** component the data about the retail\_stores (including the point geometry) with the aggregated population we have now. We take the output of the previous **Limit** component and we add it to a new **Join** component together with the data we generated in the previous step. We will use the column `store_id` to join both tables.

<figure><img src="/files/xkigfUTnElobrOyLwDOO" alt=""><figcaption></figcaption></figure>

### Adding annotations to your workflow

A cool feature in CARTO Workflows is the possibility to add [annotations](https://docs.carto.com/carto-user-manual/workflows/workflow-canvas#annotations) in any area of the canvas, supporting the [Markdown syntax](https://www.markdownguide.org/basic-syntax/) (allowing for different levels of headers, text formats, images, etc.). This allows users to better explain the different steps performed in a workflow so other users can understand them.

In order to add an annotation to your canvas you only need to click on the corresponding icon on the top toolbar and select the location of the canvas where you want to add it.

<figure><img src="/files/grktd4mUdWtdmaVsnsd5" alt=""><figcaption></figcaption></figure>

###

<figure><img src="/files/Zd5gDRwldY4mw8lblPMQ" alt=""><figcaption></figcaption></figure>

### Sharing and further exploring the results of your workflow

There are multiple ways to share the results of your workflows, from [saving the results in a table](https://docs.carto.com/carto-user-manual/workflows/components/import-export#save_as_table) to [sending them via e-mail](https://docs.carto.com/carto-user-manual/workflows/components/import-export#send-by-email) to your colleagues. Additionally, note that from any step of your workflow (including that with the final saved table), you can create a map in [CARTO Builder](/carto-user-manual/maps) in order to build an interactive dashboard with the result of your workflow plus any of your other spatial data sources.

24. Finally we use the **Save as table** component to save the results as a new table in our data warehouse. We can then use the "Create map" option to build an interactive map to explore this data further.

<figure><img src="/files/kB2uS7ZAuc856gPLeQu5" alt=""><figcaption></figcaption></figure>

<figure><img src="/files/pkVgxTlpFVYnMuxrusSP" alt=""><figcaption></figcaption></figure>

### What next?

Check our [gallery of workflow examples](https://academy.carto.com/creating-workflows/workflow-templates) to keep learning how to get the most of this tool for your data transformation and analysis pipelines. The examples showcase a wide range of scenarios and applications: from simple building blocks for your geospatial analysis to more complex, industry-specific workflows tailored to facilitate running specific geospatial use-cases.


# Developing your first application

You can find a step-by-step [guide to develop your first public application](/carto-for-developers/guides/build-a-public-application) in the CARTO for Developers documentation:

Here you will learn the basic concepts required to create a public web application using CARTO, compatible with any Javascript Development Framework. With CARTO you don't need to be a geospatial expert to develop a geospatial application, so if you're a web developer you shouldn't have any issues following this guide.

After completing this guide you will be familiar with the following concepts:

* Scaffolding your application.
* Adding a [basemap](/carto-for-developers/key-concepts/carto-for-deck.gl/basemaps)
* Creating an [API Access Token](/carto-for-developers/key-concepts/authentication-methods/api-access-tokens) with limited access to your data warehouse.
* Visualizing a dataset with [deck.gl](https://github.com/CartoDB/gitbook-documentation/blob/master/carto-for-developers/key-concepts/carto-for-deck.gl)
* Publishing your app

<figure><img src="/files/DIrteNwkGuUD6f5Uso6e" alt=""><figcaption><p>Architecture diagram of our public application</p></figcaption></figure>

{% hint style="info" %}
During this guide, we're using the [CARTO Data Warehouse](/carto-user-manual/connections/carto-data-warehouse). The process explained here is also compatible with other Warehouses like BigQuery, Snowflake, Redshift, Databricks, Oracle, or Postgres. Instead of using <mark style="color:orange;">`connection=carto_dw`</mark>, you need to use <mark style="color:orange;">connection=\<your\_connection></mark>.
{% endhint %}

{% content-ref url="/pages/34FdmhCFM8q4NrXHgGUb" %}
[Build a public application](/carto-for-developers/guides/build-a-public-application)
{% endcontent-ref %}


# Overview

**CARTO for Agents** lets AI agents (Claude, ChatGPT, Cursor, Gemini, and others) work directly with the CARTO platform. Agents can connect to data warehouses, import and export geospatial data, build Builder maps, author and run workflows, expose those workflows as MCP tools, and check usage and activity.

There are three pieces:

* [**CARTO CLI**](/carto-for-agents/cli). A command-line interface (`@carto/carto-cli`) that exposes nearly every platform operation as a script-friendly command. Used by humans in a terminal, and by agents through tool use.
* [**CARTO MCP Server**](/carto-for-agents/mcp-server). A hosted [Model Context Protocol](https://modelcontextprotocol.io/) server that exposes built-in CARTO tools and any workflow you publish, ready to plug into web and desktop AI clients (Claude.ai, ChatGPT, MCP Inspector, Gemini CLI).
* [**CARTO Agent Skills**](/carto-for-agents/agent-skills). A public catalog of skill playbooks at [`CartoDB/agent-skills`](https://github.com/CartoDB/agent-skills) that teaches AI coding tools (Claude Code, Codex, Gemini CLI, Skills CLI) how to drive CARTO without re-discovering the API every session.

## Choose your tool

| You want to…                                                                                       | Use this                                                                                             |
| -------------------------------------------------------------------------------------------------- | ---------------------------------------------------------------------------------------------------- |
| Run CARTO operations from a script, CI/CD pipeline, or terminal                                    | [CARTO CLI](/carto-for-agents/cli)                                                                   |
| Let a chat agent (Claude.ai, ChatGPT, Gemini) call CARTO tools mid-conversation                    | [CARTO MCP Server](/carto-for-agents/mcp-server)                                                     |
| Have an AI coding agent (Claude Code, Cursor, Codex, Gemini CLI) operate CARTO inside your project | [CARTO CLI](/carto-for-agents/cli) + [CARTO Agent Skills](/carto-for-agents/agent-skills)            |
| Expose your own analytical workflow as an MCP tool an agent can call                               | [Workflows as MCP Tools](/carto-user-manual/workflows/workflows-as-mcp-tools) (in CARTO User Manual) |

## Using all three together

The three pieces are not mutually exclusive. In a coding harness like **Claude Code**, you can wire up any or all of them depending on what the agent needs to do.

* [**CARTO CLI**](/carto-for-agents/cli) runs locally and can be called by any agent that can execute shell commands. The agent uses `carto` to create maps, execute workflows, import data, manage credentials, and query the warehouse.
* [**CARTO MCP Server**](/carto-for-agents/mcp-server) speaks the standard Model Context Protocol, so it works with any compatible MCP client. Confirmed in production: Claude.ai, ChatGPT, Claude Desktop, MCP Inspector, MCP Jam. The agent renders interactive maps inline (via `view_map` and `load_builder_map`), calls any workflow you've published as an MCP tool, and discovers your connections and saved maps directly from the conversation.
* [**CARTO Agent Skills**](/carto-for-agents/agent-skills) ships installation paths for **Claude Code**, **Skills CLI**, **Codex**, and **Gemini CLI** today (see [Installation](/carto-for-agents/agent-skills/installation)). Other coding harnesses can consume the same skills if they support a compatible plugin or rules mechanism. The agent uses the skill to pick the right CLI flags, SQL dialect, async-job patterns, and use-case playbook for each request.

Workflows you build in CARTO can be published as new tools across **all three** surfaces. The same workflow is reachable from the CLI, from the MCP Server, and referenced by the skill playbooks.

{% hint style="info" %}
Looking for the **AI Agents you build inside Builder maps** (in-product agents bound to a map's data and tools)? That's a different product surface. See [CARTO User Manual → AI Agents](/carto-user-manual/ai-agents). Looking to **embed AI-powered map interaction in your own application**? See [CARTO for Developers → Build an AI-powered map application](/carto-for-developers/guides/build-an-ai-powered-map-application).
{% endhint %}


# CARTO CLI

The **CARTO CLI** (`@carto/carto-cli`) is the official command-line interface for CARTO. It exposes nearly every platform operation as a scriptable command. Find and manage maps, workflows, connections and credentials, import and export geospatial data, run SQL on connected warehouses, manage users, audit activity, transfer assets between organizations, and chat with the AI agents configured on your maps.

The CLI is designed to be driven by:

* **Humans** at the terminal, for one-off admin tasks, scripting, and CI/CD.
* **AI agents** like Claude Code, Cursor, Codex, or Gemini CLI through tool use. The `--json` global flag gives agents machine-readable output for every command.

<figure><img src="/files/2A3IEtNlrR8IIklt6On3" alt="" width="563"><figcaption></figcaption></figure>

## Capabilities

* **Builder maps**. Create, update, validate, publish, and copy CARTO Builder maps from a round-trippable JSON bundle. Inspect the AI agent surface available on each map. (Map `screenshot` is also available as an experimental command.)
* **Workflows**. Create, update, validate, verify, run, schedule, share, and publish CARTO Workflows. Publish a workflow as an MCP tool so any connected agent can call it. Install workflow extensions and browse the component catalog.
* **Projects (folders)**. Group maps and workflows into projects, with a local-sync workflow that lets you clone, edit, and push changes back from your machine.
* **Credentials**. Create and manage API Access Tokens, SPA OAuth clients, M2M OAuth clients, and Named Sources.
* **Connections**. List, create, update, and delete data warehouse connections. Browse the resource tree, search tables, and describe schemas.
* **Data Observatory**. Browse, search, and subscribe to spatial datasets from CARTO's public and premium catalog.
* **Data movement**. Import geospatial files (CSV, GeoJSON, GeoPackage, GeoParquet, KML, KMZ, Shapefile) from local files or URLs. Export warehouse tables back out, or transfer data between warehouses.
* **SQL**. Run SQL queries and DDL/DML jobs against your data warehouse from the terminal.
* **Organization and users**. View quotas, resources, and AI limits. List, invite, and manage users and pending invitations.
* **Activity data**. Query and export usage logs via DuckDB SQL (Enterprise Large+).
* **Superadmin operations**. Batch operations and cross-org resource transfers.
* **Multi-profile support**. Manage multiple CARTO accounts or environments with named profiles. Tokens are stored locally in `~/.carto_credentials.json`.
* **Single executable**. Bundled into one file with minimal dependencies.
* **JSON output**. Machine-readable output (`--json`) on every command for scripting and agent tool use.

## Get started

1. [Install the CLI](/carto-for-agents/cli/installation).
2. [Authenticate](/carto-for-agents/cli/authentication) to your CARTO organization with `carto auth login`. Configure additional [named profiles](/carto-for-agents/cli/authentication#multiple-profiles) if you work with several organizations.
3. [Browse the command reference](/carto-for-agents/cli/command-reference) to see every available command, flag, and example.
4. Walk through end-to-end [examples](/carto-for-agents/cli/examples): creating Builder maps and workflows from JSON, copying assets between organizations, scheduling workflows, importing data, and querying activity logs.

If you're driving the CLI from an AI coding agent, also see [CARTO Agent Skills](/carto-for-agents/agent-skills), the catalog of skills that teach Claude Code, Cursor, Codex, and Gemini CLI how to use the CLI idiomatically.


# Installation

The CARTO CLI is published on npm as [`@carto/carto-cli`](https://www.npmjs.com/package/@carto/carto-cli) and installs as a global `carto` binary.

## Prerequisites

* **Node.js 18 or newer.** Check with `node --version`.
* A CARTO organization. The CLI works against CARTO Cloud (any region) and CARTO Self-Hosted deployments.

{% hint style="warning" %}
**CARTO Self-Hosted compatibility**

The CARTO CLI evolves with the rest of the CARTO Platform. The latest version of the CARTO CLI will always be compatible with the SaaS version of the platform. However, newer versions of the CLI might not be compatible with older versions of CARTO Self-Hosted deployments, due to missing API functionalities.

For a full compatibility list, check the [CARTO Self-Hosted release notes](/carto-self-hosted/release-notes).
{% endhint %}

## Install via npm

```bash
npm install -g @carto/carto-cli
```

Verify the install:

```bash
carto --version
carto --help
```

## Standalone executables

For environments where Node.js is not available, single-file executables are produced for macOS, Linux, and Windows during release. See the [carto-cli releases](https://www.npmjs.com/package/@carto/carto-cli) for download links and SHA checksums.

## Upgrade

```bash
npm install -g @carto/carto-cli@latest
```

## Next steps

* [Authenticate](/carto-for-agents/cli/authentication) to your CARTO organization with `carto auth login`.
* If you manage multiple CARTO organizations or environments, set up [named profiles](/carto-for-agents/cli/authentication#multiple-profiles).


# Authentication & profiles

The CLI authenticates to CARTO with an OAuth 2.0 + PKCE browser flow. The first time you run `carto auth login`, the CLI opens your browser, you complete the standard CARTO login (including SSO if your organization requires it), and the CLI captures the resulting access token and stores it locally.

## Logging in

```bash
# Interactive browser-based login (recommended)
carto auth login

# Login to a named profile
carto auth login staging
```

The login flow:

1. Displays an authorization URL.
2. Opens your browser (you may need to copy/paste the URL manually in headless environments).
3. Waits for you to complete the login.
4. Captures the access token and your user/organization info.
5. Stores the credentials in `~/.carto_credentials.json`.
6. Configures the API base URL based on your tenant.

### Logging in to a specific organization (with or without SSO)

If your organization uses SSO, or if you have access to multiple organizations, log in with the organization name:

```bash
# Standard organization name
carto auth login --organization-name production

# Organization name with spaces (requires quotes)
carto auth login --organization-name "ACME Corporation"

# Save to a specific profile
carto auth login acme-prod --organization-name "ACME Corporation"
```

How it works:

1. The CLI queries your organization's SSO configuration from the CARTO API.
2. **If SSO is configured:** the browser opens to your organization's SSO login page (SAML/OIDC).
3. **If SSO is not configured:** standard OAuth login proceeds.
4. The organization context is preserved for re-authentication.

**Requirements:**

* Use the exact organization name (case-sensitive, include spaces in quotes).
* For SSO logins, your organization administrator must have configured SSO in CARTO.

### Auth login options

| Option                       | Description                                                                                                 |
| ---------------------------- | ----------------------------------------------------------------------------------------------------------- |
| `--env <environment>`        | Auth environment: `production`, `staging`, `local`, `dedicated-NN`. Only set this if instructed by support. |
| `--organization-name <name>` | Organization name for SSO login. Use quotes if the name contains spaces.                                    |
| `--organization-id <id>`     | Organization ID for SSO login (future support).                                                             |

## Checking status

```bash
carto auth status                   # Status of the current profile
carto auth status production        # Status of a named profile
```

Example output:

```
$ carto auth status
✓ Authenticated

Current profile: my-org/me@example.com (default)
  Token source: credentials
  Token: eyJhbGciOiJSUzI1NiIs...
  Expiration: 23/10/2025, 12:42:45
  Time remaining: (in 18 hours)
  Status: 🟢 Valid

  Tenant: clausa.app.carto.com (gcp-us-east1)
  Organization: my-org (ac_abc123)
  User: me@example.com
```

`carto auth whoami` returns the current user's profile (user ID, name, email, account info, roles).

## Token lifetime and re-authentication

Access tokens typically expire after 24 hours. The CLI extracts the expiration from the JWT and surfaces it in `carto auth status`:

| Indicator            | Meaning                                                                |
| -------------------- | ---------------------------------------------------------------------- |
| 🟢 **Valid**         | More than 10% of token lifetime remaining.                             |
| 🟡 **Expiring soon** | Less than 10% of lifetime remaining (\~2.4 hours for a 24-hour token). |
| 🔴 **Expired**       | Token has expired and must be renewed.                                 |

When a token is expiring or expired, the CLI suggests a context-aware re-authentication command that preserves your profile, environment, and (if applicable) organization name — so you don't accidentally create a duplicate profile or end up in the wrong environment.

```
⚠️  Warning: Token is expiring soon
   Less than 10% of token lifetime remaining
   Consider re-authenticating to avoid interruptions:
   carto auth login my-profile
```

## Logging out

```bash
carto auth logout                   # Logout from the current profile
carto auth logout staging           # Logout from a named profile
```

This removes the stored credentials for that profile.

## Multiple profiles

Use **named profiles** when you work with more than one CARTO organization (production vs. staging, multiple customer accounts, multiple regions, …). Each profile holds its own credentials and tenant configuration.

A profile represents authentication to a specific:

* **Tenant** (infrastructure region) — e.g. `gcp-us-east1`, `onp-acme-prod` (self-hosted).
* **Organization** (account) — e.g. `team`, `carto-prod`.
* **User** (authenticated user) — e.g. `user@company.com`.

```bash
# Login to multiple profiles
carto auth login                    # Auto-suggests: tenant_id/org_name/user@email.com
carto auth login staging
carto auth login production

# Switch the current default profile
carto auth use production
carto auth use staging

# Use a specific profile for a single command (overrides default)
carto --profile staging maps list
carto --profile production workflows list

# List all profiles and the current default
carto auth status

# Logout removes only that profile
carto auth logout staging
```

`carto auth status` (with no arguments) shows the full hierarchy: tenant → organization → user, plus all available profiles with the current default marked.

**Profile management notes:**

* **Auto-generated names** — Login without a name suggests profiles in the format `tenant_id/org_name/user@email.com`.
* **Custom names** — Provide a short name during login (e.g., `staging`, `production`).
* **Current profile** — The default used when `--profile` is not specified.
* **Override per command** — Use `--profile <name>` on any command, or set `CARTO_PROFILE` in the environment.
* **Backwards compatibility** — Old single-profile credentials files are migrated automatically on first use.

For a detailed walkthrough of using profiles to copy maps and workflows between organizations, see [Examples → Copying maps and workflows between organizations](/carto-for-agents/cli/examples#copying-maps-and-workflows-between-organizations).

## Credentials storage

See [Configuration](/carto-for-agents/cli/configuration) for the credentials file format, environment variables, and authentication priority.


# Configuration

## Credentials file

The CLI stores authentication credentials in `~/.carto_credentials.json` with support for multiple profiles:

```json
{
  "current_profile": "production",
  "profiles": {
    "production": {
      "token": "your-bearer-token",
      "tenant_id": "gcp-us-east1",
      "tenant_domain": "carto.acme.com",
      "organization_id": "ac_yv1im1y2",
      "organization_name": "carto-prod",
      "user_email": "user@acme.com"
    },
    "staging": {
      "token": "staging-bearer-token",
      "tenant_id": "gcp-us-east1",
      "tenant_domain": "carto-dev.acme.com",
      "organization_id": "ac_7p1sk0gs",
      "organization_name": "Carto-Dev",
      "user_email": "dev@acme.com"
    }
  }
}
```

**Structure:**

* `current_profile` — the default profile used when `--profile` is not specified.
* `profiles` — every saved profile keyed by name. Each entry holds:
  * `token` — bearer token (stored without the `Bearer` prefix).
  * `tenant_id` — infrastructure region (e.g. `gcp-us-east1`, `onp-acme-prod` for a self-hosted tenant).
  * `tenant_domain` — organization domain (e.g. `carto.acme.com`).
  * `organization_id` — account ID (e.g. `ac_yv1im1y2`).
  * `organization_name` — human-readable organization name.
  * `user_email` — authenticated user email.

The API base URL is automatically constructed as `https://{tenant_id}.api.carto.com`.

{% hint style="info" %}
Old-format credentials files (single profile at the root level) are automatically migrated to this nested structure on first use.
{% endhint %}

## Authentication priority

The CLI looks for credentials in this order. The first source found wins:

1. The `--token` flag on the command line.
2. The `CARTO_API_TOKEN` environment variable.
3. The credentials file (`~/.carto_credentials.json`).
4. Legacy config file (`~/.carto/config.json`) — for backwards compatibility.

## Environment variables

| Variable          | Description                                                            |
| ----------------- | ---------------------------------------------------------------------- |
| `CARTO_API_TOKEN` | API token for authentication. Overrides the credentials file.          |
| `CARTO_PROFILE`   | Profile to use. Overrides `current_profile` from the credentials file. |
| `CARTO_AUTH_ENV`  | Auth environment. Only set if instructed by support.                   |
| `CARTO_AUTH_PORT` | Callback server port for the OAuth login flow. Default: `3003`.        |

## Global flags

These flags work with every command:

| Flag               | Description                                                           |
| ------------------ | --------------------------------------------------------------------- |
| `--json`           | Output in JSON format. Use for scripting and agent tool use.          |
| `--debug`          | Show request details (method, URL, headers, body). Tokens are masked. |
| `--token <token>`  | Override the API token for this command.                              |
| `--base-url <url>` | Override the base API URL.                                            |
| `--profile <name>` | Use a specific profile (default: the `current_profile` value).        |
| `--version`, `-v`  | Show version.                                                         |
| `--help`, `-h`     | Show help.                                                            |

### Debugging requests

```bash
# Show full request details for any command
carto --debug maps list

# Combine with --json for clean output + visible request internals
carto --debug --json auth status
```

Debug output includes the HTTP method, full URL, request headers (with the token masked), and the request body for `POST` / `PATCH` requests.

### Using environment variables

```bash
# Authenticate via env var (useful in CI/CD)
export CARTO_API_TOKEN="eyJhbGc..."
carto maps list

# Override with CLI flags
carto --token "different-token" --base-url "https://eu-west1.api.carto.com" maps list
```


# Command reference

Every CARTO CLI command, organized by command group. The CLI uses a hierarchical structure:

```
carto [global-options] <command> <subcommand> [args...]
```

For global options (`--json`, `--debug`, `--profile`, …) and environment variables, see [Configuration](/carto-for-agents/cli/configuration).

| Group                                                                    | Purpose                                                                                                  |
| ------------------------------------------------------------------------ | -------------------------------------------------------------------------------------------------------- |
| [`auth`](/carto-for-agents/cli/command-reference/auth)                   | Personal authentication: log in, log out, switch profiles, check status.                                 |
| [`credentials`](/carto-for-agents/cli/command-reference/credentials)     | Manage application credentials (API tokens, SPA OAuth clients, M2M OAuth clients).                       |
| [`maps`](/carto-for-agents/cli/command-reference/maps)                   | Manage Builder maps: create, update, validate, publish, schema, agents, copy, screenshot (experimental). |
| [`workflows`](/carto-for-agents/cli/command-reference/workflows)         | Manage Workflows: create, update, validate, verify, run, share, schedule, mcp publish.                   |
| [`projects`](/carto-for-agents/cli/command-reference/projects)           | Manage projects (folders) that group maps and workflows, with local-sync workflow.                       |
| [`connections`](/carto-for-agents/cli/command-reference/connections)     | Manage data warehouse connections.                                                                       |
| [`named-sources`](/carto-for-agents/cli/command-reference/named-sources) | Manage Named Sources — server-side aliases for SQL queries.                                              |
| [`do`](/carto-for-agents/cli/command-reference/do)                       | Data Observatory: browse, search, sample, subscribe to spatial datasets.                                 |
| [`imports`](/carto-for-agents/cli/command-reference/imports)             | Import geospatial files (CSV, GeoJSON, GeoPackage, Shapefile, …) from local files or URLs.               |
| [`export`](/carto-for-agents/cli/command-reference/export)               | Export warehouse tables to file (GeoParquet, GeoJSON, Shapefile, CSV, …) or cloud storage.               |
| [`transfer`](/carto-for-agents/cli/command-reference/transfer)           | Transfer data between warehouses.                                                                        |
| [`sql`](/carto-for-agents/cli/command-reference/sql)                     | Run SQL queries (returns results) and SQL jobs (DDL/DML) on your data warehouse.                         |
| [`org`](/carto-for-agents/cli/command-reference/org)                     | View organization statistics, resources, and quotas.                                                     |
| [`users`](/carto-for-agents/cli/command-reference/users)                 | Manage organization users and pending invitations.                                                       |
| [`activity`](/carto-for-agents/cli/command-reference/activity)           | Query and export activity logs and usage data (Enterprise Large+).                                       |
| [`admin`](/carto-for-agents/cli/command-reference/admin)                 | Superadmin operations: list-all, batch-delete, transfer.                                                 |
| [`ai`](/carto-for-agents/cli/command-reference/ai)                       | Chat with map AI agents (`aifeature`) and access CARTO's LLM proxy (`aiproxy`).                          |


# auth

Personal authentication to CARTO. Manage login sessions, named profiles, and view current user information.

For an overview of the OAuth flow, profiles, and re-authentication behavior, see [Authentication & profiles](/carto-for-agents/cli/authentication).

## `carto auth login [profile]`

Open a browser-based OAuth 2.0 + PKCE login flow and store the resulting credentials.

```bash
carto auth login                              # Login to default profile
carto auth login staging                      # Login to a named profile
carto auth login --organization-name "ACME"   # Organization-specific login (SSO or standard)
carto auth login acme-prod --organization-name "ACME Corporation"
```

**Arguments:**

* `[profile]` — Optional profile name. If omitted, an auto-generated name `tenant_id/org_name/user@email.com` is used.

**Options:**

| Option                       | Description                                                                                            |
| ---------------------------- | ------------------------------------------------------------------------------------------------------ |
| `--env <environment>`        | Auth environment: `production`, `staging`, `local`, `dedicated-NN`. Only set if instructed by support. |
| `--organization-name <name>` | Organization name for SSO login. Use quotes if it contains spaces.                                     |
| `--organization-id <id>`     | Organization ID for SSO login (future support).                                                        |

## `carto auth logout [profile]`

Remove stored credentials.

```bash
carto auth logout                   # Logout from default profile
carto auth logout staging           # Logout from named profile
```

## `carto auth status [profile]`

Show authentication status, token expiration, and the full tenant → organization → user hierarchy. With no arguments, also lists every available profile and marks the current default.

```bash
carto auth status
carto auth status production
```

## `carto auth use <profile>`

Set the given profile as the current default. Subsequent commands will use it unless overridden by `--profile` or `CARTO_PROFILE`.

```bash
carto auth use production
```

## `carto auth whoami`

Show the authenticated user's profile (user ID, name, email, account info, roles).

```bash
carto auth whoami
```


# credentials

Manage application credentials — API tokens, SPA OAuth clients, and M2M OAuth clients. These credentials are separate from your personal authentication (`carto auth login`) and are used by applications and backend services to call CARTO APIs.

**Credential types:**

* **API Access Tokens** — server-side API access with specific connection and source grants.
* **SPA OAuth Clients** — Single Page Application authentication flows.
* **M2M OAuth Clients** — Machine-to-Machine authentication flows.

## `carto credentials list [type]`

List credentials, optionally filtered by type.

```bash
carto credentials list              # All credentials
carto credentials list tokens       # Only API tokens
carto credentials list spa          # Only SPA OAuth clients
carto credentials list m2m          # Only M2M OAuth clients
```

## `carto credentials create token`

Create an API Access Token. A token can be scoped to one or more `(connection, source)` pairs and an explicit list of allowed APIs.

```bash
# Single fully-qualified source
carto credentials create token \
  --connection carto_dw \
  --source "carto.shared.demo_table" \
  --apis sql,maps

# Wildcard pattern (note: minimum two dot-separated segments before the wildcard)
carto credentials create token \
  --connection carto_dw \
  --source "carto.shared.CARTO_*" \
  --apis sql,maps

# All sources on a connection, with expiry and a label
carto credentials create token \
  --connection carto_dw \
  --source "*" \
  --apis sql,maps \
  --name "demo-day-token" \
  --expiration-date 7d
```

**Options:**

| Option                  | Description                                                                                                                                                             |
| ----------------------- | ----------------------------------------------------------------------------------------------------------------------------------------------------------------------- |
| `--connection <name>`   | Connection to grant. Repeat alongside every `--source` to grant multiple connections in one token.                                                                      |
| `--source <pattern>`    | Fully-qualified table/tileset/query, a wildcard pattern like `"carto.shared.CARTO_*"` (minimum two dot-separated segments), or `"*"` for all sources on the connection. |
| `--apis <list>`         | Comma-separated API list: `sql`, `maps`, `imports`, `lds`.                                                                                                              |
| `--referer <url>`       | Allowed referer URL.                                                                                                                                                    |
| `--name <name>`         | Optional token label (auto-generated if omitted).                                                                                                                       |
| `--expiration-date <d>` | Optional expiry. ISO date (`2027-01-01`) or shorthand (`1d`, `2w`, `6m`, `1y`). Tokens never expire if omitted.                                                         |

## `carto credentials create spa`

Create a SPA (Single Page Application) OAuth Client.

```bash
carto credentials create spa \
  --title "My Web App" \
  --callback "https://myapp.com/callback" \
  --logout-url "https://myapp.com/logout" \
  --web-origin "https://myapp.com" \
  --allowed-origin "https://myapp.com"
```

**Options:**

| Option                   | Description                   |
| ------------------------ | ----------------------------- |
| `--title <name>`         | Application title (required). |
| `--login-uri <url>`      | Login initiation URI.         |
| `--callback <url>`       | OAuth callback URL.           |
| `--logout-url <url>`     | Logout redirect URL.          |
| `--web-origin <url>`     | Web origin URL.               |
| `--allowed-origin <url>` | Allowed CORS origin.          |

## `carto credentials create m2m`

Create a Machine-to-Machine OAuth Client.

```bash
carto credentials create m2m --title "Backend Service"
```

**Options:**

| Option           | Description                   |
| ---------------- | ----------------------------- |
| `--title <name>` | Application title (required). |

## `carto credentials get <type> <id>`

Get details for a specific credential.

```bash
carto credentials get token <token-id>
carto credentials get spa <client-id>
carto credentials get m2m <client-id>
```

## `carto credentials update <type> <id>`

Update a credential's properties.

```bash
carto credentials update token <token-id> --apis sql,maps
carto credentials update spa <client-id> --title "Updated Title"
```

## `carto credentials delete <type> <id>`

Delete a credential. `revoke` is an alias for `delete` on M2M clients.

```bash
carto credentials delete token <token-id>
carto credentials delete spa <client-id>
carto credentials revoke m2m <client-id>
```


# maps

Manage CARTO Builder maps. Create, edit, validate, publish, copy across organizations, screenshot, and inspect the agent surface.

```bash
carto maps list [options]                        # List maps
carto maps get <map-id>                          # Pretty details; --json emits round-trippable JSON
carto maps create [json]                         # Create from JSON (positional, path, or stdin)
carto maps update <map-id> [json]                # Update (partial JSON OK)
carto maps validate [json]                       # Tier-1 preflight (offline, no API calls)
carto maps verify-remote [json]                  # Tier-0 + Tier-2 (validate + warehouse dry-runs)
carto maps publish <map-id>                      # Freeze a snapshot so viewers see current state
carto maps schema [section]                      # JSON Schema reference for agents
carto maps agents <subcommand>                   # AI agent introspection (see below)
carto maps datasets update <map-id> <dataset-id> # PATCH a single dataset on an existing map
carto maps screenshot <map-id> [options]         # Save a PNG screenshot (opt-in Chromium)
carto maps copy <map-id> --dest-profile <name>   # Duplicate (cross-org or same org)
carto maps delete <map-id>                       # Delete map
```

## The bundle model

`maps get <id> --json` returns a **round-trippable bundle** — the same shape that `maps create` and `maps update` accept. Server-computed fields are stripped, privacy is synthesised from top-level fields, and datasets are inlined. You can pipe the output straight back in:

```bash
carto maps get abc123 --json > map.json
jq '.title = "New title"' map.json | carto maps update abc123
```

Bundle input accepts a positional JSON string, a filesystem path, or stdin:

```bash
carto maps create '{"title":"…", "connectionId":"…"}'   # Inline JSON
carto maps create ./map.json                            # Path
carto maps create < map.json                            # Stdin
```

Pre-flight validation (Tier-1 schema checks, source SQL dry-run, privacy coercion, agent model auto-fill, `aggregationExp` auto-fill for spatial-index datasets on supported providers) runs before any write — broken bundles reject without creating an orphan map. Post-write verification surfaces as warnings in the JSON output.

For the full bundle recipe (including authoring patterns and the agent skill that drives it), see the [`carto-create-builder-maps`](https://github.com/CartoDB/agent-skills/tree/master/skills/carto-create-builder-maps) skill.

## Two-version model

Private editing mutates the live map via `PATCH /maps/:id`. **Shared and public viewers** read from a frozen snapshot created by `POST /maps/:id/publish`. Setting `privacy=shared` or `privacy=public` puts the map in dashboards, but viewers see the prior snapshot (or nothing if never published). Use `carto maps publish <id>` to update the snapshot — or pass `--publish` to `maps update` to chain both.

`create` and `update` emit an `UNPUBLISHED_SHARED_MAP` warning when privacy is `shared`/`public` but no snapshot exists.

## `carto maps list`

| Option                           | Description                                           |
| -------------------------------- | ----------------------------------------------------- |
| `--mine`                         | Show only your maps.                                  |
| `--search <term>`                | Free-text search across title/description.            |
| `--privacy <level>`              | Filter by privacy: `private`, `shared`, `public`.     |
| `--tags <json>`                  | Filter by tags (JSON array, e.g. `'["demo","poc"]'`). |
| `--order-by <field>`             | Sort by `updatedAt`, `createdAt`, `title`.            |
| `--order-direction <dir>`        | `ASC` or `DESC`.                                      |
| `--page <n>` / `--page-size <n>` | Pagination.                                           |
| `--all`                          | Fetch all pages automatically.                        |

## `carto maps create` / `carto maps update`

| Option                    | Description                                                                                                                               |
| ------------------------- | ----------------------------------------------------------------------------------------------------------------------------------------- |
| `--dry-run`               | (`update`) Print planned actions without writing.                                                                                         |
| `--datasets-mode replace` | (`update`) Delete datasets not mentioned in the input (default: merge).                                                                   |
| `--publish`               | (`update`) Chain `maps publish <id>` after the update succeeds.                                                                           |
| `--allow-kepler-replace`  | Allow wholesale `keplerMapConfig` partial-update replacement (use the read-modify-write cycle instead unless you know what you're doing). |

The response includes `builderUrl`, `viewerUrl`, and `publicUrl` as first-class fields. `mapUrl` is kept as a back-compat alias for `builderUrl` and will be dropped on the next major.

## `carto maps validate` / `carto maps verify-remote`

* `maps validate` — **Tier-1 only**, offline, no API calls. Same input surface as `create`. Exits 1 on any issue. Use to iterate on a bundle before writing.
* `maps verify-remote` — Tier-1 + Tier-2 (warehouse-side checks: source dry-runs, region match, region-aware SQL). Reads credentials but never calls `POST /maps`. Useful before shipping a bundle in CI.

## `carto maps publish`

Freeze a snapshot so shared/public viewers see the current state:

```bash
carto maps publish abc123
# Or chain it onto an update:
carto maps update abc123 < map.json --publish
```

Snapshots are versioned; the platform tracks `lastPublishedAt` per map. Republishing replaces the prior snapshot.

## `carto maps schema [section]`

JSON Schema reference for agents authoring bundles. Sections include `bundle`, `dataset`, `layer.tileset`, `layer.h3`, `layer.quadbin`, `layer.heatmapTile`, `layer.clusterTile`, `layer.raster`, `widgets`, `sqlparameters`, `popupsettings`, `privacy`, `agent`, `enums`, `mapstate`, `mapstyle`, `mapsettings`, `uistate`, `legendsettings`.

```bash
carto maps schema layer.h3
carto maps schema uistate
```

{% hint style="info" %}
**Scale-with-zoom-level radius (tileset point layers)**: `maps schema layer.tileset` includes four optional `visConfig` fields enabling Builder's third Radius mode — alongside Fixed and a column field:

`maps validate` rejects two shapes that would silently break in Builder: `radiusScaleWithZoom: true` without a `radius` value (renders zero-pixel points at the reference zoom), and `radiusScaleWithZoom: true` alongside a `radiusField` (mutually exclusive Radius modes).
{% endhint %}

| Field                 | Type             | Notes                                         |
| --------------------- | ---------------- | --------------------------------------------- |
| `radiusScaleWithZoom` | `boolean`        | Enables the mode.                             |
| `radiusReferenceZoom` | `number` (0–22)  | Zoom level at which `radius` is rendered 1:1. |
| `sizeMinPixels`       | `number` (1–100) | Lower clamp as the user zooms out.            |
| `sizeMaxPixels`       | `number` (1–100) | Upper clamp as the user zooms in.             |

## `carto maps agents`

Discover the AI surface available on the current tenant:

```bash
carto maps agents status       # Is CARTO AI enabled? What's the default model?
carto maps agents models       # AI models you can put in agent.config.model (formatted "{source}::{provider}::{model}")
carto maps agents mcp-tools    # MCP tools (workflow-backed) available for agent.config.tools[]
carto maps agents core-tools   # Hardcoded core Builder tools and their activation rules
```

Call `maps agents status` before emitting an `agent` block in a bundle — bundles authored for tenants with CARTO AI disabled get the `agent` block stripped with a warning.

## `carto maps datasets update`

PATCH a single dataset on an existing map without re-emitting the full bundle. Used to swap the SQL, columns, or aggregation of one source while leaving the rest of the map alone.

```bash
carto maps datasets update <map-id> <dataset-id> '{"source":"SELECT … FROM new_table"}'
```

## `carto maps copy`

Duplicate a map between profiles (organizations). Connections are mapped automatically by name; supply explicit mappings for renamed cases.

```bash
# Auto-map connections by name (default)
carto maps copy <map-id> --dest-profile production

# Manual mapping for renamed connections
carto maps copy <map-id> --dest-profile prod \
  --connection-mapping "dev-bq=prod-bq,dev-sf=prod-sf"

# Override source profile and title
carto maps copy <map-id> --source-profile staging --dest-profile prod \
  --title "Production Map"
```

| Option                       | Description                                                                         |
| ---------------------------- | ----------------------------------------------------------------------------------- |
| `--dest-profile <name>`      | (Required) Destination profile name.                                                |
| `--source-profile <name>`    | Source profile (default: current).                                                  |
| `--connection-mapping <map>` | Per-source map (e.g. `"src1=dst1,src2=dst2"`). Preferred for multi-connection maps. |
| `--connection <name>`        | Legacy: single connection for all datasets.                                         |
| `--title <title>`            | Override the map title in the destination.                                          |
| `--skip-source-validation`   | Skip validating that destination connections can read source tables/queries.        |
| `--keep-privacy`             | Preserve privacy setting from source (default: true).                               |

For a full walkthrough including connection-mapping scenarios and troubleshooting, see [Examples → Copying maps and workflows between organizations](/carto-for-agents/cli/examples#copying-maps-and-workflows-between-organizations).

## `carto maps screenshot`

{% hint style="info" %}
`carto maps screenshot` is **experimental**. Its flags, render engines, and output may change in future releases.
{% endhint %}

Render a PNG of the map. Two render engines:

* **`light`** (default) — a bundled minimal viewer (`@deck.gl/carto` `fetchMap`). \~2.5 MB asset, \~8 s cold start, \~10 MB network. Renders layers + basemap. **No widgets, legends, popups, or chrome.**
* **`full`** — the full CARTO Builder viewer at `/viewer/:mapId` rendered in a headless iframe. \~20 s, \~28 MB. Full feature parity.

```bash
carto maps screenshot abc123 -o map.png
carto maps screenshot abc123 --lat 40.42 --lng -3.70 --zoom 12 --hide-overlays
carto maps screenshot abc123 --render-engine full
```

| Option                                             | Description                                           |
| -------------------------------------------------- | ----------------------------------------------------- |
| `--render-engine <e>`                              | `light` (default) or `full`.                          |
| `-o, --output <path>`                              | Output file path (default: `screenshot.png`).         |
| `--width <px>` / `--height <px>`                   | Viewport size (default: 1280 × 800).                  |
| `--lat <deg>` / `--lng <deg>`                      | Center coordinates.                                   |
| `--zoom <n>` / `--bearing <deg>` / `--pitch <deg>` | Viewport.                                             |
| `--layers <indices>`                               | Comma-separated visible layer indices (e.g. `"0,2"`). |
| `--search <query>`                                 | Address or `"lat,lng"` to center on.                  |
| `--hide-overlays`                                  | Hide CARTO logo, attribution, zoom controls, legend.  |
| `--wait <seconds>`                                 | Optional pad after auto-detected render (default: 0). |
| `--timeout <seconds>`                              | Navigation/render timeout (default: 60).              |
| `--full-page`                                      | Capture full scrollable page instead of viewport.     |
| `--no-cache`                                       | Bypass persistent Chromium profile (`full` engine).   |

{% hint style="info" %}
**Optional Playwright install.** `maps screenshot` launches a headless Chromium. The browser is an opt-in dependency to keep the CLI install small:

```bash
npm install playwright-core
npx playwright install chromium   # ~300 MB
```

The screenshot authenticates as the current CLI user, so it works on private, shared, and public maps you have access to.
{% endhint %}

## `carto maps delete`

```bash
carto maps delete <map-id>
carto maps delete <map-id> --yes   # Skip confirmation
```

## Examples

```bash
# Create from a bundle file
carto maps create < map.json

# Round-trip: get → edit → update
carto maps get abc123 --json > /tmp/map.json
jq '.title = "Q3 Dashboard"' /tmp/map.json | carto maps update abc123

# Validate locally (no network), then create
carto maps validate < map.json && carto maps create < map.json

# Update + publish in one go
carto maps update abc123 < shared.json --publish

# Agent introspection
carto maps agents status
carto maps schema layer.h3
```


# workflows

Manage CARTO Workflows — list, inspect, create, update, copy, validate, verify-remote, run, share, schedule, publish as MCP tools, and install extensions.

```bash
carto workflows list [options]                       # List workflows
carto workflows get <id>                             # Pretty details; --json = round-trippable bundle
carto workflows create [--file <bundle.json>]        # Create from a bundle
carto workflows update <id> [--file <bundle.json>]   # Update (partial bundles OK)
carto workflows delete <id>                          # Delete workflow
carto workflows copy <id> --dest-profile <name>      # Duplicate (cross-tenant or same-tenant)
carto workflows schema [section]                     # JSON Schema reference for agents
carto workflows validate [--file <bundle.json>]      # Tier-0 offline (Zod-only) bundle check
carto workflows verify-remote <id|--file …> --connection <c>  # Tier-0 + Tier-2 deep validation against a warehouse
carto workflows to-sql [--file <bundle.json>]        # Compile bundle → SQL preview (what `run` would submit)
carto workflows components list                      # Agent-facing component catalog
carto workflows components get <names>               # Full input/output signature for components
carto workflows run <id>                             # Execute workflow; returns per-node outputs
carto workflows run output <id> <node-id>            # Fetch a node's output rows
carto workflows run status <job-id>                  # Poll an async-submitted run
carto workflows share <id> [--org | --with <email>]  # Share workflow
carto workflows unshare <id>                         # Revert to private
carto workflows mcp publish|unpublish|describe|list  # MCP tool lifecycle
carto workflows schedule add|update|remove <id>      # Warehouse cron lifecycle
carto workflows extensions install --file <ext.zip> --connection <name>  # Install an extension zip
```

## The bundle model

`workflows get <id> --json` returns a **round-trippable bundle** (title and description lifted, server fields stripped, privacy synthesised). Pipe straight back into `workflows create --file` or `workflows update --file`:

```bash
carto workflows get abc123 --json > /tmp/wf.json
jq '.title = "New title"' /tmp/wf.json | carto workflows update abc123 --file -
```

Structural validation runs on Zod schemas under `src/schemas/workflows/`. For the full bundle recipe, see the [`carto-create-workflow`](https://github.com/CartoDB/agent-skills/tree/master/skills/carto-create-workflow) skill.

{% hint style="info" %}
**GeoJSON inputs**: `native.tablefromgeojson` and `native.drawcustomgeographies` accept both a stringified `FeatureCollection` and a `FeatureCollection` object on the input `value` field, so workflows that ingest GeoJSON can be authored from the CLI.
{% endhint %}

## `carto workflows list`

| Option                           | Description                                                                            |
| -------------------------------- | -------------------------------------------------------------------------------------- |
| `--page <n>` / `--page-size <n>` | Pagination.                                                                            |
| `--order-by <field>`             | `updated_at` (default), `created_at`, `title`. Aliases `updated` / `created` accepted. |
| `--order-direction <dir>`        | `ASC` or `DESC`.                                                                       |
| `--search <term>`                | Search filter.                                                                         |
| `--privacy <level>`              | Filter by privacy: `public` or `shared`.                                               |
| `--tags <json>`                  | Filter by tags (JSON array).                                                           |
| `--all`                          | Fetch all pages automatically.                                                         |

## `carto workflows create` / `carto workflows update`

| Option                         | Description                                                                   |
| ------------------------------ | ----------------------------------------------------------------------------- |
| `--file <path>`                | Read bundle JSON from a file (or stdin via `-`).                              |
| `--verify`                     | Run Tier-2 checks (sources region + SQL dry-run + engine compile) post-write. |
| `--verify sources,sql,compile` | Subset — each can also be used alone.                                         |

```bash
# Create from a bundle
carto workflows create --file my-pipeline.json

# Update + verify post-write
carto workflows update abc123 --file pipeline.json --verify
```

## `carto workflows validate` / `carto workflows verify-remote`

* **`validate`** — **Zod-only**, offline, no network. Use it to iterate on a bundle locally before writing. The `--connection` and `--no-engine` flags are removed; for warehouse-aware validation use `verify-remote`.
* **`verify-remote`** — Standalone command, hard-errors without a connection. Runs the full Tier-0/1/2 stack (structural + engine compile + schema trace + sources + customsql) without writing the workflow. Useful before opening a PR that ships a new bundle. Advisory warnings appear in the output but no longer fail the exit code; pass `--strict` to restore the previous behaviour, where any warning fails the run.

```bash
# Offline structural check
carto workflows validate --file bundle.json

# Full warehouse-side check
carto workflows verify-remote --file bundle.json --connection carto_dw

# Same, but fail on advisory warnings (CI gates)
carto workflows verify-remote --file bundle.json --connection carto_dw --strict
```

| Option                      | Description                                                                            |
| --------------------------- | -------------------------------------------------------------------------------------- |
| `--file <path>`             | Bundle JSON path (or pipe via stdin).                                                  |
| `--connection <name\|uuid>` | (Required for `verify-remote`) Override `bundle.connectionId`.                         |
| `--mode <create\|update>`   | (`validate` only) Validation mode (default: `update`).                                 |
| `--strict`                  | (`verify-remote` only) Fail the exit code on any advisory warning, not just on errors. |

## `carto workflows to-sql`

Compile a bundle to the SQL that `run` would submit, without executing:

```bash
carto workflows to-sql --file bundle.json
```

## `carto workflows components`

Agent-facing component catalog. Use `list` to discover components, `get` to fetch their full input/output signatures.

```bash
# Browse native components
carto workflows components list --connection carto_dw --group Joins

# Full signatures (for agent composition)
carto workflows components get native.customsql,native.joinv2 --connection carto_dw --json

# Include input-format reference entries
carto workflows components get native.customsql --connection carto_dw --input-formats
```

| Option                      | Description                                                                                                                                |
| --------------------------- | ------------------------------------------------------------------------------------------------------------------------------------------ |
| `--connection <name\|uuid>` | (Required) Catalog is fetched per-connection so extensions and stored procedures appear alongside native components. Provider is inferred. |
| `--group <name>`            | Filter `list` to a specific group (e.g. `Joins`).                                                                                          |
| `--search <term>`           | Substring match across name / title / description.                                                                                         |
| `--starred`                 | Only starred components.                                                                                                                   |
| `--include-deprecated`      | Include deprecated components (hidden by default).                                                                                         |
| `--input-formats`           | (`get` only) Include deduped format reference entries for all input/output types.                                                          |

{% hint style="warning" %}
**Breaking in 0.7:** `components list` and `components get` now require `--connection`. The previous `--provider` flag was removed; the provider is now inferred from the connection so extensions and stored procedures appear in the catalog. Extension and stored-procedure load failures surface as warnings (in JSON output under a `warnings` array; in text as `Warning: …` lines).
{% endhint %}

For `Selection`-typed inputs (e.g. `native.isolines.mode`) the JSON output includes both `options` (the wire values the engine accepts, e.g. `"walk"`) and `optionsText` (the matching human-readable labels, e.g. `"Walk"`). Use `options` when populating the bundle.

## `carto workflows run`

Execute a workflow and fetch results:

```bash
carto workflows run <id>                          # Run synchronously; returns per-node outputs
carto workflows run <id> --async                  # Return immediately with a job ID
carto workflows run status <job-id>               # Poll the async job
carto workflows run output <id> <node-id>         # Fetch a specific node's output rows
```

## `carto workflows share` / `carto workflows unshare`

```bash
# Share with the whole organization
carto workflows share <id> --org

# Share with a specific user (email → user-id lookup is automatic)
carto workflows share <id> --with someone@example.com

# Revert to private
carto workflows unshare <id>
```

## `carto workflows mcp`

Publish a workflow as an MCP tool so it shows up in the CARTO MCP Server:

```bash
carto workflows mcp publish <id> [options]      # Expose this workflow as an MCP tool
carto workflows mcp unpublish <id>              # Remove from MCP catalog
carto workflows mcp describe <id>               # Show current MCP tool registration
carto workflows mcp list                        # List all workflows published as MCP tools
```

See the [Workflows as MCP Tools](/carto-user-manual/workflows/workflows-as-mcp-tools) guide for the publishing flow end-to-end.

## `carto workflows schedule`

Warehouse-side cron lifecycle for the workflow's run schedule:

```bash
carto workflows schedule add <id> --cron "0 6 * * *"
carto workflows schedule update <id> --cron "0 6 * * 1-5"
carto workflows schedule remove <id>
```

## `carto workflows copy`

Duplicate a workflow between profiles. Connection mapping behaves like `maps copy`.

```bash
# Auto-map by name
carto workflows copy abc123 --dest-profile production

# Explicit connection
carto workflows copy abc123 \
  --source-profile staging \
  --dest-profile production \
  --connection prod-bigquery
```

| Option                       | Description                                                 |
| ---------------------------- | ----------------------------------------------------------- |
| `--dest-profile <name>`      | (Required) Destination profile name.                        |
| `--source-profile <name>`    | Source profile (default: current).                          |
| `--connection <name>`        | Destination connection name (auto-maps by name if omitted). |
| `--connection-mapping <map>` | Per-source map: `"src1=dst1,src2=dst2"`.                    |
| `--title <title>`            | Override workflow title in the destination.                 |
| `--skip-source-validation`   | Skip validating source table accessibility.                 |

For the full walkthrough including connection-mapping scenarios, see [Examples → Copying maps and workflows between organizations](/carto-for-agents/cli/examples#copying-maps-and-workflows-between-organizations).

## `carto workflows extensions install`

Install a CARTO Workflows extension zip (bundles `metadata.json` + provider-specific SQL) into a warehouse connection.

```bash
carto workflows extensions install --file my-extension.zip --connection carto_dw
```

| Option                | Description                                                               |
| --------------------- | ------------------------------------------------------------------------- |
| `--file <path>`       | (Required) Path to the extension `.zip`.                                  |
| `--connection <name>` | (Required) Connection to install into. Provider must match the extension. |

## Examples

```bash
# List ETL workflows, recently updated first
carto workflows list --search "ETL" --order-by updated_at

# Round-trip get → edit → update
carto workflows get abc123 --json > /tmp/w.json
jq '.title = "New title"' /tmp/w.json | carto workflows update abc123 --file -

# Local validation before write
carto workflows validate --file bundle.json

# Full warehouse-side verification before merging a bundle PR
carto workflows verify-remote --file bundle.json --connection carto_dw

# Preview the SQL `run` would submit
carto workflows to-sql --file bundle.json

# Publish as MCP tool so agents can call it
carto workflows mcp publish abc123
```


# projects

Manage CARTO projects — the containers that group maps and workflows. A project is a top-level folder; it can hold subfolders, native maps and workflows, and shortcuts to maps or workflows that live elsewhere.

```bash
# Read
carto projects list [options]                      # Top-level projects
carto projects get <id|name>                       # Project details + full contents tree

# Top-level CRUD
carto projects create --name <name>                # New top-level project
carto projects rename <path> --to <name>           # Rename a folder
carto projects delete <path>                       # Delete a folder or shortcut

# Asset placement
carto projects add <path> --folder <name>          # Create a subfolder inside a project
carto projects add <path> --map <map-id>           # Add an existing map (creates a shortcut)
carto projects add <path> --workflow <wf-id>       # Add an existing workflow (creates a shortcut)
carto projects move <path> --to <path>             # Move a folder or shortcut to a new parent

# Local-sync workflow
carto projects init <name>                         # New project + scaffold a local working dir
carto projects clone <id|name>                     # Materialize an existing project to disk
carto projects status                              # Show local-vs-clone diff (run inside a checkout)
```

## Identifier resolution

Project arguments accept **either** the UUID (e.g. `62c90ed4-eeec-46d0-bda9-c7ea173e26f0`) or the project name. Names are resolved via the entries search; ambiguous matches error out and ask for the UUID.

Nested locations use **slash paths**: `Q2 Analytics/Maps/Drafts`. The first segment must be a top-level project (or its UUID); subsequent segments walk the tree by title-match within each parent folder.

## Adding maps and workflows: shortcuts under the hood

The CARTO platform doesn't currently expose a way to move an existing map or workflow into a folder — assets live at the account root. The mechanism for making one appear inside a project is to create a **shortcut** (an alias entry pointing at the underlying asset). `carto projects add <path> --map <id>` creates that shortcut for you. The map itself is not moved; deleting the shortcut later only removes the alias, not the map.

## Local-sync workflow

Treat a CARTO project as a working directory you can clone, edit, and sync:

```bash
# Start a brand-new project — creates server-side and scaffolds a local dir
carto projects init "Q2 Analytics" --color "#3478f6"
cd q2-analytics
$EDITOR AGENTS.md                # capture project context for an agent

# Or check out an existing project
carto projects clone "Q2 Analytics"
cd q2-analytics
ls -R                            # AGENTS.md, README.md, *.map.json, *.workflow.json

# See what's changed locally vs the clone
carto projects status

# Optionally check whether anything moved on the server since you cloned
carto projects status --server
```

The clone lays down:

* `.carto/project.json` — manifest with project ID, content hashes, server timestamps, and the recursive entry tree.
* `AGENTS.md`, `README.md` — tracked scaffold docs (their hashes go in the manifest, so edits show up in `status`).
* `.gitignore` — meta, untracked.
* For each entry: a directory (folders) or a `*.map.json` / `*.workflow.json` bundle.

Pushing edits back uses the existing per-resource verbs:

```bash
$EDITOR my-map.map.json
carto maps update <map-id> < my-map.map.json
```

## Common flags

**`projects list`** — `--in <id|name>`, `--search <query>`, `--owner <me|others>`, `--mine`, `--order-by <field>` (`updatedAt` / `title`), `--order-direction <ASC|DESC>`, `--page`, `--page-size`.

**`projects get`** — `--depth <n>` (0 = unbounded, 1 = top level only), `--budget <n>` (folder-lookup cap, default 500), `--no-entries` (metadata only).

**`projects create`** — `--name <name>`, `--color <hex>`, `--file <path>` (read full create payload from JSON).

**`projects add`** — exactly one of `--folder <name>`, `--map <map-id>`, `--workflow <id>`, plus `--color <hex>` for new subfolders.

**`projects rename`** — `--to <new-name>`.

**`projects move`** — `--to <path>`. Top-level → top-level is not supported by the API today.

**`projects delete`** — `--yes` to skip the confirmation prompt.

**`projects init`** / **`projects clone`** — `--path <dir>` (default: `./<slug-of-name>/`), `--force` (write into a non-empty dir / overwrite scaffold). `clone` adds `--shallow` (skip bundle fetches, just structure) and `--budget <n>`.

**`projects status`** — `--path <dir>` (project root, defaults to walking up from CWD), `--server` (also check for changes on the CARTO server since clone).

## Examples

```bash
# Browse
carto projects list --mine
carto projects list --search analytics
carto projects get "Q2 Analytics"
carto projects get "Q2 Analytics/Maps"

# Build out a project
carto projects create --name "Q2 Analytics" --color "#3478f6"
carto projects add "Q2 Analytics" --folder "Maps"
carto projects add "Q2 Analytics/Maps" --map 62c90ed4-eeec-46d0-bda9-c7ea173e26f0
carto projects add "Q2 Analytics" --workflow b32f9fff-4303-4f75-bf7a-1f661c60b53a

# Reorganize
carto projects rename "Q2 Analytics/Maps" --to "Production maps"
carto projects move  "Q2 Analytics/Production maps" --to "Q1 Archive"

# Clean up
carto projects delete "Q2 Analytics" --yes
```


# connections

Manage data warehouse connections (BigQuery, Snowflake, Redshift, PostgreSQL, Databricks, …).

## `carto connections list`

List all connections.

```bash
carto connections list
```

## `carto connections get <connection-id>`

Get details for a specific connection.

```bash
carto connections get conn_xyz789
```

## `carto connections create <json-body>`

Create a new connection. The body's shape depends on the provider.

```bash
carto connections create '{
  "name": "my-snowflake",
  "type": "snowflake",
  "parameters": {
    "account": "myaccount",
    "warehouse": "compute_wh"
  }
}'
```

## `carto connections update <connection-id> <json-body>`

Update a connection.

```bash
carto connections update conn_xyz789 '{ "parameters": { "warehouse": "new_wh" } }'
```

## `carto connections delete <connection-id>`

Delete a connection.

```bash
carto connections delete conn_xyz789
```

## `carto connections browse <name> [path]`

Browse the resource tree exposed by a connection (databases, schemas, tables, tilesets). Useful for picking source paths when authoring maps or workflows without leaving the terminal.

```bash
# Top-level tree for a connection
carto connections browse carto_dw

# Drill into a specific subtree
carto connections browse carto_dw "carto-demo-data"
```

**Options:**

| Option               | Description                                                |
| -------------------- | ---------------------------------------------------------- |
| `--depth <n>`        | Max tree depth to expand (default: server default).        |
| `--max-items <n>`    | Max total items to return (default: server default of 30). |
| `--max-children <n>` | Max children per node (default: server default).           |

## `carto connections describe <name> <table-path>`

Get the schema and details for a single table on a connection (column names, types, partitioning, row count when available).

```bash
carto connections describe carto_dw "carto-demo-data.demo_tables.nyc_collisions"
```

## `carto connections search <name> <query>`

Free-text search across the tables and views reachable through a connection.

```bash
carto connections search my-conn "customers"
carto connections search my-conn "orders" --scope "mydb.public" --type table
```

**Options:**

| Option          | Description                                            |
| --------------- | ------------------------------------------------------ |
| `--type <kind>` | Filter by resource type: `table` or `view`.            |
| `--limit <n>`   | Max results, 1–100 (default: 20).                      |
| `--scope <fqn>` | Narrow the search to a subtree (e.g. `"mydb.public"`). |


# named-sources

Manage **Named Sources** — server-side aliases for SQL queries. Instead of exposing raw SQL in client applications, create a Named Source with a name and reference it by name wherever the CARTO APIs accept a `sqlQuery` parameter.

{% hint style="info" %}
The Named Sources API requires **OAuth Access Tokens** (from `carto auth login`), not API Access Tokens.
{% endhint %}

```bash
carto named-sources list                              # List named sources
carto named-sources get <name>                        # Get named source details
carto named-sources create --name <n> --source <sql>  # Create named source
carto named-sources update <name> --source <sql>      # Update named source
carto named-sources delete <name>                     # Delete named source
```

## `carto named-sources list`

| Option             | Description                   |
| ------------------ | ----------------------------- |
| `--page-size <n>`  | Items per page (default: 10). |
| `--page <n>`       | Page number (default: 1).     |
| `--search <query>` | Search named sources by text. |

## `carto named-sources create`

| Option           | Description                                                                      |
| ---------------- | -------------------------------------------------------------------------------- |
| `--name <name>`  | Source name (3–50 chars, lowercase letters/numbers, dashes/underscores allowed). |
| `--source <sql>` | SQL query for the named source.                                                  |

## Examples

```bash
# List all named sources
carto named-sources list

# Search named sources
carto named-sources list --search "my_source"

# Create a named source
carto named-sources create --name my_source --source "SELECT * FROM project.dataset.table"

# Get details
carto named-sources get my_source

# Update the SQL query
carto named-sources update my_source --source "SELECT id, geom FROM project.dataset.table"

# Delete (with confirmation)
carto named-sources delete my_source

# Delete (skip confirmation for CI/CD)
carto named-sources delete my_source --yes
```


# do (Data Observatory)

Browse, search, and subscribe to datasets from the CARTO Data Observatory catalog (10,000+ spatial datasets from 50+ providers).

```bash
# Discover available filters (countries, categories, providers, licenses, etc.)
carto do filters                              # All filter values with dataset counts
carto do filters --json | jq '.categories'    # Just categories (programmatic)

# Browse and search
carto do list --category demographics         # Browse datasets by category
carto do list --country usa --limit 10        # Browse by country
carto do list --provider experian             # Browse by provider
carto do list --license public                # Filter by license type
carto do search "demographics united states"  # Full-text search
carto do search "flood risk" --license public # Search with filters

# AI-powered semantic variable search (requires embeddings)
carto do search-variables "purchasing power" --country deu
carto do search-variables "population density" --limit 10

# Dataset details
carto do details <dataset-id>                 # Full dataset metadata
carto do sample <dataset-id>                  # Data sample + data dictionary

# Subscriptions (public datasets only — premium requires contacting sales)
carto do subscriptions                        # List your subscriptions
carto do subscribe <dataset-id>               # Subscribe using catalog slug
carto do subscribe wp_population_29d72d59     # Resolves slug → creates BQ view
carto do subscribe <id> --filter "WHERE country_iso = 'US'"  # Partial subscription
carto do subscribe <id> --columns "geoid, population, geom"  # Specific columns only
carto do subscribe <id> --connection my-sf --destination db.tbl  # Subscribe + transfer
carto do unsubscribe <dataset-id>             # Remove a subscription
carto do unsubscribe <dataset-id> --yes       # Skip confirmation
```

## `carto do list` / `carto do search`

| Option               | Description                                                |
| -------------------- | ---------------------------------------------------------- |
| `--category <name>`  | Filter by category (e.g. `Demographics`, `Environmental`). |
| `--provider <name>`  | Filter by provider (e.g. `Experian`, `TomTom`).            |
| `--country <name>`   | Filter by country.                                         |
| `--license <type>`   | Filter: `premium` or `public`.                             |
| `--limit <n>`        | Results per page (default: 20).                            |
| `--page <n>`         | Page number (default: 1).                                  |
| `--order-by <field>` | Order: `popular`, `recent`, `alphabetical` (list only).    |

## `carto do subscribe`

| Option                  | Description                                                            |
| ----------------------- | ---------------------------------------------------------------------- |
| `--filter <where>`      | SQL `WHERE` clause to filter data (e.g. `"WHERE country_iso = 'US'"`). |
| `--columns <cols>`      | Comma-separated columns to include (default: all).                     |
| `--connection <name>`   | Transfer data to this connection after subscribing.                    |
| `--destination <table>` | Destination table (required with `--connection`).                      |


# import

Import a geospatial file into your data warehouse from a local file or URL. Waits for completion by default.

**Supported formats:** CSV, GeoJSON, GeoPackage, GeoParquet, KML, KMZ, Shapefile (zip).\
**Size limit:** 1 GB per file.\
**Supported warehouses:** CARTO DW, BigQuery, Snowflake, PostgreSQL, Redshift.

```bash
carto import --file <path> --connection <name> --destination <table>
carto import --url <url> --connection <name> --destination <table>
carto import status <jobId>                     # Fetch status of an async import job
```

## Options

| Option                | Description                                                              |
| --------------------- | ------------------------------------------------------------------------ |
| `--file <path>`       | Local file to upload (mutually exclusive with `--url`).                  |
| `--url <url>`         | Remote file URL to import (mutually exclusive with `--file`).            |
| `--connection <name>` | (Required) Connection name.                                              |
| `--destination <fqn>` | (Required) Fully qualified table name.                                   |
| `--overwrite`         | Overwrite an existing table (default: false).                            |
| `--no-autoguessing`   | Disable automatic column type detection (default: autoguessing enabled). |
| `--async`             | Return immediately with the job ID instead of polling to completion.     |

## Examples

```bash
# Import local CSV
carto import --file ./data.csv --connection carto_dw --destination project.dataset.my_table

# Import from URL with overwrite
carto import \
  --url https://example.com/data.geojson \
  --connection carto_dw \
  --destination project.dataset.table \
  --overwrite

# Kick off async, then poll status separately
carto import --file ./big.csv --connection carto_dw --destination my.table --async
carto import status <jobId>

# JSON output (for scripts)
carto import --file ./data.geojson --connection carto_dw --destination project.dataset.table --json
```

## CSV auto-detection

For CSV files, CARTO automatically detects geometry columns or builds geometries from lat/lon columns:

* **Geometry columns:** `geom`, `Geom`, `geometry`, `the_geom`, `wkt`, `wkb`.
* **Latitude columns:** `latitude`, `lat`, `Latitude`.
* **Longitude columns:** `longitude`, `lon`, `Lon`, `Longitude`, `lng`, `Lng`.

Disable with `--no-autoguessing` if you need full control over the schema.


# export

Export a warehouse table to a file. Returns a download URL (24 h expiry) or writes to cloud storage.

**Formats:** `geoparquet`, `geojson`, `shapefile`, `csv`, `geopackage`, `kml`, `kmz`, `tab`.

```bash
carto export --connection <name> --source <table> --format <fmt>
carto export status <jobId>                     # Fetch status of an async export job
```

## Options

| Option                | Description                                          |
| --------------------- | ---------------------------------------------------- |
| `--connection <name>` | (Required) Connection name.                          |
| `--source <fqn>`      | (Required) Source table name.                        |
| `--format <fmt>`      | (Required) Output format.                            |
| `--select <cols>`     | Comma-separated columns to project (default: all).   |
| `--where <predicate>` | Warehouse-native SQL predicate (no leading `WHERE`). |
| `--limit <n>`         | Max rows to export.                                  |
| `--dest-url <url>`    | Direct cloud destination (`gs://`, `s3://`).         |
| `--async`             | Return job ID immediately without waiting.           |

## Examples

```bash
# Export as GeoParquet (waits, prints download URL)
carto export --connection carto_dw --source project.dataset.my_table --format geoparquet

# Export selected columns with a WHERE predicate and a row limit
carto export \
  --connection carto_dw \
  --source project.dataset.my_table \
  --format csv \
  --select name,lon,lat \
  --where "year = 2025" \
  --limit 10000

# Export directly to cloud storage
carto export \
  --connection carto_dw \
  --source project.dataset.my_table \
  --format geojson \
  --dest-url gs://my-bucket/exports/data.geojson

# Kick off async, then poll status separately
carto export --connection carto_dw --source project.dataset.big --format csv --async
carto export status <jobId>
```


# transfer

Transfer data between warehouses. Waits for completion by default.

```bash
carto transfer --source-connection <n> --dest-connection <n> --source-table <t> --dest-table <t>
carto transfer status <jobId>                   # Fetch status of an async transfer job
```

{% hint style="info" %}
Transfer requires the DuckDB import engine to be enabled for your account.
{% endhint %}

## Options

| Option                       | Description                                |
| ---------------------------- | ------------------------------------------ |
| `--source-connection <name>` | (Required) Source connection name.         |
| `--dest-connection <name>`   | (Required) Destination connection name.    |
| `--source-table <fqn>`       | (Required) Source table.                   |
| `--dest-table <fqn>`         | (Required) Destination table.              |
| `--geography`                | Use geography type for spatial data.       |
| `--async`                    | Return job ID immediately without waiting. |

## Examples

```bash
# Transfer from BigQuery to Snowflake
carto transfer \
  --source-connection bigquery-prod \
  --dest-connection snowflake-analytics \
  --source-table project.dataset.customers \
  --dest-table db.schema.customers

# With geography support, async
carto transfer \
  --source-connection bq-prod \
  --dest-connection postgres-dev \
  --source-table project.dataset.geo_data \
  --dest-table public.geo_data \
  --geography --async

# Poll an async transfer
carto transfer status <jobId>
```


# sql

Run SQL on your data warehouse using existing connections. Two modes: `query` returns result rows; `job` runs DDL/DML and polls to completion without returning a result set.

## `carto sql query <connection> [sql]`

Run a SQL query and return results. Default behavior is `POST` (no caching, no URL length limit, 1-minute timeout).

```bash
# Query argument
carto sql query <connection> "SELECT * FROM dataset.table LIMIT 10"

# Read SQL from a file
carto sql query <connection> --file query.sql

# Pipe via stdin
echo "SELECT COUNT(*) FROM dataset.table" | carto sql query <connection>

# Cached read (GET, 1-year cache, 1-minute timeout)
carto sql query <connection> "SELECT * FROM dataset.table" --cache

# JSON output
carto sql query <connection> "SELECT * FROM dataset.table" --json
```

**Options:**

| Option          | Description                                              |
| --------------- | -------------------------------------------------------- |
| `--cache`       | Use `GET` with caching (1-year cache, 1-minute timeout). |
| `--file <path>` | Read SQL from a file.                                    |

**Default behavior:** `POST`, no caching, no URL length limit, 1-minute timeout.

## `carto sql job <connection> [sql]`

Run a DDL/DML job. Polls until complete; no timeout. Used when no result set is returned.

```bash
# CREATE TABLE
carto sql job <connection> "CREATE TABLE dataset.newtable AS SELECT * FROM dataset.oldtable"

# INSERT
carto sql job <connection> "INSERT INTO dataset.table VALUES (1, 'test')"

# Read from a file
carto sql job <connection> --file create_table.sql
```

**Use cases:**

* `CREATE TABLE` operations.
* `INSERT`, `UPDATE`, `DELETE` statements.
* Long-running data transformations.
* Operations that don't return result sets.

## Input methods (both `query` and `job`)

1. Command argument: `carto sql query myconn "SELECT * FROM table"`.
2. File: `carto sql query myconn --file query.sql`.
3. Stdin: `echo "SELECT * FROM table" | carto sql query myconn`.


# org

Organization-wide statistics and quotas.

## `carto org stats`

View organization statistics, resources, and quota consumption.

```bash
carto org stats
carto org stats --json
```

The displayed information depends on your permissions:

* Regular users see resource counts and basic stats.
* Admin users see full organization statistics including quotas.
* If access is denied for some sections, partial data is shown with notes.

**Surfaces shown (when available):**

* **Users** — total, editors, viewers, superadmins, API access tokens.
* **Resources** — maps (yours and total), workflows, connections, applications.
* **Usage & Quotas** — usage quota, LDS credits, geocoding/isolines, map loads.
* **AI Quotas** — Builder Gen AI threads, AI Agents tokens.

For an example of the full output, see [Examples → Organization statistics](/carto-for-agents/cli/examples#organization-statistics).


# users

Manage users and invitations in your CARTO organization.

User management commands require admin or superadmin permissions. Regular users may not have access to view all organization users; invitation commands require permission to invite users to the organization.

## `carto users list`

List users.

```bash
carto users list
carto users list --page 1 --page-size 20
carto users list --role Builder
carto users list --search "john"
carto users list --all
```

**Options:**

| Option            | Description                                   |
| ----------------- | --------------------------------------------- |
| `--page <n>`      | Page number.                                  |
| `--page-size <n>` | Items per page.                               |
| `--role <role>`   | Filter by role: `Builder`, `Viewer`, `Guest`. |
| `--search <term>` | Search users by name or email.                |
| `--all`           | Fetch all pages automatically.                |

## `carto users get <user>`

Get detailed information for a user. Accepts a user ID or an email address.

```bash
carto users get google-oauth2|123456789
carto users get jatorre@carto.com
carto users get <user-id> --json
```

Output includes the user profile, roles, organization, identities, and groups.

## `carto users invite <email[,email...]> [email...]`

Invite one or more users to the organization. Both comma-separated and multi-argument forms are accepted.

```bash
# Single user
carto users invite user@example.com --role Builder

# Default role is Viewer
carto users invite user@example.com

# Comma-separated
carto users invite user1@example.com,user2@example.com,user3@example.com --role Builder

# Multiple arguments
carto users invite user1@example.com user2@example.com --role Viewer
```

**Options:**

| Option                            | Description                        |
| --------------------------------- | ---------------------------------- |
| `--role <Builder\|Viewer\|Guest>` | Role to assign. Default: `Viewer`. |

**Available roles:**

* **Builder** — full access to create and edit maps, workflows, and connections.
* **Viewer** — read-only access to view maps and data.
* **Guest** — limited access, typically for external collaborators.

## `carto users invitations`

List pending invitations.

```bash
carto users invitations
carto users invitations --json
```

## `carto users resendInvitation <invitation-id>`

Resend a pending invitation.

## `carto users cancelInvitation <invitation-id>`

Cancel a pending invitation.

## `carto users delete <user>`

Remove a user from the organization. Requires admin permissions.


# activity

Query and export detailed activity logs and usage data from your CARTO organization. Useful for analyzing user activity, tracking adoption metrics, and building custom dashboards without needing a data warehouse.

**Requirements:** Enterprise Large plan or above.

## `carto activity query`

Run SQL against your activity data using DuckDB. The CLI automatically downloads the data (if needed), caches it in `/tmp`, and runs your query.

**Smart caching:** the first query for a given date range downloads data (\~10s); subsequent queries with the same range are near-instant (\~0.02s).

```bash
# Simple count
carto activity query --start-date 2025-10-01 --end-date 2025-10-07 \
  --sql "SELECT COUNT(*) as total_events FROM activity"

# Maps created per user with email
carto activity query --start-date 2025-10-01 --end-date 2025-10-07 --sql "
  SELECT
    CAST(a.ts AS DATE) as date,
    u.email,
    COUNT(*) AS created_maps
  FROM activity a
  JOIN userList u ON json_extract_string(a.data, '$.userId') = u.user_id
  WHERE a.type = 'MapCreated'
  GROUP BY date, u.email
  ORDER BY created_maps DESC
  LIMIT 10
"

# Force fresh download
carto activity query --start-date 2025-10-01 --end-date 2025-10-07 --no-cache \
  --sql "SELECT type, COUNT(*) FROM activity GROUP BY type ORDER BY COUNT(*) DESC"

# JSON output
carto activity query --start-date 2025-10-01 --end-date 2025-10-07 --json \
  --sql "SELECT COUNT(*) FROM activity"
```

**Options:**

| Option                | Description                                        |
| --------------------- | -------------------------------------------------- |
| `--start-date <date>` | Start date (`YYYY-MM-DD`).                         |
| `--end-date <date>`   | End date (`YYYY-MM-DD`).                           |
| `--sql <sql>`         | DuckDB SQL to execute against the activity tables. |
| `--no-cache`          | Force fresh download (ignore the `/tmp` cache).    |
| `--json`              | Machine-readable JSON output.                      |

### Available tables

| Table       | Columns                                                                                                                           |
| ----------- | --------------------------------------------------------------------------------------------------------------------------------- |
| `activity`  | `type` (VARCHAR — event type, e.g., `MapCreated`, `WorkflowRun`), `ts` (TIMESTAMP UTC), `data` (VARCHAR — JSON payload).          |
| `apiUsage`  | `ts` (TIMESTAMP — daily), `user_id` (VARCHAR), `metric` (VARCHAR — API method), `amount` (NUMBER), `quota_usage_weight` (NUMBER). |
| `userList`  | `user_id`, `email`, `role`, `created_at`, `group_ids`.                                                                            |
| `groupList` | `group_id`, `group_alias` — only present if groups are enabled.                                                                   |

### DuckDB SQL tips

* JSON extraction: `json_extract_string(data, '$.userId')`.
* Date casting: `CAST(ts AS DATE)`.
* Date arithmetic: `current_date - INTERVAL 7 DAY`.

For the full schema, see [Activity Data Reference](/carto-user-manual/settings/activity-data/activity-data-reference).

## `carto activity export`

Export raw activity data to files. Useful for loading into your own data warehouse for advanced analytics, or for archiving.

```bash
# Export all categories
carto activity export --start-date 2025-10-01 --end-date 2025-10-07

# Export as Parquet (smaller files, faster queries)
carto activity export --start-date 2025-10-01 --end-date 2025-10-07 --format parquet

# Export only the activity category
carto activity export --start-date 2025-10-01 --end-date 2025-10-07 --category activity

# Custom output directory
carto activity export --start-date 2025-10-01 --end-date 2025-10-07 --output-dir ~/exports
```

**Options:**

| Option                | Description                                              |
| --------------------- | -------------------------------------------------------- |
| `--start-date <date>` | Start date (`YYYY-MM-DD`).                               |
| `--end-date <date>`   | End date (`YYYY-MM-DD`).                                 |
| `--category <name>`   | Limit to a specific category (e.g., `activity`).         |
| `--format <format>`   | Output format. `parquet` recommended for large exports.  |
| `--output-dir <path>` | Output directory. Defaults to current working directory. |

**Use cases:**

* **Quick SQL analysis** — `activity query` with no warehouse needed.
* **Track adoption** — user activity, map creation, workflow execution.
* **Monitor quotas** — API usage and quota consumption by user/team.
* **Export to warehouse** — load Parquet into BigQuery/Snowflake for advanced analytics.
* **Audit trails** — complete event history for compliance.


# admin

Superadmin operations: list resources across all users, batch delete, and transfer resources between users. Requires superadmin permissions.

## `carto admin list <resource-type>`

List all resources across the organization (not just yours).

```bash
carto admin list maps
carto admin list workflows
carto admin list connections

# With pagination and search
carto admin list maps --page-size 50
carto admin list connections --search snowflake

# Fetch every page
carto admin list maps --all
carto admin list workflows --all
```

**Resource types:** `maps`, `workflows`, `connections`.

**Options:**

| Option            | Description                    |
| ----------------- | ------------------------------ |
| `--page <n>`      | Page number.                   |
| `--page-size <n>` | Items per page.                |
| `--search <term>` | Search by name or description. |
| `--all`           | Fetch all pages automatically. |

## `carto admin batch-delete <json-body>`

Delete multiple resources in a single call.

```bash
carto admin batch-delete '{"resource_ids":["map1","map2","workflow1"]}'
```

## `carto admin transfer <json-body>`

Transfer resources from one user to another.

```bash
carto admin transfer '{
  "from_user": "user1@example.com",
  "to_user": "user2@example.com",
  "resource_ids": ["map1", "workflow1"]
}'
```

## `carto admin settings get | apply | diff`

Round-trip org-wide administrative settings (basemaps toggles, palettes, maps, connections, workflows, builder-gen-ai, carto-ai) as a single JSON bundle. The same shape that `apply` accepts is what `get` emits, so the three subcommands compose for moving settings between environments or capturing a snapshot for audit.

```bash
# Dump the current org settings to stdout
carto admin settings get

# Or write them to a file
carto admin settings get --out settings.json

# Preview what would change without writing
carto admin settings diff settings.json
cat settings.json | carto admin settings diff -

# Apply a bundle (per-section PATCH — only the sections present in the file are touched)
carto admin settings apply settings.json
carto admin settings apply --file settings.json
cat settings.json | carto admin settings apply -
```

**Subcommands:**

| Subcommand       | Description                                                                                                                  |
| ---------------- | ---------------------------------------------------------------------------------------------------------------------------- |
| `settings get`   | Read the current org settings as a JSON bundle.                                                                              |
| `settings apply` | Apply a bundle. Sections present in the bundle are PATCHed individually; sections absent from the bundle are left untouched. |
| `settings diff`  | Preview what `apply` would change. Pure read-only — no writes.                                                               |

**Options:**

| Option          | Description                                                                             |
| --------------- | --------------------------------------------------------------------------------------- |
| `--out <file>`  | (`get` only) Write the bundle to a file instead of stdout.                              |
| `--file <path>` | (`apply` only) Read the bundle from a file instead of the positional argument or stdin. |


# ai

AI-related commands: chat with the AI agents configured on your maps (`aifeature`), and access CARTO's LLM proxy with an OpenAI-compatible API (`aiproxy`).

## `carto aifeature aiagent <map-id>`

Chat with the AI agent configured on a specific map. The CLI automatically fetches the agent's configuration and token — you just need your regular CARTO authentication.

```bash
# Interactive multi-turn conversation
carto aifeature aiagent <map-id>

# Example session:
# You: What are the traffic patterns in this area?
# Assistant: Based on the data, I can see...
# You: Show me the collision hotspots
# Assistant: Here are the areas with highest collisions...
# You: exit

# One-shot mode
carto aifeature aiagent <map-id> "What are the traffic patterns?"

# Continue a previous conversation
carto aifeature aiagent <map-id> "Tell me more" --conversation-id abc123

# Read message from a file
carto aifeature aiagent <map-id> --file test-query.txt

# Pipe via stdin
echo "Analyze the collision data" | carto aifeature aiagent <map-id>

# JSON output
carto aifeature aiagent <map-id> "Summarize the data" --json
```

**Options:**

| Option                   | Description                                                 |
| ------------------------ | ----------------------------------------------------------- |
| `--conversation-id <id>` | Continue a previous conversation by ID.                     |
| `--file <path>`          | Read the message from a file.                               |
| `--json`                 | Machine-readable JSON output (for automation and CI tests). |

**How it works:**

* Connects to your map's configured AI agent.
* The agent has access to map data, workflows, and configured tools.
* Streams responses in real time.
* Executes backend tools (workflows, SQL) automatically.
* Tracks conversation history for multi-turn interactions.

**Use cases:**

* **Test agent instructions** — validate behavior during development.
* **Debug agent tools** — see which workflows/tools the agent invokes.
* **Automated testing** — agent quality scripts.
* **Agent development** — rapidly iterate on configuration.
* **CI/CD integration** — gate deployments on agent validation.

## `carto aiproxy`

Access CARTO's LLM infrastructure directly with an OpenAI-compatible API. Use any available model for custom tasks without going through the AI Features layer.

The CLI automatically connects to CARTO's LiteLLM service at `https://litellm-{tenant}.api.carto.com` using your CARTO authentication.

### `carto aiproxy info`

Get connection information for external tools.

```bash
carto aiproxy info
```

Example output:

```
CARTO LiteLLM Proxy Configuration

API Mode:     OpenAI Compatible
API Host:     https://litellm-gcp-us-east1.api.carto.com
API Base URL: https://litellm-gcp-us-east1.api.carto.com/v1
API Key:      eyJhbGciOiJSUzI1NiIs...

Endpoints:
  Chat completions: /v1/chat/completions
  Completions:      /v1/completions
  Embeddings:       /v1/embeddings
  Models:           /v1/models
```

### `carto aiproxy models`

List available models.

```bash
carto aiproxy models
```

### `carto aiproxy chat <message>`

Send a chat message to a model.

```bash
# Simple chat
carto aiproxy chat "What is 2+2?" --model gpt-4

# With a system prompt
carto aiproxy chat "Analyze this data pattern" \
  --model gemini-2.5-flash \
  --system "You are a geospatial data analyst"

# Control generation parameters
carto aiproxy chat "Write a haiku about maps" \
  --model gpt-4 \
  --temperature 1.5 \
  --max-tokens 100

# Read message from a file
carto aiproxy chat --file prompt.txt --model gpt-4

# Pipe via stdin
echo "Explain quantum physics simply" | carto aiproxy chat --model gpt-4

# JSON output
carto aiproxy chat "Hello" --model gpt-4 --json
```

**Options:**

| Option              | Description                                                                   |
| ------------------- | ----------------------------------------------------------------------------- |
| `--model <name>`    | (Required) Model to use. Run `carto aiproxy models` to list available models. |
| `--system <text>`   | System prompt to set agent behavior.                                          |
| `--temperature <n>` | Sampling temperature, 0–2 (default: 1). Higher = more creative.               |
| `--max-tokens <n>`  | Maximum tokens in the response.                                               |
| `--top-p <n>`       | Top-p sampling, 0–1 (default: 1).                                             |
| `--file <path>`     | Read the message from a file.                                                 |
| `--json`            | Output the raw JSON response.                                                 |

**Use cases:**

* **Quick LLM access** — use CARTO's LLM infrastructure for any task.
* **Prototyping** — test prompts before building AI Features.
* **Data analysis** — get AI insights on your geospatial data.
* **Custom scripts** — integrate LLM capabilities into automation.
* **Model comparison** — test the same prompt against different models.


# Examples

End-to-end walkthroughs combining several commands. For per-command details see the [command reference](/carto-for-agents/cli/command-reference).

## Authentication workflow

```bash
# Interactive browser-based login using OAuth 2.0 + PKCE
carto auth login
# This will:
# 1. Display an authorization URL
# 2. Open your browser (you may need to copy/paste the URL)
# 3. Wait for you to complete the login process
# 4. Capture your access token and user information
# 5. Store credentials in ~/.carto_credentials.json
# 6. Configure the API URL based on your tenant

# Check authentication status
carto auth status

# Show current user information
carto auth whoami
# Returns: user_id, name, email, account info, roles

# Switch between profiles
carto auth use production
carto auth use staging
```

## Managing application credentials

```bash
# List all credentials
carto credentials list
carto credentials list tokens

# Create an API Access Token for your application
carto credentials create token \
  --connection carto_dw \
  --source "demo_tables.*" \
  --apis sql,maps

# Create SPA OAuth Client for web applications
carto credentials create spa \
  --title "My Dashboard" \
  --callback "https://mydash.com/callback"

# Create M2M OAuth Client for backend services
carto credentials create m2m \
  --title "ETL Service"

# Get token details
carto credentials get token <token-id>

# Delete a credential
carto credentials delete token <token-id>
```

## Browsing and managing resources

```bash
# List maps with filters (enhanced display shows owner, privacy, views, tags)
carto maps list --search sales --page-size 20

# List only your maps
carto maps list --mine

# Pagination
carto maps list --page 1 --page-size 10
carto maps list --page 2 --page-size 10

# Fetch all pages automatically with --all
carto maps list --all
carto maps list --mine --all
carto workflows list --all --search "project"

# Get detailed info for a specific map
carto maps get 69b0e7cc-026a-4feb-87bb-a82cc6ac5189
# Output shows:
# - Map metadata (title, owner, privacy, views, collaborative, agent enabled)
# - Datasets and their connections
# - Map URL

# JSON output for scripting (or AI agents)
carto maps list --json | jq '.data[].id'

# Delete a map
carto maps delete map_abc123
```

## Creating a Builder map from JSON

`carto maps create` accepts a round-trippable bundle from a positional JSON string, a filesystem path, or stdin. Pre-flight validation runs before any write, so broken bundles reject without creating an orphan map.

```bash
# Minimal bundle — title, connection, and one dataset rendered as a tileset layer
cat > stores.map.json <<'JSON'
{
  "title": "Retail stores",
  "connectionId": "12345678-1234-1234-1234-123456789abc",
  "privacy": "private",
  "datasets": [
    {
      "id": "stores-ds",
      "type": "table",
      "source": "carto-demo-data.demo_tables.retail_stores",
      "connectionId": "12345678-1234-1234-1234-123456789abc"
    }
  ],
  "keplerMapConfig": {
    "config": {
      "visState": {
        "layers": [
          {
            "id": "stores-layer",
            "type": "tileset",
            "config": {
              "dataId": "stores-ds",
              "label": "Stores",
              "color": [255, 100, 50],
              "visConfig": { "radius": 10 }
            }
          }
        ]
      },
      "mapStyle": { "styleType": "positron" }
    }
  }
}
JSON

# Validate locally (no network), then create
carto maps validate < stores.map.json
carto maps create < stores.map.json

# Or chain in one go
carto maps create ./stores.map.json --json | jq '.builderUrl'
```

For the full schema and authoring patterns, see [`carto maps schema`](/carto-for-agents/cli/command-reference/maps#carto-maps-schema-section) and the [`carto-create-builder-maps`](https://github.com/CartoDB/agent-skills/tree/master/skills/carto-create-builder-maps) skill.

### Round-trip: edit an existing map

```bash
# Get the map as a round-trippable bundle, edit, and update
carto maps get abc123 --json > /tmp/map.json
jq '.title = "Q3 Dashboard"' /tmp/map.json | carto maps update abc123

# Update + publish in one call so shared/public viewers see the changes
carto maps update abc123 < /tmp/map.json --publish
```

### Screenshot a map

{% hint style="info" %}
`carto maps screenshot` is **experimental**. Its flags, render engines, and output may change in future releases.
{% endhint %}

```bash
# Default light engine — layers + basemap, no widgets
carto maps screenshot abc123 -o map.png

# Recenter and hide chrome
carto maps screenshot abc123 --lat 40.42 --lng -3.70 --zoom 12 --hide-overlays

# Full CARTO Builder viewer (widgets, legends, popups) — heavier
carto maps screenshot abc123 --render-engine full
```

## Creating a Workflow from a bundle

`carto workflows create --file <bundle.json>` takes a Workflows bundle and provisions the nodes, edges, and metadata in a single call.

```bash
# Minimal — pipeline that reads a table, filters it, and writes back
cat > cycle-pipeline.workflow.json <<'JSON'
{
  "title": "Cycle network — existing routes only",
  "connectionId": "12345678-1234-1234-1234-123456789abc",
  "config": {
    "schemaVersion": "1.0.0",
    "connectionProvider": "bigquery",
    "useCache": false,
    "nodes": [
      {
        "id": "src",
        "type": "source",
        "data": {
          "name": "ReadTable",
          "inputs": [
            { "name": "source", "value": "demo_tables.bristol_cycle_network" }
          ]
        },
        "position": { "x": 100, "y": 100 }
      },
      {
        "id": "filter",
        "type": "generic",
        "data": {
          "name": "native.where",
          "inputs": [
            { "name": "expression", "value": "r_status = 'Existing'" }
          ]
        },
        "position": { "x": 300, "y": 100 }
      }
    ],
    "edges": [
      {
        "id": "e1",
        "source": "src",
        "target": "filter",
        "sourceHandle": "out",
        "targetHandle": "source"
      }
    ]
  },
  "tags": ["analytics", "cycle-data"]
}
JSON

# Validate offline (Zod-only, no warehouse calls), then create
carto workflows validate --file cycle-pipeline.workflow.json
carto workflows create --file cycle-pipeline.workflow.json

# Full warehouse-side check before merging the bundle to a repo
carto workflows verify --file cycle-pipeline.workflow.json --connection carto_dw
```

### Browse the component catalog

Workflows are composed from components — `native.where`, `native.customsql`, `native.joinv2`, and many more. Browse the catalog for a connection (so extensions and stored procedures show up too):

```bash
# All Joins components for a BigQuery connection
carto workflows components list --connection carto_dw --group Joins

# Full input/output signatures for the components you'll use
carto workflows components get native.customsql,native.joinv2 --connection carto_dw --json
```

### Run + publish as an MCP tool

```bash
# Execute the workflow
carto workflows run abc123

# Make it callable from the CARTO MCP Server (agents will see it as a tool)
carto workflows mcp publish abc123
```

## Copying maps and workflows between organizations

A common pattern is promoting maps and workflows between environments — staging to production, customer A to customer B, or one region to another. The CLI handles connection mapping automatically and validates source accessibility before copying.

**Prerequisites:** authenticate to both organizations using [named profiles](/carto-for-agents/cli/authentication#multiple-profiles).

You'll need the **ID** of the map or workflow to copy. Get it from the CARTO Workspace (three-dot menu on the card, or from the URL), or search by name with `carto maps list --search "<name>"` / `carto workflows list --search "<name>"`.

```bash
# Auto-map connections by name (default, recommended)
carto maps copy <map-id> --dest-profile <profile-name>
carto workflows copy <workflow-id> --dest-profile <profile-name>
```

By default, CARTO will try to map each connection used by the source resource to a connection **with the same name** in the destination organization. If a Snowflake connection is called `production` in both orgs, the copy works without further configuration.

When connection names differ, supply an explicit mapping:

{% code overflow="wrap" %}

```bash
carto maps copy <map-id> --dest-profile <profile-name> \
  --connection-mapping "dev-bq=prod-bq,dev-postgres=prod-postgres"
```

{% endcode %}

{% code overflow="wrap" %}

```bash
carto workflows copy <workflow-id> --dest-profile <profile-name> \
  --connection <connection-name>
```

{% endcode %}

{% hint style="info" %}
The CLI assumes mapped connections **have the same data access permissions**. If they don't, the copied resources will fail to load.
{% endhint %}

{% hint style="info" %}
Copying does not delete the original resource.
{% endhint %}

### Smart connection mapping

The CLI handles connection mapping with three strategies, in priority order:

1. **Auto-mapping by name (default)** — match connections by name between source and destination.
2. **Manual mapping** — explicit pairs via `--connection-mapping`.
3. **Legacy single connection** — use one connection for all datasets via `--connection`.

```bash
# Auto-map (recommended)
carto maps copy abc123 --dest-profile production
# → Automatically maps: bigquery-dev → bigquery-dev, snowflake → snowflake

# Manual mapping for renamed connections
carto maps copy map456 \
  --source-profile staging \
  --dest-profile production \
  --connection-mapping "bigquery-dev=bigquery-prod,snowflake-staging=snowflake-prod"

# Legacy: single connection for all datasets
carto maps copy xyz789 --dest-profile prod --connection prod-bigquery

# Combine options
carto maps copy map456 \
  --dest-profile production \
  --connection-mapping "dev-bq=prod-bq" \
  --title "Production Sales Dashboard" \
  --keep-privacy
```

**How copy works:**

1. Fetches the source map configuration and all datasets.
2. Identifies all unique connections used by the map.
3. Resolves each connection in priority order: manual mapping → auto-map by name → legacy single connection.
4. Validates that all destination connections exist (fails fast if any are missing).
5. **Validates that dataset sources are accessible** in the destination using SQL dry-run queries (`WHERE 1=0`). Tests permissions and existence without transferring data. Fails if any source is inaccessible (unless `--skip-source-validation`).
6. Creates the new map and datasets with resolved connections.
7. Updates the map configuration with the new dataset IDs.
8. Preserves privacy settings if `--keep-privacy` is set.

**Connection resolution scenarios:**

*Scenario 1 — Perfect match (auto-mapping):*

```bash
carto maps copy abc123 --dest-profile prod
# Source has: bigquery-dev, snowflake-analytics
# Destination has: bigquery-dev, snowflake-analytics
# ✅ Success — both auto-mapped by name
```

*Scenario 2 — Renamed connections (manual mapping):*

```bash
carto maps copy abc123 --dest-profile prod \
  --connection-mapping "bigquery-dev=bigquery-prod,snowflake-analytics=snowflake-prod"
# ✅ Success — both manually mapped
```

*Scenario 3 — Mixed (manual + auto):*

```bash
carto maps copy abc123 --dest-profile prod --connection-mapping "old-conn=new-conn"
# Source has: old-conn, shared-connection
# Destination has: new-conn, shared-connection
# ✅ Success — old-conn mapped manually, shared-connection auto-mapped
```

*Scenario 4 — Missing connection:*

```bash
carto maps copy abc123 --dest-profile prod
# Source has: bigquery-dev, snowflake-analytics
# Destination has: bigquery-dev only
# ❌ Fails with clear error:
#    Missing connections in destination organization:
#      • "snowflake-analytics" (used by 3 datasets)
#    Solutions:
#      1. Create missing connections in destination
#      2. Use --connection-mapping to map to different names
```

*Scenario 5 — Source validation failure:*

```bash
carto maps copy abc123 --dest-profile prod --connection-mapping "dev-bq=prod-bq"
# Connections mapped successfully, but...
# ❌ Source validation failed - datasets cannot access their data sources:
#    • "NYC Traffic" → my-project.dataset.traffic_table
#      Error: Permission bigquery.tables.get denied on table (or it may not exist)
#    Solutions:
#      1. Grant access to these tables in the destination connection
#      2. Ensure tables/views exist in the destination data warehouse
#      3. Use --skip-source-validation to create the map anyway
```

*Scenario 6 — Skip source validation (intentional broken map):*

```bash
carto maps copy abc123 --dest-profile prod \
  --connection-mapping "dev-bq=prod-bq" \
  --skip-source-validation
# ✅ Success — map created but datasets won't load data until access is fixed
```

### Troubleshooting

**Error: "Connection 'X' not found in destination organization"**

* Run `carto connections list --profile <dest-profile>` to see available connections.
* Create the missing connection in the destination organization.
* Use `--connection-mapping` to map to a different name.

**Error: "Source validation failed - datasets cannot access their data sources"**

* The destination connection lacks permission to access the source tables/queries.
* Grant the necessary permissions in your data warehouse (BigQuery, Snowflake, …).
* Verify table names/paths are correct and exist in the destination.
* Use `--skip-source-validation` if you want to create the map anyway and fix access later.

**Map created but visualizations don't load**

* This shouldn't happen with validation enabled (the default).
* If you used `--skip-source-validation`, check dataset connections and permissions.

## Organization statistics

```bash
# View organization statistics and quotas
carto org stats

# Example output:
# === Organization Statistics ===
#
# Users
#   Total users:           184
#   Editor users:          179
#   Viewer users:          1
#   Superadmin users:      2
#   API Access Tokens:     2,374
#
# Resources
#   Maps:                  3,792 (2,897 public)
#   All users maps:        13,624
#   Workflows:             872
#   Connections:           569
#   Applications:          201
#
# Usage & Quotas
#   Usage quota:           7,702,490
#   LDS credits:           1,069,663 of 15,000,000 (7%)
#   Map loads:             53,194
#
# AI Quotas
#   Builder Gen AI:        0 of 250 threads
#   AI Agents tokens:      292,187 available

# JSON output for scripting
carto org stats --json
```

The displayed information depends on your permissions:

* **Regular users** — see resource counts and basic stats.
* **Admin users** — see full organization statistics including quotas.
* **Access denied** for some stats — partial data is shown with notes.

## User management

```bash
# List all users
carto users list

# Filter by role
carto users list --role Builder
carto users list --role Viewer --all

# Search for specific users
carto users list --search "john"
carto users list --search "@company.com"

# Get detailed info (by user ID or email)
carto users get google-oauth2|123456789
carto users get jatorre@carto.com

# Invite a single user
carto users invite newuser@company.com --role Builder

# Invite multiple users at once
carto users invite user1@company.com,user2@company.com --role Viewer

# Check pending invitations
carto users invitations

# JSON output for automation
carto users list --json | jq '.[] | {email, roles: .app_metadata.roles}'
```

## Activity data analysis

Query activity data with DuckDB SQL — no data warehouse needed. The first query with a given date range downloads data (\~10s); subsequent queries are instant from the local cache.

```bash
# Simple count
carto activity query --start-date 2025-10-01 --end-date 2025-10-07 \
  --sql "SELECT COUNT(*) as total_events FROM activity"

# Maps created per user, joined with userList for emails
carto activity query --start-date 2025-10-01 --end-date 2025-10-07 --sql "
  SELECT
    CAST(a.ts AS DATE) as date,
    u.email,
    COUNT(*) AS created_maps
  FROM activity a
  JOIN userList u ON json_extract_string(a.data, '$.userId') = u.user_id
  WHERE a.type = 'MapCreated'
  GROUP BY date, u.email
  ORDER BY created_maps DESC
  LIMIT 10
"

# User activity by role
carto activity query --start-date 2025-10-01 --end-date 2025-10-07 --sql "
  SELECT u.email, u.role, COUNT(*) as events
  FROM activity a
  JOIN userList u ON json_extract_string(a.data, '$.userId') = u.user_id
  GROUP BY u.email, u.role
  ORDER BY events DESC
"

# Export raw files for loading into your warehouse
carto activity export --start-date 2025-10-01 --end-date 2025-10-07 --format parquet
```

See [`activity` command reference](/carto-for-agents/cli/command-reference/activity) for the full schema and DuckDB syntax tips.

## Chatting with a map's AI agent

```bash
# Interactive multi-turn conversation
carto aifeature aiagent <map-id>

# One-shot
carto aifeature aiagent <map-id> "What are the traffic patterns?"

# Continue a previous conversation
carto aifeature aiagent <map-id> "Tell me more" --conversation-id abc123

# Pipe a message
echo "Analyze the collision data" | carto aifeature aiagent <map-id>

# JSON for automation / CI agent quality tests
carto aifeature aiagent <map-id> "Summarize the data" --json
```

Useful for testing agent instructions during development, debugging which workflows the agent invokes, and integrating agent validation into CI pipelines.


# Release notes

This page tracks user-visible changes to the [CARTO CLI](/carto-for-agents/cli). For the full engineering changelog, see the source repository.

{% updates %}
{% update date="2026-06-29" %}

## June 29th, 2026 (v0.9.0)

**Workflows**

Breaking changes

* [`carto workflows validate`](/carto-for-agents/cli/command-reference/workflows) now validates against the connection's **live component catalog** instead of running fully offline. On top of the structural checks, it confirms that every component name and parameter exists in the connection's catalog — native functions, extensions, and stored procedures. As a result it needs a connection (read from the bundle's `connectionId`, or supplied with the new `--connection <name|uuid>` flag) and an authenticated session. [`carto workflows create`](/carto-for-agents/cli/command-reference/workflows) and [`update`](/carto-for-agents/cli/command-reference/workflows) run the same catalog-aware pre-flight before submitting.

{% hint style="warning" %}
**Migration**: `workflows validate` previously made no API calls. If you run it in CI, make sure the bundle carries a `connectionId` (or pass `--connection`) and that the environment is authenticated.
{% endhint %}

**SQL**

New

* [`carto sql query`](/carto-for-agents/cli/command-reference/sql) and [`carto sql job`](/carto-for-agents/cli/command-reference/sql) accept `--param key=value` (repeatable) and `--params-json '<json>'` to bind query parameters. `--param` values are JSON-parsed — numbers, booleans, and arrays keep their type, everything else is treated as a string — while `--params-json` takes a full JSON object or array for complete control. The two flags can't be combined.
* [`carto sql query`](/carto-for-agents/cli/command-reference/sql) also accepts a [named source](/carto-for-agents/cli/command-reference/named-sources) name in the SQL position, so you can run a saved query by name (and bind its parameters with `--param`) without writing the SQL by hand.

**Admin**

Fix

* [`carto admin settings apply`](/carto-for-agents/cli/command-reference/admin) now reports any models the API failed to apply, so partial failures surface instead of appearing to succeed.
  {% endupdate %}

{% update date="2026-05-29" %}

## May 29th, 2026 (v0.8.0)

**Workflows**

Breaking changes

* [`carto workflows verify-remote`](/carto-for-agents/cli/command-reference/workflows) no longer fails on advisory warnings. The exit code (and the `valid` field on `--json` output) now reflects whether the workflow would be accepted by `workflows create`. Warnings are still listed in the output, but on their own they no longer break the run.

{% hint style="warning" %}
**Migration**: if you have a CI gate that relied on any warning failing the build, pass the new `--strict` flag to restore the previous behaviour.
{% endhint %}

New

* [`carto workflows verify-remote --strict`](/carto-for-agents/cli/command-reference/workflows) restores the previous behaviour, where any warning fails the exit code. Useful for CI gates that want to enforce a clean run.

Improvement

* [`carto workflows components get --json`](/carto-for-agents/cli/command-reference/workflows) now returns the human-readable option labels alongside the values that components accept. For inputs like `native.isolines.mode`, bundle authors can pick the value the engine expects (`"walk"`) without mistaking it for the display label (`"Walk"`).
* [`carto workflows create`](/carto-for-agents/cli/command-reference/workflows) accepts both a stringified `FeatureCollection` and a `FeatureCollection` object on the `native.tablefromgeojson` and `native.drawcustomgeographies` components, so workflows that ingest GeoJSON can now be authored from the CLI.

Fix

* [`carto workflows create`](/carto-for-agents/cli/command-reference/workflows) now prints the canonical workflow URL on success, so callers no longer have to assemble it themselves.

**Maps**

Improvement

* [`carto maps schema layers`](/carto-for-agents/cli/command-reference/maps) now lists the four `Scale with zoom level` radius fields for tileset point layers — `radiusScaleWithZoom`, `radiusReferenceZoom`, `sizeMinPixels`, `sizeMaxPixels` — so bundle authors can discover the mode. [`carto maps validate`](/carto-for-agents/cli/command-reference/maps) also rejects two shapes that would silently break in Builder: `radiusScaleWithZoom: true` without a `radius` value, and `radiusScaleWithZoom: true` alongside a `radiusField`.

Fix

* [`carto maps create`](/carto-for-agents/cli/command-reference/maps) now emits the correct Builder URL. The URL could previously fall back to a different host that returned 404.

**Connections**

Fix

* [`carto connections browse --max-items`](/carto-for-agents/cli/command-reference/connections) and `--max-children` are now honoured. Both flags were silently dropped, so browse output capped at 30 items regardless of value.

**Credentials**

New

* [`carto credentials create token`](/carto-for-agents/cli/command-reference/credentials) accepts wildcard `--source` patterns (e.g. `"carto.shared.CARTO_*"`, or `"*"` for all sources on the connection), an `--expiration-date` flag (ISO date or shorthand like `30d` / `6m` / `1y`), and an optional `--name` label, so a single token can be scoped to a fleet of warehouses and aged out automatically.

**Admin**

New

* [`carto admin settings get|apply|diff`](/carto-for-agents/cli/command-reference/admin) round-trips org-wide administrative settings (basemaps toggles, palettes, maps, connections, workflows, builder-gen-ai, carto-ai) as a single JSON bundle. Useful for moving settings between environments or capturing a snapshot for audit.
  {% endupdate %}

{% update date="2026-05-14" %}

## May 14th, 2026 (v0.7.1)

**Maps**

Improvement

* The `add_layer` core tool surfaced by [`carto maps agents core-tools`](/carto-for-agents/cli/command-reference/maps) now accepts `clickColumns` and `clickColumnsAggregation`, so the Builder AI agent can author click popups end-to-end (previously only hover popups were configurable). Aggregation rules mirror `hoverColumns` / `hoverColumnsAggregation`, and `clickColumns` has no field-count cap (the hover cap of 5 still applies).
  {% endupdate %}

{% update date="2026-05-13" %}

## May 13th, 2026 (v0.7.0)

This release introduces **map and workflow authoring from the command line** and lands alongside the new [CARTO for Agents](/carto-for-agents/carto-for-agents) section, which brings the CLI together with the [CARTO MCP Server](/carto-for-agents/mcp-server) and the [Agent Skills](/carto-for-agents/agent-skills) catalog.

**Maps**

New

* Author Builder maps end-to-end from the CLI. [`carto maps create`](/carto-for-agents/cli/command-reference/maps) and [`carto maps update`](/carto-for-agents/cli/command-reference/maps) accept a round-trippable JSON bundle as a positional argument, a filesystem path, or via stdin. The bundle returned by `maps get --json` can be piped straight back into `create` or `update`.
* New commands round out the authoring loop: [`maps validate`](/carto-for-agents/cli/command-reference/maps) (offline pre-flight, no API calls), [`maps verify-remote`](/carto-for-agents/cli/command-reference/maps) (pre-flight plus warehouse-side dry-runs), [`maps publish`](/carto-for-agents/cli/command-reference/maps) (freeze a snapshot so shared and public viewers see the current state), [`maps schema`](/carto-for-agents/cli/command-reference/maps) (JSON Schema reference for bundle authors), [`maps agents`](/carto-for-agents/cli/command-reference/maps) (inspect the AI surface available on a tenant), and [`maps copy --dest-profile`](/carto-for-agents/cli/command-reference/maps) (duplicate a map across organizations).
* `maps create` and `maps update` responses now expose `builderUrl`, `viewerUrl`, and `publicUrl` as first-class fields.

Improvement

* Bundles are pre-flight validated before any API call, with clear pointers to the offending field on failure. Broken sources, missing required fields, and shapes that would render incorrectly in Builder are rejected locally.
* Sensible defaults are auto-filled when bundle fields are omitted (popup `enabled`, widget `operationColumn`, `collapsible`, basemap and viewport hydration from `/stats`), so smaller bundles "just work".

**Workflows**

New

* Author and validate workflows from the CLI. [`carto workflows create`](/carto-for-agents/cli/command-reference/workflows), [`update`](/carto-for-agents/cli/command-reference/workflows), and [`validate`](/carto-for-agents/cli/command-reference/workflows) (offline schema check), plus the new [`workflows verify`](/carto-for-agents/cli/command-reference/workflows) command — warehouse-aware validation that requires `--connection <name|uuid>` and runs the full structural, engine-compile, schema-trace, and sources stack without writing the workflow.
* [`carto workflows components list`](/carto-for-agents/cli/command-reference/workflows) and [`get`](/carto-for-agents/cli/command-reference/workflows) surface the agent-facing component catalog. Both require `--connection <name|uuid>` so extension and stored-procedure components appear alongside native ones.

Fix

* `carto workflows list --order-by updated|created` no longer fails with a 500. The CLI now aliases `updated` → `updated_at` and `created` → `created_at` before calling the API. Canonical values still work unchanged.

{% hint style="info" %}
For end-to-end recipes — including the agent skills that drive these flows — see the [`carto-create-builder-maps`](https://github.com/CartoDB/agent-skills/tree/master/skills/carto-create-builder-maps) and [`carto-create-workflow`](https://github.com/CartoDB/agent-skills/tree/master/skills/carto-create-workflow) skills in the [agent-skills repository](https://github.com/CartoDB/agent-skills), and the [CARTO for Agents](/carto-for-agents/carto-for-agents) section.
{% endhint %}
{% endupdate %}

{% update date="2026-04-27" %}

## April 27th, 2026 (v0.6.0)

Breaking changes

* [`carto export`](/carto-for-agents/cli/command-reference/export) no longer accepts `--query`. Use `--select <cols>` (comma-separated column list) and `--where <predicate>` (warehouse-native SQL, no leading `WHERE`) instead. `--limit` is unchanged.

{% hint style="warning" %}
**Migration**: rewrite `carto export --query "SELECT a, b FROM t WHERE c > 0"` as `carto export <t> --select a,b --where "c > 0"`.
{% endhint %}
{% endupdate %}

{% update date="2026-04-25" %}

## April 25th, 2026 (v0.5.0)

Fix

* Kebab-case flag forms (`--page-size`, `--order-by`, `--order-direction`, `--max-children`) on list commands now work as documented across `maps`, `workflows`, `connections`, `users`, `credentials`, and `admin`. The camelCase forms (`--pageSize`, `--orderBy`, …) continue to work as aliases.
  {% endupdate %}

{% update date="2025-12-31" %}

## December 31st, 2025 (v0.1.0)

New

* Initial release of the CARTO CLI.
* Multi-profile authentication, including M2M OAuth for CI/CD pipelines.
* Commands for `maps`, `workflows`, `connections`, `credentials`, `users`, `imports`, and `admin`, with JSON output mode for scripting.
  {% endupdate %}
  {% endupdates %}


# CARTO MCP Server

The CARTO MCP Server is the AI integration into your CARTO platform: your workspace, saved Builder maps, workflows, and connected data warehouses. Through the [Model Context Protocol](https://modelcontextprotocol.io/) (MCP), agents like Claude or ChatGPT can explore your data, render interactive maps inline in the chat (ad-hoc visualizations or saved Builder maps), inspect data assets and column distributions, and run your organization's saved analytical workflows.

{% hint style="info" %}
CARTO will expand support over time by exposing core GIS operations (geocoding, isochrones, routing) directly as MCP Tools. Get in touch if you're interested.
{% endhint %}

## Using CARTO MCP Server

Get the **MCP Server URL** from your CARTO Workspace under **Developers > Workflow API & MCP Server** (shown in the CARTO AI section). It follows this pattern:

```
https://<region>.api.carto.com/mcp/<account_id>
```

Then connect to the server using one of the following methods:

* [**OAuth (U2M)**](/carto-for-agents/mcp-server/connecting-with-oauth#oauth-u2m). Interactive login with your CARTO account. Claude.ai and Claude Code connect with just the URL (no OAuth client needed); other clients use an SPA OAuth client. Best for interactive clients like Claude.ai or ChatGPT.
* [**OAuth (M2M)**](/carto-for-agents/mcp-server/connecting-with-oauth#oauth-m2m). Uses an [M2M OAuth client](/carto-user-manual/developers/managing-credentials/m2m-oauth-clients) for unattended access over OAuth.
* [**API Access Token**](/carto-for-agents/mcp-server/connecting-with-api-tokens). Unattended access using a token with predefined scopes.

{% hint style="warning" %}
With the **API Access Token** method, the `list_maps` tool is currently unavailable. Every other tool works. Use OAuth (U2M or M2M) if you need `list_maps`.
{% endhint %}

***

## Available tools

The CARTO MCP Server ships with a catalog of built-in tools. Your team can add to it by publishing any workflow as an MCP tool. The catalog is organized into three categories. Full per-tool documentation is in the [MCP Tools Reference](/carto-for-agents/mcp-server/tools-reference).

<table><thead><tr><th width="280">Category</th><th>What it does</th></tr></thead><tbody><tr><td><a href="/pages/3u5R5lcTK8JT7zygV3oW"><strong>Platform tools</strong></a></td><td>Help the agent find the right data. List connections, browse and search tables, inspect column distributions, and locate saved maps. Returns JSON for the agent to reason over.</td></tr><tr><td><a href="/pages/cEnllyMfFblR84A3Qb8s"><strong>Interactive tools</strong></a></td><td>Render an interactive map directly inline in the chat. Ad-hoc visualizations the agent composes from your data, or one of your saved CARTO Builder maps.</td></tr><tr><td><a href="/pages/AyFKSPLPoTBMtNk5H9a5"><strong>Workflows tools</strong></a></td><td>Run analytical workflows your team has published as MCP tools, in sync or async mode. Async jobs are driven by two built-in helper tools.</td></tr></tbody></table>

{% hint style="info" %}
Interactive tools render inline only in MCP clients that support [MCP Apps](https://modelcontextprotocol.io/specification/2025-06-18/server/utilities/apps): Claude.ai, ChatGPT, Claude Desktop, and others. In clients that don't, the tools return a text confirmation describing what would have been rendered.
{% endhint %}


# Connecting with OAuth

OAuth lets AI clients connect to the CARTO MCP Server without manually managing tokens. There are two flavors:

* **OAuth (U2M)**: user-to-machine. The user logs in through the client and is redirected to CARTO to authorize access. Best for interactive clients like Claude.ai, Claude Code, or ChatGPT.
* **OAuth (M2M)**: machine-to-machine. The client authenticates with its own credentials and connects unattended, with no user login.

For token-based connections instead, see [Connecting with API Access Tokens](/carto-for-agents/mcp-server/connecting-with-api-tokens).

## OAuth (U2M)

OAuth (U2M) requires a user to authenticate with their CARTO credentials. Adding an MCP Server varies by client, so refer to your client's own documentation:

* [Claude Code](https://code.claude.com/docs/en/mcp-quickstart)
* [Claude.ai (web and desktop)](https://support.claude.com/en/articles/11175166-how-to-connect-remote-mcp-integrations-to-claude)
* [ChatGPT](https://help.openai.com/en/articles/12584461-developer-mode-apps-and-full-mcp-connectors-in-chatgpt-beta) (requires a paid plan and Developer Mode)

On the CARTO side, how much setup you need depends on whether your client supports CIMD.

### Clients supported with CIMD

**Claude.ai** and **Claude Code** support Client Identifier Metadata Document (CIMD) registration, so CARTO recognizes them automatically. **You do not need to create any OAuth client: no SPA client, no M2M client, nothing.** Just point the client at the URL and log in:

1. Copy the **MCP Server URL** from **Developers > Workflow API & MCP Server**.
2. Add it as a new MCP Server in your client (see the links above).
3. When the client connects, you are redirected to CARTO. Log in with your CARTO account to authorize access.

That's it. The connection is ready to use.

### Other clients

Other clients, including ChatGPT, MCP Inspector, and MCP Jam, do not support CIMD, so you must create a SPA OAuth client in CARTO and connect with its credentials. This requires a CARTO organization with access to the Developers section.

#### Step 1: Create a SPA OAuth Client

Navigate to **Developers > Credentials** in CARTO Workspace. Switch to the **SPA OAuth Clients** tab and click **Create new > SPA OAuth Client**.

1. Enter a descriptive **Name** (e.g. "ChatGPT MCP Connection").
2. Uncheck **"Use default logout/callback URLs and origins"**.
3. In **Allowed Callback URLs**, enter the URL that matches your AI platform (see table below).
4. Click **Save changes**.
5. Copy the **Client ID** and **Client Secret**. You will need them in Step 2.

For more details on SPA OAuth Client configuration, see [SPA OAuth Clients](/carto-user-manual/developers/managing-credentials/spa-oauth-clients).

**Callback URLs by platform**

| MCP Client    | Callback URL                                                                         |
| ------------- | ------------------------------------------------------------------------------------ |
| ChatGPT       | `https://chatgpt.com/connector_platform_oauth_redirect`                              |
| MCP Inspector | `http://localhost:8000/callback`                                                     |
| MCP Jam       | `http://127.0.0.1:6274/oauth/callback/debug`, `http://127.0.0.1:6274/oauth/callback` |

{% hint style="info" %}
Claude.ai and Claude Code do not appear here because they use CIMD and skip this manual setup entirely. See [Clients supported with CIMD](#clients-supported-with-cimd).
{% endhint %}

{% hint style="warning" %}
The callback URL must match exactly what the AI platform expects. Do not use the default callback URLs. Each platform requires a specific URL.
{% endhint %}

{% hint style="info" %}
MCP Jam requires two callback URLs. Enter both URLs separated by commas in the Allowed Callback URLs field.
{% endhint %}

#### Step 2: Connect from your AI platform

Use the **MCP Server URL** (from the [overview page](/carto-for-agents/mcp-server#using-carto-mcp-server)), **Client ID**, and **Client Secret** to set up the connection. The exact steps vary by platform, so refer to each platform's own documentation:

* [ChatGPT: Developer Mode and full MCP connectors](https://help.openai.com/en/articles/12584461-developer-mode-apps-and-full-mcp-connectors-in-chatgpt-beta)
* [MCP Inspector on GitHub](https://github.com/modelcontextprotocol/inspector)

In general, the process is:

1. Open the MCP or connectors settings in your AI platform.
2. Add a new MCP connection and enter the **MCP Server URL**.
3. Enter the **Client ID** and **Client Secret** from Step 1.
4. Complete the OAuth authorization when redirected to CARTO.
5. After authorization, your CARTO MCP Tools will be available in conversations.

### What you authorize

During the authorization step, you grant the AI platform permission to use the CARTO MCP Server on your behalf: listing and running your published Workflows, browsing your data warehouse connections, locating your saved Builder maps, and rendering interactive visualizations.

The OAuth token inherits the rest of your CARTO permissions: the connections, datasets, and maps your user account has access to. You can revoke the connection at any time from your CARTO Workspace under **Developers > Credentials > SPA OAuth Clients**, or from your AI platform's connector settings.

{% hint style="warning" %}
**Timeouts in web-based clients.** Web platforms typically enforce short request timeouts (around 10 seconds). Make sure your Workflows can complete within that window when using **Sync** mode. For longer-running processes, use **Async** mode and instruct the agent to use the available tools for polling execution status and fetching results when the job is finalized.
{% endhint %}

## OAuth (M2M)

OAuth (M2M) provides unattended access over OAuth using a machine-to-machine OAuth client, with no interactive user login. This requires a CARTO organization with access to the Developers section.

1. In CARTO Workspace, go to **Developers > Credentials** and switch to the **M2M OAuth Clients** tab.
2. Click **Create new > M2M OAuth Client**, enter a descriptive **Name**, and save.
3. Open the client with **View or edit credential** and copy its **Client ID** and **Client Secret**.
4. Configure your AI client with the **MCP Server URL** (from the [overview page](/carto-for-agents/mcp-server#using-carto-mcp-server)), **Client ID**, and **Client Secret**. The client exchanges these for an access token and connects with no user login.

For more details on M2M OAuth Client configuration, see [M2M OAuth Clients](/carto-user-manual/developers/managing-credentials/m2m-oauth-clients).

## Troubleshooting

* **Authentication fails or redirects to the wrong URL:** Verify that the Allowed Callback URL in your SPA OAuth Client matches the platform exactly. See the [callback URL table](#callback-urls-by-platform) above.
* **No tools appear after connecting:** Ensure your Workflows are published as MCP Tools and have been synced. See [Workflows as MCP Tools](/carto-user-manual/workflows/workflows-as-mcp-tools).
* **Permission errors after authenticating:** The OAuth token inherits the permissions of the CARTO user who authenticated. Ensure that user has access to the relevant Workflows and data connections.


# Connecting with API Access Tokens

CLI-based agents such as Gemini CLI connect to the CARTO MCP Server using API Access Tokens. You create a token in CARTO Workspace, then pass it as an authorization header when registering the MCP Server in your agent.

{% hint style="info" %}
For web-based AI platforms like Claude.ai that support OAuth, see [Connecting with OAuth](/carto-for-agents/mcp-server/connecting-with-oauth).
{% endhint %}

{% hint style="warning" %}
With an API Access Token, the `list_maps` tool is currently unavailable. Every other tool works. Use [OAuth](/carto-for-agents/mcp-server/connecting-with-oauth) if you need `list_maps`.
{% endhint %}

## Step 1: Create an API Access Token

The MCP Server requires authentication via an [API Access Token](/carto-user-manual/developers/managing-credentials/api-access-tokens):

1. In CARTO Workspace, [create a new token](/carto-user-manual/developers/managing-credentials/api-access-tokens#creating-an-api-access-token).
2. In Allowed APIs, select the **MCP Server** permission scope.
3. Copy the token securely, as it will be required to connect the agent to the server.

<figure><img src="/files/F5vOfKHLHEY0C41Mghp1" alt=""><figcaption></figcaption></figure>

## Step 2: Add MCP Server to your agent

Use the **MCP Server URL** (from the [overview page](/carto-for-agents/mcp-server#using-carto-mcp-server)) and the API Access Token to register the server in your agent. For example, with Gemini CLI:

```bash
gemini mcp add carto-pm-org \
  https://<region>.api.carto.com/mcp/<account_id> \
  -H 'Authorization: Bearer <YOUR_API_TOKEN>' \
  -t http
```

* Replace `<region>` and `<account_id>` with the values shown in your MCP Server URL (copy the full URL from **Developers > Workflow API & MCP Server**).
* `-t http` specifies the transport protocol.
* The `Authorization` header includes the API Access Token created in the previous step.

After this setup, the agent will be able to call the MCP Tools you created with Workflows and return geospatial results in response to questions.


# MCP Tools Reference

The CARTO MCP Server exposes a catalog of tools an agent can call to explore your data, render maps, and run analytical workflows. Tools fall into three categories, each with its own page in this reference.

<table><thead><tr><th width="280">Category</th><th>What it does</th><th>Tools</th></tr></thead><tbody><tr><td><a href="/pages/3u5R5lcTK8JT7zygV3oW"><strong>Platform tools</strong></a></td><td>Help the agent find the right data. List connections, browse and search tables, inspect column distributions, and locate saved maps.</td><td><code>list_connections</code>, <code>list_resources</code>, <code>search_resources</code>, <code>describe</code>, <code>list_maps</code></td></tr><tr><td><a href="/pages/cEnllyMfFblR84A3Qb8s"><strong>Interactive tools</strong></a></td><td>Render an interactive map directly inline in the chat. Ad-hoc visualizations or saved CARTO Builder maps.</td><td><code>view_map</code>, <code>load_builder_map</code></td></tr><tr><td><a href="/pages/AyFKSPLPoTBMtNk5H9a5"><strong>Workflows tools</strong></a></td><td>Run analytical workflows your organization has published as MCP tools, in sync or async mode.</td><td>Your published workflows, plus <code>async_workflow_job_get_status_v1_0_0</code> and <code>async_workflow_job_get_results_v1_0_0</code></td></tr></tbody></table>

{% hint style="info" %}
Interactive tools render inline only in MCP clients that support [MCP Apps](https://modelcontextprotocol.io/specification/2025-06-18/server/utilities/apps): Claude.ai, ChatGPT, Claude Desktop, and others. In clients that don't, the tools return a text confirmation describing what would have been rendered.
{% endhint %}


# Platform tools

Platform tools help your agent find the right data and the right map before any visualization or analysis happens. They return JSON for the agent to reason over; no inline UI is rendered. Use them to enumerate connections, browse the warehouse hierarchically, search for tables by name, inspect column distributions, and locate saved Builder maps.

## Data discovery

### `list_connections`

**Description**

Lists all available data warehouse connections for the account. Returns connection names, provider types, and IDs.

**Example:** An agent asked *"What data do I have access to?"* would call `list_connections` to get a list:

```
[
  { "name": "carto_dw", "provider": "bigquery" },
  { "name": "my_snowflake", "provider": "snowflake" }
]
```

**Input properties:**

*No parameters*

**Output:**

A JSON array of connection objects, each containing the connection name, provider type, and ID.

<details>

<summary>Response example</summary>

```
{
  "status": 200,
  "data": [
    {
      "id": "a1b2c3d4-e5f6-7890-abcd-ef1234567890",
      "name": "carto_dw",
      "provider_id": "bigquery",
      "privacy": "shared",
      "carto_dw": true,
      "created_at": "2024-01-15T10:30:00.000Z",
      "updated_at": "2024-06-20T14:22:00.000Z"
    },
    {
      "id": "b2c3d4e5-f6a7-8901-bcde-f12345678901",
      "name": "my_snowflake",
      "provider_id": "snowflake",
      "privacy": "shared",
      "carto_dw": false,
      "created_at": "2024-03-10T08:00:00.000Z",
      "updated_at": "2024-03-10T08:00:00.000Z"
    }
  ]
}
```

</details>

**Example**

*"What data do I have access to?"*

The agent calls `list_connections` with no parameters and returns a summary of available connections:

```
list_connections()
```

***

### `list_resources`

**Description**

Browses the contents of a data warehouse connection hierarchically. Returns databases, schemas, tables, and views at the requested level.

The hierarchy varies by provider:

* **BigQuery:** connection > project > dataset > table/view
* **Snowflake:** connection > database > schema > table/view
* **Databricks:** connection > catalog > schema > table/view
* **PostgreSQL / Redshift:** connection > database > schema > table/view

Call with no `fqn` to see the top level, then pass an `fqn` to drill into a specific database or schema. Use `maxDepth=2` to expand one level deeper in a single call (e.g., see schemas AND their tables).

**Input properties**

| Parameter         | Type   | Required | Description                                                                                                             |
| ----------------- | ------ | -------- | ----------------------------------------------------------------------------------------------------------------------- |
| `connection_name` | string | Yes      | Name of the connection (from `list_connections`).                                                                       |
| `fqn`             | string | No       | Fully qualified name to browse. Omit for top level. Examples: `"my_database"`, `"my_database.my_schema"`.               |
| `maxDepth`        | number | No       | How many levels deep to expand (1=current level only, 2=include children, 3=include grandchildren). Default: 1, max: 3. |
| `maxItems`        | number | No       | Maximum total items to return across all levels. Default: 30, max: 500.                                                 |

**Output**

A JSON object with a hierarchical structure of resources at the requested level. Each resource includes its name, fully qualified name, type (`database`, `schema`, `table`, or `view`), and any children if expanded.

<details>

<summary>Response example</summary>

```
{
  "status": 200,
  "data": {
    "provider": "bigquery",
    "type": "connection",
    "children": [
      {
        "id": "my_project",
        "name": "my_project",
        "type": "database",
        "children": [
          {
            "id": "my_project.retail_data",
            "name": "retail_data",
            "type": "schema",
            "children": [
              {
                "id": "my_project.retail_data.stores",
                "name": "stores",
                "type": "table"
              },
              {
                "id": "my_project.retail_data.sales_regions",
                "name": "sales_regions",
                "type": "table"
              }
            ],
            "childCount": 2,
            "childrenTruncated": false
          }
        ],
        "childCount": 5,
        "childrenTruncated": true
      }
    ],
    "returnedItems": 8,
    "maxItemsApplied": 30,
    "truncated": false,
    "rootChildrenTruncated": false,
    "totalRootChildren": 1
  }
}
```

</details>

**Example**

*"What tables are in the retail\_data dataset?"*

The agent first discovered the `carto_dw` connection via `list_connections`, then drills into a specific dataset:

```
// First call: list top-level projects
list_resources({ connection_name: "carto_dw" })

// Second call: drill into a dataset and expand tables
list_resources({
  connection_name: "carto_dw",
  fqn: "my_project.retail_data",
  maxDepth: 2
})
```

***

### `search_resources`

**Description**

Searches for tables and views by name across a data warehouse connection. Returns a flat, ranked list of matches (exact match first, then prefix, then contains). Use this instead of `list_resources` when you know part of the table name but not where it lives.

For faster results, pass a `scopeFqn` to narrow the search to a specific database or schema. Without a scope, multi-database providers (Snowflake, BigQuery, Databricks) search the first 10 databases/datasets alphabetically. The response includes `searchedContainers`/`totalContainers` so you know if the search was partial.

**Input properties**

| Parameter         | Type   | Required | Description                                                                                                                                   |
| ----------------- | ------ | -------- | --------------------------------------------------------------------------------------------------------------------------------------------- |
| `connection_name` | string | Yes      | Name of the connection (from `list_connections`).                                                                                             |
| `query`           | string | Yes      | Search string to match against table/view names (case-insensitive).                                                                           |
| `type`            | string | No       | Filter results to only `"table"` or only `"view"`.                                                                                            |
| `limit`           | number | No       | Max results to return (1–100). Default: 20.                                                                                                   |
| `scopeFqn`        | string | No       | Narrow search to a specific database, schema, or dataset. Makes the search much faster. Examples: `"my_database"`, `"my_database.my_schema"`. |

**Output**

A JSON object containing a flat array of matching resources. Results are ranked by match quality (exact, then prefix, then contains). The `searchedContainers` and `totalContainers` fields indicate whether the search covered all databases/datasets or was partial.

<details>

<summary>Response example</summary>

```
{
  "status": 200,
  "data": {
    "provider": "bigquery",
    "results": [
      {
        "id": "my_project.retail_data.stores",
        "name": "stores",
        "type": "table",
        "database": "my_project",
        "schema": "retail_data",
        "fqn": "my_project.retail_data.stores",
        "_links": {
          "resources": "/connections/carto_dw/resources/my_project.retail_data.stores"
        }
      },
      {
        "id": "my_project.geo_data.stores_backup",
        "name": "stores_backup",
        "type": "table",
        "database": "my_project",
        "schema": "geo_data",
        "fqn": "my_project.geo_data.stores_backup",
        "_links": {
          "resources": "/connections/carto_dw/resources/my_project.geo_data.stores_backup"
        }
      }
    ],
    "returnedResults": 2,
    "truncated": false,
    "query": "stores",
    "scopeFqn": "my_project.retail_data",
    "searchedContainers": 1,
    "totalContainers": 1
  }
}
```

</details>

**Example**

*"Do we have any table with store locations?"*

The agent searches across the connection for tables matching "stores":

```
search_resources({
  connection_name: "carto_dw",
  query: "stores",
  scopeFqn: "my_project.retail_data"
})
```

***

### `describe`

**Description**

Inspects a table or a SQL query — returns the column schema (and geometry column, geometry type, row count when available) or, when a `column` is provided, distribution statistics for that column. One tool, four modes:

| Mode                  | Required parameters                      | Returns                                             |
| --------------------- | ---------------------------------------- | --------------------------------------------------- |
| Table schema          | `connection_name`, `table_fqn`           | Columns + `geomField` / `geometryType` / `rowCount` |
| Query schema          | `connection_name`, `query`               | Columns + `geomField` / `geometryType` / `rowCount` |
| Column stats on table | `connection_name`, `table_fqn`, `column` | Stats for that column                               |
| Column stats on query | `connection_name`, `query`, `column`     | Stats for that column                               |

Use schema mode to discover what columns a table or query has before styling. Use stats mode in declarative [`view_map`](/carto-for-agents/mcp-server/tools-reference/interactive-tools#view_map) flows to drive data-aware styling:

* For `colorBins`: use the returned quantiles to derive thresholds (e.g., quartiles → 4-bucket scale).
* For `colorContinuous`: use `min` and `max` for the domain.
* For `colorCategories`: use the returned categories.

Query mode lets the agent inspect the columns of an arbitrary SQL query without running it against the warehouse. Pass the same SQL string that goes in the source's `sqlQuery` so schema/stats are computed over the same rows the map renders.

{% hint style="info" %}
`describe` only covers tables, views, and SQL queries. **Tilesets and rasters** are pre-baked formats whose schema isn't exposed by this endpoint — fall back to `list_resources`, which also surfaces per-band raster metadata (`colorinterp`, `colortable`, `nodata`, `minresolution`).
{% endhint %}

**Input properties**

| Parameter             | Type   | Required | Description                                                                                                             |
| --------------------- | ------ | -------- | ----------------------------------------------------------------------------------------------------------------------- |
| `connection_name`     | string | Yes      | Name of the connection (from `list_connections`).                                                                       |
| `table_fqn`           | string | No\*     | Fully qualified table name (e.g., `"db.schema.table"`). Provide this OR `query`, not both.                              |
| `query`               | string | No\*     | SQL query to inspect. Provide this OR `table_fqn`, not both.                                                            |
| `query_parameters`    | object | No       | Parameter bindings for `query`. Only valid when `query` is set.                                                         |
| `column`              | string | No       | Column to compute statistics for. When present, switches from schema mode to stats mode.                                |
| `max_categories`      | number | No       | Stats mode only. Max categories returned for string/boolean columns. Default 20.                                        |
| `categories_order_by` | string | No       | Stats mode only. Order categories by: `frequency_asc` \| `frequency_desc` \| `alphabetical_asc` \| `alphabetical_desc`. |
| `spatial_data_type`   | string | No       | Stats mode only, for geometry columns: `h3` \| `h3int` \| `quadbin` \| `geo`.                                           |

\* Exactly one of `table_fqn` or `query` is required.

**Output**

Schema mode:

```
{
  "source":       { "type": "table", "fqn": "..." },     // or { "type": "query", "sql": "..." }
  "schema":       [{ "name": "pop_max", "type": "Number" }, ...],
  "geomField":    "geom",          // optional — present when the source has a geometry column
  "geometryType": "Point",         // optional — "Point" | "LineString" | "Polygon"
  "rowCount":     12345            // optional
}
```

Stats mode (discriminated by `type`):

* `Number` → `{ type, min, max, avg, sum, quantiles: { 3: [...], 4: [...], …, 20: [...] } }` — `quantiles[N]` is an array of N+1 numbers `[min, t1, t2, …, t(N-1), max]`.
* `String` / `Boolean` → `{ type, categories: [{ category, frequency }, …] }`.
* `Timestamp` → `{ type, min, max }` as ISO 8601 strings (or `null` when empty).
* `Geometry` → `{ type, extent: { xmin, ymin, xmax, ymax } | null }`.

**Examples**

*"What columns does this table have?"*

```
describe({
  connection_name: "carto_dw",
  table_fqn: "carto-demo-data.demo_tables.populated_places"
})
// → { source, schema: [...], geomField: "geom", geometryType: "Point", rowCount: 7322 }
```

*"Color the population layer by quartiles"*

```
describe({
  connection_name: "carto_dw",
  table_fqn: "carto-demo-data.demo_tables.populated_places",
  column: "pop_max"
})
// → { type: "Number", min: 0, max: 30000000, quantiles: { 4: [0, 5000, 50000, 250000, 30000000] } }

// Drop the first and last (natural extremes); use the inner three as colorBins domain.
```

*"What columns does this SQL query produce?"*

```
describe({
  connection_name: "carto_dw",
  query: "SELECT name, COUNT(*) AS n FROM carto-demo-data.demo_tables.populated_places GROUP BY name"
})
// → { source: { type: "query", sql: "..." }, schema: [{ name: "name", type: "String" }, { name: "n", type: "Number" }] }
```

## Saved maps

### `list_maps`

**Description**

Lists the user's saved CARTO Builder maps. Returns paginated entries with id, name, privacy, owner, thumbnail, and timestamps. The returned id is the input for [`load_builder_map`](/carto-for-agents/mcp-server/tools-reference/interactive-tools#load_builder_map).

Common usage:

* Call without arguments for the most recent maps the user can access (owned + shared with them).
* Use `search` to filter by name when the user mentions a specific map by title.
* Use `mine_only=true` when the user explicitly asks for "my maps" (filters out maps shared with them by others).
* Default sort is `updated_at desc` — most recently edited first. Override with `order_by` / `order_direction` if needed.

**Input properties**

| Parameter         | Type    | Required | Description                                                                                     |
| ----------------- | ------- | -------- | ----------------------------------------------------------------------------------------------- |
| `search`          | string  | No       | Free-text search by map name (case-insensitive substring match).                                |
| `page`            | number  | No       | 1-indexed page number. Default 1.                                                               |
| `page_size`       | number  | No       | Items per page. Default 20, max 100.                                                            |
| `order_by`        | string  | No       | Sort field: `title` \| `created_at` \| `updated_at` \| `views` \| `demo`. Default `updated_at`. |
| `order_direction` | string  | No       | `asc` or `desc`. Default `desc`.                                                                |
| `privacy`         | string  | No       | Filter by privacy: `private` \| `shared` \| `public`.                                           |
| `mine_only`       | boolean | No       | When true, only maps owned by the calling user. Default false (includes maps shared with them). |

**Output**

A JSON object with a paginated array of map entries. Each entry includes the map id, name, privacy, owner, thumbnail URL, and timestamps.

**Example**

*"What are my recent maps?"*

```
list_maps({ mine_only: true, page_size: 5 })
```


# Interactive tools

Interactive tools render a real, interactive map directly inline in the chat. Your agent doesn't return a description of a map, it returns the map itself. There are two of them: [`view_map`](#view_map) for ad-hoc visualizations the agent composes from your data, and [`load_builder_map`](#load_builder_map) for opening one of your saved CARTO Builder maps.

{% hint style="info" %}
Interactive tools render inline only in MCP clients that support [MCP Apps](https://modelcontextprotocol.io/specification/2025-06-18/server/utilities/apps): Claude.ai, ChatGPT, Claude Desktop, and others. In clients that don't, the tool returns a text confirmation describing what would have been rendered.
{% endhint %}

***

### `view_map`

**Description**

Renders an ad-hoc interactive map inline in the chat from a `@deck.gl/json` declarative specification the agent generates. Use this when the user asks to map, visualize, or show the geographic distribution of points, polygons, hexagons, quadbins, clusters, density heatmaps, or raster, and the map doesn't already exist as a saved CARTO Builder map. For an existing saved map, use [`load_builder_map`](#load_builder_map) instead.

The agent generates the visualization spec from your natural-language request over any table or SQL query in your connected data warehouses. CARTO handles authentication, basemaps, and tooltips behind the scenes. You don't need to know the spec to use this tool.

The widget includes pan/zoom controls and hover/click tooltips (when the layer is `pickable` and a `getTooltip` expression is provided). The legend is not part of the map widget itself. When the MCP client supports inline UI artifacts, the agent renders the legend as a separate artifact directly underneath the map.

For example, the screenshot below was produced by the following prompt:

> *"Map Hurricane Milton's best track points, area track and track line alongside aggregated enriched H3 POIs with avg precipitation and underlying raster layer."*

<figure><img src="/files/662XQtG5uTqGA5t9LGVM" alt="view_map rendering an interactive map inline in the chat"><figcaption></figcaption></figure>

**Input properties**

| Parameter     | Type   | Required | Description                                                                                                                              |
| ------------- | ------ | -------- | ---------------------------------------------------------------------------------------------------------------------------------------- |
| `deckglProps` | object | Yes      | The visualization specification, automatically generated by the agent from your natural-language request. You don't write this yourself. |

**Output**

In MCP hosts that support [MCP Apps](https://modelcontextprotocol.io/specification/2025-06-18/server/utilities/apps), an interactive map widget renders directly inline in the chat. In hosts that don't, the tool returns a text confirmation.

**Example prompts**

Natural-language requests the agent will turn into a `view_map` call:

* *"Show me populated places on a world map"*
* *"Make a heatmap of UK solar panels"*
* *"Map the H3 cells with highest order volume in Madrid"*

<details>

<summary>For developers: deck.gl spec reference</summary>

This section documents the shape of the `deckglProps` value the agent emits, for developers building custom MCP clients or debugging what their agent produces. End users do not need this.

**External references**

* [deck.gl JSON converter](https://deck.gl/docs/api-reference/json/overview). The underlying declarative spec format (`@@type`, `@@function`, `@@=` accessor expressions).
* [@deck.gl/carto layers](https://deck.gl/docs/api-reference/carto/overview). `VectorTileLayer`, `H3TileLayer`, `QuadbinTileLayer`, `ClusterTileLayer`, `HeatmapTileLayer`, `RasterTileLayer`, `PointLabelLayer`.
* [CARTO basemap styles](https://docs.carto.com/carto-for-developers/key-concepts/carto-for-deck.gl/basemaps/carto-basemap). `positron`, `dark-matter`, `voyager`.

**CARTO data sources reference** (for the `data: { "@@function": "...Source", ... }` inline value):

* [vectorTableSource](/carto-for-developers/reference/data-sources/vectortablesource), [vectorQuerySource](/carto-for-developers/reference/data-sources/vectorquerysource), [vectorTilesetSource](/carto-for-developers/reference/data-sources/vectortilesetsource)
* [h3TableSource](/carto-for-developers/reference/data-sources/h3tablesource), [h3QuerySource](/carto-for-developers/reference/data-sources/h3querysource), [h3TilesetSource](/carto-for-developers/reference/data-sources/h3tilesetsource)
* [quadbinTableSource](/carto-for-developers/reference/data-sources/quadbintablesource), [quadbinQuerySource](/carto-for-developers/reference/data-sources/quadbinquerysource), [quadbinTilesetSource](/carto-for-developers/reference/data-sources/quadbintilesetsource)
* [rasterSource](/carto-for-developers/reference/data-sources/rastersource)
* [boundaryTableSource](/carto-for-developers/reference/data-sources/boundarytablesource), [boundaryQuerySource](/carto-for-developers/reference/data-sources/boundaryquerysource)

**Spec essentials**

* **Sources go inline as the layer's `data` value**, never as top-level keys: `"data": { "@@function": "vectorTableSource", "connectionName": "...", "tableName": "..." }`.
* **Each tile layer is hardcoded to its source's tiling scheme.** Mixing schemes silently renders empty:
  * `VectorTileLayer` accepts `vector*Source` or `boundary*Source`
  * `H3TileLayer` accepts `h3*Source`
  * `QuadbinTileLayer` accepts `quadbin*Source`
  * `RasterTileLayer` accepts `rasterSource`
  * `ClusterTileLayer` and `HeatmapTileLayer` accept `h3*Source` OR `quadbin*Source` (not vector)
* **H3 and quadbin table/query sources require `aggregationExp`** (e.g., `"SUM(population) AS population, AVG(elevation) AS elevation"`). Without it the layer renders empty at any zoom below the source's native resolution.
* **Basemap** is set via top-level `mapStyle` with a CARTO style URL: `https://basemaps.cartocdn.com/gl/{positron|dark-matter|voyager}-gl-style/style.json`.
* **Credentials are injected by the renderer.** Never include `accessToken`, `apiBaseUrl`, or `clientId` in the spec.

**Example spec — vector points**

```
view_map({
  deckglProps: {
    initialViewState: { latitude: 20, longitude: 0, zoom: 2 },
    mapStyle: "https://basemaps.cartocdn.com/gl/positron-gl-style/style.json",
    layers: [{
      "@@type": "VectorTileLayer",
      id: "places",
      pickable: true,
      data: {
        "@@function": "vectorTableSource",
        connectionName: "carto_dw",
        tableName: "carto-demo-data.demo_tables.populated_places"
      },
      getFillColor: [255, 100, 50],
      pointRadiusMinPixels: 3
    }],
    getTooltip: "@@=object && '<b>' + object.properties.name + '</b>'"
  }
})
```

**Example spec — H3 heatmap from raw points**

For point-source heatmaps and clusters, raw points must be wrapped in `h3QuerySource` (or `quadbinQuerySource`) with SQL that pre-bins the geometry. `HeatmapTileLayer` and `ClusterTileLayer` reject vector sources.

```
view_map({
  deckglProps: {
    initialViewState: { latitude: 54, longitude: -2.5, zoom: 5.5 },
    mapStyle: "https://basemaps.cartocdn.com/gl/positron-gl-style/style.json",
    layers: [{
      "@@type": "HeatmapTileLayer",
      id: "uk-solar",
      data: {
        "@@function": "h3QuerySource",
        connectionName: "carto_dw",
        sqlQuery: "SELECT `carto-un`.carto.H3_FROMGEOGPOINT(geom, 9) AS h3, COUNT(*) AS n FROM `dataset.uk_solar_panels` WHERE geom IS NOT NULL GROUP BY 1",
        aggregationExp: "SUM(n) AS n"
      },
      getWeight: "@@=properties.n",
      radiusPixels: 25,
      colorRange: [[255,255,178,0], [254,217,118,160], [254,178,76,200], [253,141,60,220], [240,59,32,240], [189,0,38,255]]
    }]
  }
})
```

**Tool response structure**

```
{
  "content": [
    {
      "type": "text",
      "text": "Displaying ad-hoc deck.gl visualization on an interactive map."
    }
  ]
}
```

</details>

***

### `load_builder_map`

**Description**

Renders an existing saved CARTO Builder map inline in the chat. Use it in two flows:

* **Preview a map you just created via the CLI.** After `carto maps create` returns a `builderUrl`, ask the agent to "show me that map" and `load_builder_map` renders the result inline without leaving the conversation.
* **View any saved Builder map mid-conversation.** Reference it by URL, by ID, or by name (the agent locates it via [`list_maps`](/carto-for-agents/mcp-server/tools-reference/platform-tools#list_maps) first).

To render an ad-hoc visualization from a deck.gl spec instead, use [`view_map`](#view_map).

For example, the screenshot below was produced by the following prompt:

> *"Render inline existing US Population Map and help me validate it before sending the link to exec by email."*

<figure><img src="/files/ekEFxW314AKyv3nX58pE" alt="load_builder_map rendering a saved Builder map inline in the chat"><figcaption></figcaption></figure>

{% hint style="warning" %}
**`load_builder_map` is a very limited, read-only preview — not the full Builder experience.** The tool renders the saved map's layers, viewport, popups, and legend. Many Builder elements (widgets, SQL parameters, AI Agents, and other interactive panels) are not rendered. When the saved map uses a non-CARTO basemap (Google Photorealistic 3D Tiles, custom Mapbox style, etc.), the renderer falls back to a CARTO basemap. The user must be authenticated and can click "Open in Builder" from the preview for the full experience.
{% endhint %}

**Input properties**

| Parameter | Type   | Required | Description                                                                                                                                                                     |
| --------- | ------ | -------- | ------------------------------------------------------------------------------------------------------------------------------------------------------------------------------- |
| `mapId`   | string | Yes      | UUID of a saved CARTO Builder map (the `mapId` segment of `https://<workspace>.app.carto.com/viewer/<mapId>`). The user must have read access: owned, shared, or marked public. |

**Output**

In MCP hosts that support [MCP Apps](https://modelcontextprotocol.io/specification/2025-06-18/server/utilities/apps), the saved map renders inline. In hosts that don't, the tool returns a text confirmation.

**Example**

*"Show me the retail stores map"*

The agent first calls `list_maps` with a name search, then loads the matching map:

```
list_maps({ search: "retail stores" })
// → returns a map with id "a1b2c3d4-e5f6-..."

load_builder_map({ mapId: "a1b2c3d4-e5f6-7890-abcd-ef1234567890" })
```


# Workflows tools

CARTO Workflows lets your team package data preparation and analytical pipelines as **MCP Tools** that any agent connected to the MCP Server can call. Workflows tools complement the built-in [platform](/carto-for-agents/mcp-server/tools-reference/platform-tools) and [interactive](/carto-for-agents/mcp-server/tools-reference/interactive-tools) tools by exposing organization-specific logic (site selection, trade-area analysis, demand modeling, anything your team has built) in a form an agent can use.

Workflows tools come in two execution modes:

* **Sync**. The tool returns results immediately. Best for lightweight, fast queries.
* **Async**. The tool kicks off a job and returns a `jobId`. The agent then polls [`async_workflow_job_get_status_v1_0_0`](#async_workflow_job_get_status_v1_0_0) until the job is done, and retrieves the output with [`async_workflow_job_get_results_v1_0_0`](#async_workflow_job_get_results_v1_0_0). Best for long-running pipelines.

## Publish your own workflow as an MCP tool

Any workflow your organization builds in CARTO Workflows can be exposed as an MCP tool by adding the descriptions, inputs, and outputs that the MCP specification expects. For step-by-step guidance, see the [**Workflows as MCP Tools**](/carto-user-manual/workflows/workflows-as-mcp-tools) documentation in the CARTO User Manual.

### Best practices

To ensure reliable performance and accurate results when exposing Workflows as MCP Tools, consider the following guidelines:

* **Keep tool descriptions clear and specific.** Write concise descriptions that explain what the tool does and when it should be used. This helps the agent choose the right tool.
* **Define inputs precisely.** Use descriptive names and types for all parameters. Avoid ambiguous labels that could confuse the agent.
* **Test workflows thoroughly.** Run workflows manually before exposing them to confirm that the outputs match expectations.
* **Choose the right output mode.** Use **Sync** for lightweight, fast queries; use **Async** for long-running processes.
* **Version and update carefully.** When making changes to workflows, sync updates promptly and communicate changes to relevant users of the MCP Server.
* **Monitor usage and errors.** Track how tools are used and review errors to refine workflows or adjust descriptions as needed.

{% hint style="info" %}
With **Async** mode, the agent must poll for status and make an additional call to retrieve results when the job completes. Implementing this control flow in your agent's prompt may require additional work.
{% endhint %}

***

## Async job tools

The two tools below are how the agent drives an async workflow once it has been launched. They are built in to every MCP Server. You don't need to configure them.

### `async_workflow_job_get_status_v1_0_0`

**Description**

Gets the status of an async workflow job. Use this after calling an async workflow tool that returns a job ID. Poll this tool until the job status is `success` or `failure`.

**Input properties**

| Parameter        | Type   | Required | Description                                                                        |
| ---------------- | ------ | -------- | ---------------------------------------------------------------------------------- |
| `jobId`          | string | Yes      | The ID of the async workflow job (returned by the workflow tool that launched it). |
| `connectionName` | string | Yes      | The name of the connection used by the workflow.                                   |

**Output**

A JSON object containing the job status and metadata. Possible `status` values: `pending`, `running`, `success`, `failure`, `cancelled`.

<details>

<summary>Response example</summary>

```
{
  "status": 200,
  "data": {
    "jobId": "abc-123",
    "connectionName": "carto_dw",
    "providerId": "bigquery",
    "status": "running",
    "error": null,
    "createdAt": "2024-06-20T14:30:00.000Z"
  }
}
```

</details>

**Example**

After launching an async workflow that returned `jobId: "abc-123"`:

```
async_workflow_job_get_status_v1_0_0({
  jobId: "abc-123",
  connectionName: "carto_dw"
})
```

***

### `async_workflow_job_get_results_v1_0_0`

**Description**

Retrieves the results of an async workflow job after it has completed with `success` status. Call this only after [`async_workflow_job_get_status_v1_0_0`](#async_workflow_job_get_status_v1_0_0) confirms the job is done.

**Input properties**

| Parameter                 | Type   | Required | Description                                                                                                   |
| ------------------------- | ------ | -------- | ------------------------------------------------------------------------------------------------------------- |
| `jobId`                   | string | Yes      | The ID of the async workflow job.                                                                             |
| `providerId`              | string | Yes      | The data warehouse provider. One of: `bigquery`, `snowflake`, `databricks`, `postgres`, `redshift`, `oracle`. |
| `connectionName`          | string | Yes      | The name of the connection used by the workflow.                                                              |
| `workflowOutputTableName` | string | Yes      | The fully qualified name of the workflow output table.                                                        |

**Output**

A JSON object containing the query results from the workflow output table. The `rows` array contains the actual data, and `schema` describes the column types.

<details>

<summary>Response structure</summary>

```
{
  "status": 200,
  "data": {
    "rows": [
      {
        "store_id": 1,
        "name": "Madrid Centro",
        "trade_area_geom": "POLYGON((-3.71 40.41, ...))",
        "drive_time_min": 10
      },
      {
        "store_id": 2,
        "name": "Madrid Norte",
        "trade_area_geom": "POLYGON((-3.69 40.48, ...))",
        "drive_time_min": 10
      }
    ],
    "schema": [
      { "name": "store_id", "type": "INT64" },
      { "name": "name", "type": "STRING" },
      { "name": "trade_area_geom", "type": "GEOGRAPHY" },
      { "name": "drive_time_min", "type": "INT64" }
    ]
  }
}
```

</details>

**Example**

After confirming the job completed successfully:

```
async_workflow_job_get_results_v1_0_0({
  jobId: "abc-123",
  providerId: "bigquery",
  connectionName: "carto_dw",
  workflowOutputTableName: "my_project.results.trade_areas"
})
```


# CARTO Agent Skills

**CARTO Agent Skills** is a public catalog of short, on-demand playbooks that teach AI coding tools (Claude Code, Skills CLI, Codex, Gemini CLI) how to drive the CARTO platform fluently. The repository is at [`CartoDB/agent-skills`](https://github.com/CartoDB/agent-skills) on GitHub.

## Why agent skills?

Generic LLMs know *about* CARTO but make small mistakes when actually driving it: wrong CLI flags, outdated SQL dialects, missing async-job handling, the wrong import shape for a tileset. Each skill in the catalog is a focused playbook the agent loads on demand when a user's request matches the skill's domain, so the agent ships idiomatic, working CARTO output the first time.

Skills run **locally** inside your AI agent. When a skill is triggered, the agent reads the skill's instructions and uses the [CARTO CLI](/carto-for-agents/cli) on your machine to act on your behalf. It authenticates with your local CARTO profile and operates against the warehouses you've already connected. No data leaves your environment via the skills repository. Everything flows through the CARTO CLI you control.

## Three tiers

The catalog is organized in three layered tiers. An agent routes to the right skill automatically based on user intent.

* **Utility**. Foundational CARTO primitives (install, auth, query, explore). Loaded by other skills as a shared base.
* **Platform**. CARTO product surfaces (workflows, builder maps, imports, data observatory, org admin). Build on the utility tier.
* **Use-case patterns**. Recipe skills that compose platform skills into end-to-end spatial analyses (hotspot analysis, site selection, trade areas, GWR). Each carries trigger keywords so the agent routes on user intent.

For the full catalog with descriptions and trigger keywords, see [Skills catalog](/carto-for-agents/agent-skills/skills-catalog). For the layering rationale, see [`ARCHITECTURE.md`](https://github.com/CartoDB/agent-skills/blob/master/ARCHITECTURE.md) in the repo.

## Supported AI clients

Skills ship to four AI agent harnesses, all from the same upstream catalog:

* **Claude Code**. Installed as a marketplace plugin (`carto-skills@agent-skills`).
* **Skills CLI**. Installed via `npx skills add CartoDB/agent-skills`.
* **Codex**. Installed via the Codex plugin manifest at `.codex-plugin/plugin.json`.
* **Gemini CLI**. Installed via the Gemini extension manifest, exposing each skill as a `/carto:<skill-name>` slash command.

For step-by-step install instructions per harness, see [Installation](/carto-for-agents/agent-skills/installation).

## How it composes with the rest of CARTO for Agents

* The skills **drive the** [**CARTO CLI**](/carto-for-agents/cli) on your machine. The CLI is a hard prerequisite. Install and authenticate it before installing the skills bundle.
* The skills are independent of the [CARTO MCP Server](/carto-for-agents/mcp-server). The MCP Server is for web and desktop AI clients. The skills are for AI coding tools that work locally with the CLI; today there are install paths for Claude Code, Skills CLI, Codex, and Gemini CLI.
* As you publish workflows as MCP tools, the same workflows are usable through the MCP server. The skills focus on the CLI surface area.

## Source of truth

This documentation summarizes the catalog as it ships today. The canonical, always-up-to-date source is the public repo at [`CartoDB/agent-skills`](https://github.com/CartoDB/agent-skills), specifically `skills/catalog.json`, which lists every shipped skill, its tier, its dependencies, and its description.


# Installation

CARTO Agent Skills are distributed from the public repo at [`CartoDB/agent-skills`](https://github.com/CartoDB/agent-skills). Each supported AI harness installs them differently, but they all read the same upstream catalog.

## Prerequisites

Before installing the skills, every harness needs:

* A [**CARTO account**](https://carto.com/signup) with workspace access.
* **Node.js 18+** and the [**CARTO CLI**](/carto-for-agents/cli) installed and authenticated:

  ```bash
  npm install -g @carto/carto-cli
  carto auth login
  carto auth status      # confirm: ✓ Authenticated
  ```
* One of the four supported AI agent harnesses (below).

The `carto-basics` skill walks first-time users through CLI install, login, and profile setup.

## Claude Code

Install via the Claude Code plugin marketplace:

```
/plugin marketplace add CartoDB/agent-skills
/plugin install carto-skills@agent-skills
```

All skills ship together as a single bundle (`carto-skills`). Once installed, Claude Code routes to individual skills automatically based on the user's request — there's nothing additional to invoke.

## Skills CLI

```bash
npx skills add CartoDB/agent-skills
```

The Skills CLI reads `skills/catalog.json` from the repo and registers each skill independently. Useful when you want to install a subset.

## Codex

The Codex plugin manifest is at [`.codex-plugin/plugin.json`](https://github.com/CartoDB/agent-skills/blob/master/.codex-plugin/plugin.json) in the repo. Install it with your Codex client's extension command (refer to your Codex version's docs for the exact verb).

## Gemini CLI

The Gemini extension manifest is at [`gemini-extension.json`](https://github.com/CartoDB/agent-skills/blob/master/gemini-extension.json), with one command per skill under [`commands/carto/`](https://github.com/CartoDB/agent-skills/tree/master/commands/carto). After install, invoke a skill via `/carto:<skill-name>` — for example `/carto:carto-basics`.

## Upgrading

Skills ship continuously from upstream `master`. Re-install or refresh through your harness to pull the latest catalog. The catalog version is tracked in [`skills/catalog.json`](https://github.com/CartoDB/agent-skills/blob/master/skills/catalog.json) at the repo root.

## Verify the install

Once installed, ask your agent something CARTO-specific that maps to a skill — for example:

> "List my CARTO maps."
>
> "Connect to my BigQuery warehouse called `analytics` and show me the available tables."
>
> "Run a hotspot analysis on the `crashes_2024` table."

If the skills are installed correctly, the agent will route to the appropriate skill (`carto-basics`, `carto-explore-datawarehouse`, `carto-hotspot-analysis`, …), follow the skill's playbook, and drive the CARTO CLI on your behalf.


# Skills catalog

The CARTO Agent Skills catalog ships **23 skills** organized in three tiers. The list below is a snapshot; the canonical, always-up-to-date catalog is [`skills/catalog.json`](https://github.com/CartoDB/agent-skills/blob/master/skills/catalog.json) in the public repo.

## Utility tier

Foundational CARTO primitives. No dependencies; loaded by other skills as a shared base.

| Skill                                                                                                                   | Description                                                                                                                     |
| ----------------------------------------------------------------------------------------------------------------------- | ------------------------------------------------------------------------------------------------------------------------------- |
| [`carto-basics`](https://github.com/CartoDB/agent-skills/tree/master/skills/carto-basics)                               | Start here for first-time CARTO CLI use: install, authenticate, switch profiles, understand JSON output and async job patterns. |
| [`carto-connect-datawarehouse`](https://github.com/CartoDB/agent-skills/tree/master/skills/carto-connect-datawarehouse) | Choose and configure the data warehouse engine connection (BigQuery, Snowflake, Redshift, Postgres, Databricks).                |
| [`carto-query-datawarehouse`](https://github.com/CartoDB/agent-skills/tree/master/skills/carto-query-datawarehouse)     | Write spatial SQL against the connected warehouse engine, with dialect-specific guidance and performance defaults.              |
| [`carto-explore-datawarehouse`](https://github.com/CartoDB/agent-skills/tree/master/skills/carto-explore-datawarehouse) | Discover what's in the connected warehouse: schemas, tables, columns, named sources.                                            |

## Platform tier

CARTO product surfaces. Depend only on utility skills.

| Skill                                                                                                               | Description                                                                                                                                                                                                                                                                                       |
| ------------------------------------------------------------------------------------------------------------------- | ------------------------------------------------------------------------------------------------------------------------------------------------------------------------------------------------------------------------------------------------------------------------------------------------- |
| [`carto-import-export-data`](https://github.com/CartoDB/agent-skills/tree/master/skills/carto-import-export-data)   | Import geospatial files into the data warehouse via CARTO, export results back out, and prepare tilesets for fast map rendering.                                                                                                                                                                  |
| [`carto-create-workflow`](https://github.com/CartoDB/agent-skills/tree/master/skills/carto-create-workflow)         | Build, schedule, and operate analytics DAGs in CARTO Workflows — the no-code/low-code orchestration layer over the data warehouse. Triggers when the user wants to author a workflow, run/edit one, or schedule a DAG.                                                                            |
| [`carto-find-spatial-data`](https://github.com/CartoDB/agent-skills/tree/master/skills/carto-find-spatial-data)     | Discover and subscribe to external spatial datasets via CARTO Data Observatory and partner catalogs.                                                                                                                                                                                              |
| [`carto-manage-platform`](https://github.com/CartoDB/agent-skills/tree/master/skills/carto-manage-platform)         | Administer the CARTO org — users, roles, quotas, activity audit, and bulk resource operations.                                                                                                                                                                                                    |
| [`carto-create-builder-maps`](https://github.com/CartoDB/agent-skills/tree/master/skills/carto-create-builder-maps) | Author maps in CARTO Builder via the CLI: layers, basemaps, styling, sharing, and AI Agents.                                                                                                                                                                                                      |
| [`carto-render-inline-map`](https://github.com/CartoDB/agent-skills/tree/master/skills/carto-render-inline-map)     | Render an ad-hoc interactive map inline in the chat from a deck.gl declarative spec via the CARTO MCP Server's `view_map` tool. For exploratory / throwaway visualizations; triggers on "show me X on a map", "visualize Y", "make a heatmap of Z".                                               |
| [`carto-preview-builder-map`](https://github.com/CartoDB/agent-skills/tree/master/skills/carto-preview-builder-map) | Preview an existing saved CARTO Builder map inline in the chat via the CARTO MCP Server's `load_builder_map` tool. Resolves URL / ID / name (via `list_maps`), renders a lightweight read-only preview. Triggers on "show me the X map", "open the Y map", and post-CLI-creation inline previews. |
| [`carto-develop-app`](https://github.com/CartoDB/agent-skills/tree/master/skills/carto-develop-app)                 | Generate a working geospatial application powered by CARTO and deck.gl: basemap, layers (vector / H3 / quadbin / raster), widgets, filters, legend, inputs, optional chat-with-map agent, and the right auth strategy (public token, OAuth, SSO, or M2M).                                         |

## Use-case tier

Recipe skills that compose platform skills into end-to-end spatial analyses. Each carries trigger keywords so the agent routes on user intent.

| Skill                                                                                                                       | Description & triggers                                                                                                                                                                                                                                                                                                                                                                                                                                                                                                                              |
| --------------------------------------------------------------------------------------------------------------------------- | --------------------------------------------------------------------------------------------------------------------------------------------------------------------------------------------------------------------------------------------------------------------------------------------------------------------------------------------------------------------------------------------------------------------------------------------------------------------------------------------------------------------------------------------------- |
| [`carto-hotspot-analysis`](https://github.com/CartoDB/agent-skills/tree/master/skills/carto-hotspot-analysis)               | Builds Getis-Ord Gi\* hotspot analysis workflows. Triggers on: hotspots, coldspots, spatial clusters, Getis-Ord, Gi\*, cluster detection, concentration areas, spacetime hotspot, temporal clusters, time-varying patterns, hotspot trends, emerging hotspots, Mann-Kendall.                                                                                                                                                                                                                                                                        |
| [`carto-spatial-autocorrelation`](https://github.com/CartoDB/agent-skills/tree/master/skills/carto-spatial-autocorrelation) | Builds Moran's I spatial autocorrelation workflows. Triggers on: spatial autocorrelation, Moran's I, spatial dependency, HH/HL/LH/LL quadrants, LISA, spatial weight matrix, classifying locations into cluster types.                                                                                                                                                                                                                                                                                                                              |
| [`carto-gwr`](https://github.com/CartoDB/agent-skills/tree/master/skills/carto-gwr)                                         | Builds Geographically Weighted Regression (GWR) workflows. Triggers on: GWR, geographically weighted regression, spatially varying relationships, local regression, local coefficients, spatial non-stationarity.                                                                                                                                                                                                                                                                                                                                   |
| [`carto-spatial-enrichment`](https://github.com/CartoDB/agent-skills/tree/master/skills/carto-spatial-enrichment)           | Spatial enrichment workflows. Triggers on: enrich, add demographics, estimate population around locations, compute spatial features, sociodemographic analysis, trade-area enrichment.                                                                                                                                                                                                                                                                                                                                                              |
| [`carto-trade-area-analysis`](https://github.com/CartoDB/agent-skills/tree/master/skills/carto-trade-area-analysis)         | Trade area and catchment analysis. Triggers on: trade area, catchment area, isochrone, drive time, walk time, billboard placement, OOH audience targeting, scoring candidate locations.                                                                                                                                                                                                                                                                                                                                                             |
| [`carto-site-selection`](https://github.com/CartoDB/agent-skills/tree/master/skills/carto-site-selection)                   | Site selection and cannibalization analysis. Triggers on: site selection, cannibalization, new store location, optimal location, twin areas, look-alike areas.                                                                                                                                                                                                                                                                                                                                                                                      |
| [`carto-territory-planning`](https://github.com/CartoDB/agent-skills/tree/master/skills/carto-territory-planning)           | Territory planning combining territory balancing and location allocation. Triggers on: sales territories, service zones, balanced territories, location allocation, depot/hub placement, response-time optimization, demand coverage.                                                                                                                                                                                                                                                                                                               |
| [`carto-routing-od-analysis`](https://github.com/CartoDB/agent-skills/tree/master/skills/carto-routing-od-analysis)         | Routing and origin-destination analysis. Triggers on: routing, travel time, OD matrix, isoline, isochrone, catchment area, drive-time polygon, accessibility analysis, commute patterns, OD flow, shortest-path computation.                                                                                                                                                                                                                                                                                                                        |
| [`carto-geocoding`](https://github.com/CartoDB/agent-skills/tree/master/skills/carto-geocoding)                             | Geocoding workflows that convert addresses or place names into coordinates. Triggers when the user has tabular data with addresses but no geometry column.                                                                                                                                                                                                                                                                                                                                                                                          |
| [`carto-composite-scoring`](https://github.com/CartoDB/agent-skills/tree/master/skills/carto-composite-scoring)             | Composite-score workflows. Triggers on: composite scores, indexes, multi-variable rankings, market potential, resilience indexes, risk indexes, weighted scores, PCA, supervised/unsupervised scoring.                                                                                                                                                                                                                                                                                                                                              |
| [`carto-arcgis-migration`](https://github.com/CartoDB/agent-skills/tree/master/skills/carto-arcgis-migration)               | End-to-end ArcGIS Portal / AGOL to CARTO migration. Three phases over a shared `MIGRATION_MANIFEST.md`: discover (enumerate and classify items), migrate-data (Hosted Feature Layers / Tables → CARTO tables), migrate-maps (Web Maps and simple Dashboard / Web Experience / Web Mapping Application entries → CARTO Builder maps). Default mode is batch; migrated maps are tagged `From ArcGIS` and created as private. Triggers when the user wants to migrate ArcGIS content to CARTO, asks "what's in my Portal", or names a Portal/AGOL URL. |

## Dependencies and routing

Use-case skills depend on `carto-create-workflow`. Platform skills depend on the relevant utility skills (e.g. `carto-create-workflow` depends on `carto-basics`, `carto-connect-datawarehouse`, and `carto-query-datawarehouse`; `carto-render-inline-map` and `carto-preview-builder-map` depend only on `carto-basics`). When a use-case skill is triggered, the agent loads it along with its dependency chain.

Routing happens via skill descriptions and trigger keywords (the catalog descriptions above). Phrasing your request with one of the trigger keywords is the most reliable way to route into a specific skill.


# Overview

The CARTO Workspace is the user interface for our next generation cloud-native Location Intelligence platform. It allows you to create stunning maps and perform spatial analytics at scale, with everything running directly on top of your cloud data warehouse(s). Learn how to make the most out of our Builder tool, Analytics Toolbox, Data Observatory, and other new features.

<figure><img src="/files/L0mhgtz64O6OBHK1ZMDM" alt="Screenshot of the CARTO Workspace showing onboarding materials"><figcaption></figcaption></figure>

Check out the following pages for setting up your organization, getting acclimated to the workspace, and creating your first map:

* [CARTO Workspace overview](/carto-user-manual/overview/carto-workspace-overview)
* [Creating your first map](/getting-started/quickstart-guides/creating-your-first-map)


# Creating your CARTO organization

In this guide, we'll walk through the process of creating your first CARTO organization. This will be the first step to start creating stunning maps and perform spatial analytics at scale, with everything running directly on top of your cloud data warehouse.

1. **Account sign up**
   * Go to the [CARTO Sign up](http://app.carto.com/signup) page.
   * Enter your email address and password. You can also sign up with your existing Google account by clicking *Continue with Google*.
   * Follow the steps to verify your email and continue with your new organization setup.

<figure><img src="/files/xEK4YUj8vUKnZtuwUQPW" alt=""><figcaption></figcaption></figure>

2. **Organization setup**

If your email domain is already associated with an existing CARTO organization, you will be able to join (or request to join) any of the existing organizations associated with that domain. Alternatively, you will be able to create a brand new organization.

<figure><img src="/files/yv89qxLrL7DEjbLECOtT" alt=""><figcaption></figcaption></figure>

For new organizations, you will need to choose an organization name (e.g. CARTO) and a **deployment region**. As a rule of thumb, you should choose the region closest to your data warehouse. For more information, check our article on [deployment regions](/carto-user-manual/overview/carto-cloud-regions).

After finishing the form, click "Let's get started with CARTO!" to complete the sign up process and get access to the CARTO Workspace. By signing up you accept the [Terms and conditions of the Services](https://carto.com/legal/) and the [privacy notice](https://carto.com/privacy/).

You are ready to start using CARTO!


# CARTO Cloud Regions

For new CARTO [**cloud deployments**](/faqs/deployment-options), users can choose between four different regions. These correspond to four separate CARTO tenants, each located in a different geographical location:

* United States East
* Europe West (located in the EU)
* Asia Northeast (located in Japan)
* Australia Southeast

<figure><img src="/files/qJeSKFydGDi9fkIlM9Dk" alt=""><figcaption></figcaption></figure>

These tenants are fully managed CARTO deployments that we host on our own cloud (on the Google Cloud Platform). We manage configuration, updates, and versioning. Changes to CARTO are pushed simultaneously to these four tenants, so they are functionally equivalent.

All your organization’s data such as maps, workflows, applications, etc; will be stored in the selected region. In addition, the [CARTO Data Warehouse](/carto-user-manual/connections/carto-data-warehouse) of your organization will be located in that region as well.

### Choosing a region

There are a two main considerations when choosing a region:

* Proximity to your data
* Compliance and data regulations

Ideally, you should choose the region that is closest to your data to reduce latency and improve performance. For example, if you’re planning to connect CARTO to your Google BigQuery or Snowflake data in any US region, we recommend you choose the CARTO US region for optimal performance.

Some organizations might also have to choose a region that complies with specific data protection and privacy regulations, such as GDPR in the EU.

For additional help, you can use [**Google Cloud's Region Picker**](https://googlecloudplatform.github.io/region-picker/) to help you select a cloud region.

### Checking my organization's region

The region of your organization is visible from the admin panel in the [Organization Settings](/carto-user-manual/settings).

<figure><img src="https://lh7-us.googleusercontent.com/2V5JeQ-3svQAJmb1d-hsLuu8tAJL4m1c36rJ5WygAi6PBSsbQ5qn4ZP9yTUOI6PnVjNSXL6WY6Zfa7CTfovApOgkwpny9QWoUzFAu1suTQdwf1JOBqI0OBL59FAPdluAJPhH8klnbFosO4TW8vpCEFU" alt=""><figcaption></figcaption></figure>

If you're not an admin, you can still check your organization's region by looking at the URL:

* *clausa* stands for United States East
* *pinea* for Europe West
* *thunbergii* for Asia Northeast
* *radiata* for Australia Southeast\
  \
  \\


# CARTO Workspace overview

Learn everything you need to know about your Workspace and how to make the most out of it.

When you log in to your CARTO user account, you will be presented with your Workspace. The Workspace allows you to access all components of the CARTO platform via a single interface. It will allow you to manage connections to your data warehouse(s), explore your data, subscribe to Data Observatory datasets, develop spatial applications, and run visualizations and spatial analysis through our tools Builder and Workflows.

## **Homepage**

The first time that you access the Workspace, you will see a *Welcome* banner with links providing quick access to different actions to get you started with CARTO, like creating your first connection or your first map and workflow, or starting with your spatial analysis in an easy guided way from our editable pre-built demo maps and demo workflows.

<figure><img src="/files/6zgwsxidjBgQOG9F2Q3s" alt=""><figcaption></figcaption></figure>

From the **“Connect your data warehouse”** banner, you can easily connect your data warehouse(s) to start using CARTO by clicking on *Create new connection* button. Check the quick guides to [connect data](/getting-started/quickstart-guides/connecting-to-your-data) and [creating your first map](/getting-started/quickstart-guides/creating-your-first-map) to get started.

After creating your connection, you can also **upload local files** right from the homepage by clicking on *Import your data* button. Check this [guide](/carto-user-manual/data-explorer/importing-data) to start importing your data into your data warehouse.

From the **“What's new”** section, you will find announcements of new features, interesting articles, and the latest news related to CARTO from our blog. Stay tuned and don’t miss out on the latest news!

<figure><img src="/files/QycYlNE0ZkV6bymLb3Fs" alt=""><figcaption></figcaption></figure>

## **Getting started**

In this section you have a checklist with five quick steps to guide you to the different content pieces to help you get started with CARTO. Once you have completed all the steps, it will be marked as completed and you can close the panel by clicking on *Close*. If you want to skip the steps, just click on *I´m ready, skip onboarding* to close the panel.

<figure><img src="/files/kSOQ7r8aB4J0EA0gyR8W" alt="" width="375"><figcaption></figcaption></figure>

## **Help sidebar**

The help sidebar is always available, including when you're creating Maps and Workflows. It contains:

* An **AI-powered search bar**, similar to the one you can use in this documentation. Ask anything about CARTO and get quick answers, pointing in the right direction and including a link to this documentation.
* Relevant links to our [What's new](/whats-new) section, the [CARTO Academy](https://academy.carto.com), and the [CARTO Support ](/faqs/support-packages)team.

<figure><img src="/files/ULo5H6bYbKubIsi99oVe" alt=""><figcaption></figcaption></figure>

## **Recent projects**

View your latest [projects](/carto-user-manual/projects). This module displays the projects you have worked on most recently, so you can jump straight back into them, and shows how many items each one holds. Click *View all* to open the full Projects section.

<figure><img src="/files/Sh34jTVh9xSkh6lYgzku" alt=""><figcaption></figcaption></figure>

## **Recent maps**

View your latest content. This module displays the latest maps that you have been working on, so that you can quickly access and continue working on them.

<figure><img src="/files/GeCegUA1ExsYfydsClFO" alt=""><figcaption></figcaption></figure>

If you are the owner of the map, you will have access to the quick actions menu to manage your map by clicking on the three dot icon of the map card. There are 4 options available: Edit map properties, [Share](/carto-user-manual/maps/sharing-and-collaboration), [Duplicating maps](/carto-user-manual/maps/managing-maps#duplicating-maps) and [Delete](/carto-user-manual/maps/managing-maps#deleting-maps).

<figure><img src="/files/N49S3p0XdRm5YsAJ2yOd" alt="" width="337"><figcaption></figcaption></figure>

## **Recent workflows**

View your latest accessed workflows. This module displays the latest workflows that you have been working on, so that you can quickly access and continue working on them.

<figure><img src="/files/acRpyQsid3gdyGPmU3Tr" alt=""><figcaption></figcaption></figure>

## **Recent datasets**

View your latest datasets for easy access. This module displays the latest datasets that you have been working on, so that you can quickly access and continue working on them.

<figure><img src="/files/aGUhawvS4LGBU7gQDlVx" alt=""><figcaption></figcaption></figure>

## **Navigation Menu**

In the left panel, you can find the *Navigation Menu* with all the available options to access the CARTO components: Home, Maps, Data Explorer, Data Observatory, Connections, Settings, and Developers. In the bottom part of the menu, you have additional options to join the “CARTO Users” Slack channel, send us direct product feedback, or access the Documentation portal.

<figure><img src="/files/XmDJq6JxdQfIXsCiFLQo" alt=""><figcaption></figcaption></figure>


# Projects

Organize your maps and workflows into projects and folders, and manage sharing for everything inside from a single place.

Projects and folders let you organize your maps and workflows into a clear structure instead of a single flat list. A **project** is a top-level container, and a **folder** lives inside a project or another folder. With them you can:

* **Move maps and workflows into them** to keep related work together.
* **Manage sharing from the top.** Share a project or folder once and everything inside it inherits that access, so you set permissions in one place instead of item by item.
* **Add shortcuts** for maps or workflows that need to live in more than one place, or for assets you do not own.

Organize your work however suits you, and nest folders as deep as you need.

<figure><img src="/files/HIOyvpbvkPc1BrBgl67z" alt=""><figcaption><p>The Projects section, with a New project button and one card per project</p></figcaption></figure>

## Creating projects and folders

Projects live in the **Projects** section of the Workspace. Click **New project** and give it a name. Open the project and use the new-folder button to add folders inside it, nesting them as deep as you need.

To start something new right where it belongs, use **New asset** to create a map, workflow, or AI Agent (or a workflow from a template) directly inside a project or folder.

<figure><img src="/files/ndCnWxIJJmwX46LNooHc" alt=""><figcaption><p>Creating a folder inside a project</p></figcaption></figure>

## Organizing your maps and workflows

To bring existing work into a project or folder, move it in. In the Maps or Workflows section, open the three-dot menu on the card and select **Move to**. Pick a destination by switching between your own and others' projects, following the breadcrumb, and drilling into folders; you can also create a new project or folder without leaving the modal. Confirm with **Move here**. The map or workflow now lives in that project or folder and takes on its sharing (see [Sharing projects and folders](#sharing-projects-and-folders)). It lives in one project or folder at a time, and only maps, workflows, folders, and shortcuts can live inside one, so connections, datasets, and other resources stay in their own sections.

The same **Move to** flow relocates a map or workflow between projects and folders, and **Remove from project** (or **Remove from folder**) takes it back out. Moving or removing only changes where a map or workflow lives and the sharing it inherits; it never deletes the map or workflow itself.

<figure><img src="/files/1xj2vvet2pOp1Wlyx5VY" alt=""><figcaption><p>The Move to modal, where you pick the destination project or folder</p></figcaption></figure>

{% hint style="info" %}
Wherever a map or workflow lives, it is always accessible from the **Maps** and **Workflows** sections of your Workspace. Projects and folders organize your content, they do not hide it from those lists.
{% endhint %}

### Shortcuts

Moving is the usual way to place a map or workflow. When the same one needs to appear in more than one place, or you want to reference an asset you do not own, add a **shortcut** instead. Open the three-dot menu on the card and select **Create shortcut**. A shortcut is just a pointer: it does not move the original or make a copy.

Shortcuts inherit nothing. The map or workflow a shortcut points to keeps its own sharing, and a shortcut placed inside a shared project does not grant anyone access to it. Deleting a shortcut removes only the pointer, never the original.

<figure><img src="/files/ogvIicpWnjwQaaysrDKV" alt=""><figcaption><p>A project holding a folder and a map</p></figcaption></figure>

## Sharing projects and folders

You share a project or folder the same way you share a single map or workflow: pick a mode (Restricted or Organization) and add the users or groups who should have access. Only the owner can change how a project or folder is shared. See [Sharing and collaboration](/carto-user-manual/maps/sharing-and-collaboration) for maps and [Sharing workflows](/carto-user-manual/workflows/sharing-workflows) for workflows.

When you share a project or folder, everything inside inherits that access, so you set permissions once instead of item by item. Sharing a project covers its folders, maps, and workflows; sharing a folder covers everything in that folder.

<figure><img src="/files/tSbfvbMzyzXgujDtUZtx" alt=""><figcaption><p>Sharing a project. Lower-level folders and content inherit these settings</p></figcaption></figure>

Inheritance is **additive**: a map or workflow keeps its own sharing and gains whatever it inherits from the project or folder above it. A map shared with person X that you move into a folder shared with team Y ends up accessible to both X and Y. In the map or workflow's own Share modal, inherited access is labeled **Access is inherited from an upper level**, so you can tell it apart from access set directly on the asset, and you can still add more people or groups on top.

<figure><img src="/files/IPVINF0idH5Xmf8o8iqo" alt=""><figcaption><p>On a map, access inherited from a parent project or folder is labeled in the Share modal</p></figcaption></figure>

{% hint style="warning" %}
**Shortcuts do not inherit sharing.** A shortcut inside a shared project stays a pointer. The map or workflow it points to keeps its own sharing settings, so someone who can open the project will only be able to open the target through the shortcut if that map or workflow has been shared with them directly.
{% endhint %}

{% hint style="info" %}
Projects and folders can only be Restricted or Organization; they cannot be made public. A map inside a project can still be shared publicly on its own, unless an admin has disabled public map sharing from the [Governance](/carto-user-manual/settings/organization-governance) settings.
{% endhint %}

## Managing projects and folders

From the three-dot menu on a project or folder card, or the header when you are inside it, you can rename it, share it, move a folder into another project or folder, and delete it. Like the Maps and Workflows sections, the Projects section can be shown as a grid or a list, and you can search, sort, and filter by owner.

<figure><img src="/files/fBDrJXSbQ7QTfrreREaL" alt=""><figcaption><p>The project card menu: rename, share, or delete</p></figcaption></figure>

{% hint style="info" %}
**Deleting a project or folder never deletes the maps and workflows inside it.** They stay available from the Maps and Workflows sections and only lose the sharing they inherited from that project or folder. To delete a map or workflow, do it explicitly from its own card.
{% endhint %}

## Managing projects from the CLI

Projects and folders can also be created, browsed, and reorganized programmatically with the CARTO CLI. See the [`projects` command reference](/carto-for-agents/cli/command-reference/projects).


# Maps

The CARTO Workspace includes functionalities for creating and publishing maps in a simple manner, using the CARTO map tool: Builder.

Builder is designed to allow technical and non-technical audiences to visualize, explore, and filter large amount of location data in your browser.

This guide will teach you how to create a map in the CARTO Builder, and perform data analysis by adding data to a map, adding filters, and more.

In the Maps section of the Workspace, you will see the list of your current maps. If you haven’t created a map yet, you will see the following page:

<figure><img src="/files/OYCRjB6gQtIoOkSLMX4L" alt=""><figcaption></figcaption></figure>

To create a new map, click *Create your first map*. This will open the CARTO map tool: Builder.

CARTO Builder contains many features that guide you through the process of creating a map, changing the styling, and selecting how your data appears. Use the following task list as guide for some of the main CARTO Builder features:

* Add your data [guide](/carto-user-manual/maps/data-sources#adding-a-data-source)
* Style your maps [guide](/carto-user-manual/maps/layers)
* Set widgets [guide](/carto-user-manual/maps/widgets)
* Customize your map views [guide](/carto-user-manual/maps/map-view-modes)
* Add SQL parameters [guide](/carto-user-manual/maps/sql-parameters)
* Apply a mask to your map and filter out your data [guide](/carto-user-manual/maps/feature-selection-tool)
* Publish and share your maps [guide](/carto-user-manual/maps/sharing-and-collaboration)


# Data sources

CARTO Builder allows you to add sources by connecting directly with your data warehouses, ensuring security and data governance. Once a source is added, the related layer associated with the source is also rendered on the map. From this point, you can start styling your layer, adding widgets, and creating your interactive application.

## Data sources types

Builder currently support the following data sources types:

* [**Simple features**](/carto-user-manual/maps/data-sources/simple-features): Unaggregated features using standard geometry (point, line or polygon) and attributes, ready to use in Builder.
* [**Spatial Indexes**](/carto-user-manual/maps/data-sources/spatial-indexes): Aggregated data sources for improved performance or specific use cases, including Quadbin and H3 spatial indexes.
* [**Pre-generated tilesets**](/carto-user-manual/maps/data-sources/pre-generated-tilesets)**:** Tilesets pre-generated using CARTO Analytics Toolbox procedures or Workflows and stored directly in your data warehouse, ideal for handling very large, static datasets.
* [**Raster**](/carto-user-manual/maps/data-sources/rasters): A raster source is composed of grids of pixels, where each pixel contains a value representing specific information
* **Sources without an associated layer**: These are data sources added to a map that has not associated layer. They are typically used to power widgets, SQL parameters, or AI Agent&#x73;**,** enabling advanced interactivity and insights without visual clutter. You can add a layer from these sources at any time.

## Methods for adding sources

In Builder, you can add data sources either as table sources by connecting to a materialized table in your data warehouse or through custom SQL queries. These queries execute directly in your data warehouse, fetching the necessary properties for your map.

* **Table sources:** Connect directly to your data warehouse table through the data explorer dialog. Once connected, the data source is added including its related layer.
* **SQL query sources:** Perform a custom SQL query that will act as your input source. Once you execute it, if valid, a new data source and its linked layer will be added to the Builder.

{% hint style="info" %}
**Best practices for SQL Query sources**

SQL Editor is not designed for **conducting complex analysis** or detailed step-by-step geospatial analytics directly, as Builder executes a separate query for each map tiles. For analysis requiring high computational power, we recommend two approaches:

* **Materialization**: Consider materializing the output result of your analysis. This involves saving the query result as a table in your data warehouse and use that output table as the data source in Builder.
* **Workflows**: Use [CARTO Workflows](/carto-user-manual/workflows) for conducting step-by-step analysis. This allows you to process the data in stages and visualize the output results in Builder effectively.
  {% endhint %}

## Adding data sources

To add sources in Builder, click on "Add source from" and choose from the following options:

* [**Data Explorer**](#adding-a-source-from-data-explorer)**:** Browse and add tables as sources from your existing connections.
* [**Custom Query (SQL):**](#adding-a-source-from-a-custom-query-sql) Write your own SQL query using the connection of your choice.
* [**Import file**](#adding-source-by-importing-a-file)**:** Start the process of importing a file to a CARTO connection. You can also **drag and drop** your files directly on Builder to start the import flow.

<figure><img src="/files/mY9EJiGVT7vcKFW5vew2" alt=""><figcaption></figcaption></figure>

{% hint style="info" %}
[Partitioned BigQuery tables](https://cloud.google.com/bigquery/docs/partitioned-tables) require a WHERE clause in the query filtering by the column used for the partition. If you need to load a BigQuery partitioned table in Builder, add it as a SQL Query source like:

```sql
SELECT *
FROM project.dataset.my_partitioned_table
WHERE partition_column = 'value'
```

{% endhint %}

### **Adding a source from Data Explorer**

To add a source, navigate to the desired location, select your table and click 'Add Source'. The source and its associated layer will be added to the map.

<figure><img src="/files/z5bxRPmVn5jw8nJIb4fL" alt=""><figcaption></figcaption></figure>

{% hint style="success" %}
You can star connections, database/projects/schemas and tables to quickly access them later. For more information, see [Starring items for quick access](/carto-user-manual/data-explorer#starring-items-for-quick-access).
{% endhint %}

### **Adding a source from a Custom Query (SQL)**

Use the SQL Editor panel in Biulder to add a source by selecting a specific connection. Create your own SQL queries to perform simple analysis, create WHERE statements to pre-filter your data, or use SQL Parameters. You can also leverage CARTO Analytics Toolbox directly from this interface.

<figure><img src="/files/mDxcgAWgjXb6TNWeFoqf" alt=""><figcaption></figcaption></figure>

### **Adding source by importing a file**

CARTO allows creating tables in your connections by importing files from your computer or via URL. Once a file is imported, the resulting table can be previewed in Data Explorer and used in Builder and external applications.

{% hint style="success" %}
You can also **drag and drop** files directly on Builder to start the import flow.
{% endhint %}

<figure><img src="/files/6QY7f6aBxOFxGfDzuH7B" alt=""><figcaption></figcaption></figure>

{% hint style="info" %}
Find more information about compatible data warehouses, supported formats, column names, and delimiters in our [Importing Data](/carto-user-manual/data-explorer/importing-data) documentation.
{% endhint %}


# Simple features

Builder supports simple features stored as geometry or geography in cloud data warehouses. These simple features are defined as a standard which specifies digital storage of geographical data, usually point, line or polygon, storing both spatial and non-spatial features.

<figure><img src="/files/EvyUIADrqeTHvsaMZQK2" alt=""><figcaption></figcaption></figure>

This table shows the current type of simple features (`geometry` or `geography`) supported on each data warehouse:

|                | **Geography**  | **Geometry**  |
| -------------- | -------------- | ------------- |
| **BigQuery**   | ✅              | Not Supported |
| **CARTO DW**   | ✅              | Not Supported |
| **Redshift**   | Not Supported  | ✅             |
| **Snowflake**  | ✅              | Not Supported |
| **PostgreSQL** | Not Supported  | ✅             |
| **Databricks** | ✅ WKB Binaries | Not Supported |
| **Oracle**     | Not Supported  | ✅             |

{% hint style="info" %}
When working with simple features in Builder, ensure that your spatial column contains only a single type of geometry—either points, lines, or polygons. Mixing different geometry types within the same spatial column is not supported. To handle multiple geometry types, use separate sources for each type.
{% endhint %}

{% hint style="warning" %}
**GEOMETRYCOLLECTION is not supported**

If your data contains GEOMETRYCOLLECTION geometry types, you'll need to convert them to individual geometry components before visualization. Use the ST\_Dump function in your SQL query to explode geometry collections.
{% endhint %}

## Visualizing simple features

Builder ensures performance experience when rendering simple features on a map as data is loaded progressively via vector tiles. The data for these tiles is extracted by pushing down SQL queries to the data warehouse, and they are requested as you zoom in and out or pan the map.

Note these queries in Builder are cached. To understand more how caching works and different methods to keep your data fleshed, check this link in our [documentation](/carto-user-manual/maps/data-sources/managing-data-freshness).

Find more information about performance consideration for this data source type in [this section](/carto-user-manual/maps/performance-considerations).


# Spatial Indexes

The CARTO platform natively supports spatial indexes, enabling you to leverage their capabilities when working with large-scale data directly in your data warehouse. Spatial indexes are excellent for large-scale analytics and visualization. Using Builder, you can create stunning and powerful visualizations by connecting directly to these types of sources. The supported spatial index formats are quadbins and H3.

<figure><img src="/files/ZwJkHPKdxQYcqovJ2g5c" alt=""><figcaption></figcaption></figure>

Based on Discrete Global Grid (DGG) systems, spatial indexes reference each cell of the grid. Think of a spatial index as an id that always makes reference to the same portion of the surface on Earth.

* This portion of the Earth is called a **cell**.
* The shape of the cell depends on the **type of index**. For example, H3 uses hexagons; while Quadbin uses square.
* The size of the cell depends on the **resolution**. The higher the resolution, the smaller the size of the cell.

DGG systems are hierarchical, which means that every cell contains a constant number of smaller cells at a higher resolution:

<figure><img src="/files/mLniJTUzvmYnDBrgv7GU" alt=""><figcaption><p>Example of how each H3 cell is sub-divided into smaller cells at higher resolutions.</p></figcaption></figure>

## Advantages of working with spatial indexes

One of the advantages of working with spatial indexes is that operating with them in data warehouses is way more efficient and cost-effective than computing geometries. They are also smaller in size and help saving storage and reducing the volume of transferred data.

When working with spatial indexes, Builder will dynamically aggregate your data into cells at a meaningful resolution depending on the current map zoom level. See the animation below for an example:

<figure><img src="/files/ZEHqUgJfUC2SGfwjspmJ" alt=""><figcaption></figcaption></figure>

## Visualizing spatial index sources

Your spatial index source must contain a column storing the spatial index identifier. Below is an example table containing h3 indexes, with some additional columns that contain aggregated socio-demographic data for each hexagon:

| h3              | population | avg\_rent |
| --------------- | ---------- | --------- |
| 8a0c0036a49ffff | 103.0      | 1344.56   |
| 8a0c002e4c0ffff | 1093.0     | 2087.04   |
| 8a0c002e4caffff | 209.0      | 3098.39   |

The `h3` column contains the indexes for H3 cells at level 10. That’s what we call the *native resolution of the data*.

When you load a source in Builder, data is aggregated dynamically as you zoom in an out. This aggregation will be generated on the fly, using SQL queries that are pushed from CARTO into the data warehouse.

When visualizing a spatial index source in Builder, you can control the aggregation size, to define how granular you'd like the aggregation to be when navigating through the map as part of the layer styling configuration. Learn more in this section.

To understand more about performance and processing cost optimizations that should be applied to this specific source type, check [this section](/carto-user-manual/maps/performance-considerations).


# Pre-generated tilesets

Pre-generated tilesets are sources with tiles that have been previously generated using either the [CARTO Analytics Toolbox](/data-and-analysis/analytics-toolbox-for-bigquery/key-concepts/tilesets) or [Workflows](/carto-user-manual/workflows/components/tileset-creation). Both the creation and storage of these tilesets occur in the data warehouse. This type of data source is ideal for managing very large, static datasets. They are efficient, cost-effective, and provide high-performance visualization.

<figure><img src="/files/5sJgAfANLLUQ3sLYqfWi" alt=""><figcaption></figcaption></figure>

## Visualizing pre-generated tilesets

Builder supports the visualization of the four types of pre-generated tilesets:

* **Vector Tilesets:** Pre-generated tilesets processed from point, line, or polygon tables for smooth, interactive maps.
* **Point Aggregation Tilesets**: These tilesets aggregate point data with their properties into tilesets, perfect for visualizing dense point clusters.
* **Quadbin Aggregation Tilesets**: Aggregated grid for scallable hierarchy management.
* **H3 Aggregation Tilesets:** Aggregate quadbin indices into tilesets for scallable spatial hierarcy management.

To ensure optimizal visualization and performance, you must make use of the different parameters that allow you to have full-control of the tileset specification. To learn more about this type of source in terms of performance consideration, review this [section](/carto-user-manual/maps/performance-considerations).


# Rasters

Raster data is composed of grids of pixels, where each pixel contains a value representing specific information, such as temperature, elevation, or vegetation indices. These datasets can represent continuous surfaces or sparse data with defined no-data regions. The CARTO platform provides seamless tools for importing, analyzing and visualizing raster sources directly in your data warehouse.

<figure><img src="/files/PEX4dBZGpf3BleQQnz6k" alt=""><figcaption></figcaption></figure>

## Visualizing rasters

To visualize raster sources, they must first be stored in your data warehouse using the **CARTO raster loader**. This tool ensures your raster files are properly uploaded and formatted for seamless integration with the CARTO platform. [Learn more about preparing and uploading your raster data](/carto-user-manual/data-explorer/importing-data/importing-rasters).

To optimize performance, raster sources should include **overviews**—lower-resolution versions of the raster data—enabling efficient visualization at different zoom levels. Additionally, if your raster source contains a **color interpreter** (e.g., palette, grayscale, or RGB), CARTO will automatically apply default styling based on the metadata, making it easier to quickly render the raster on your map.

{% hint style="warning" %}
Note the current limitations and specific requirements for raster sources:

* Raster sources cannot be queried directly through SQL functions, meaning they are not compatible with **SQL Editor** or **SQL Parameters**. This is similar to the behavior of pre-generated tilesets.
* Raster sources are currently supported for **Google BigQuery, Snowflake and Databricks** environments.
  {% endhint %}


# Defining source spatial data

When you add a source, Builder attempts to recognize if there is a spatial definition to render its associated layer. The spatial definition of your source depends on the column storing your spatial data and its specific type. Builder will automatically recognize the spatial data definition when possible. If not, you can manually define your data using the layer panel UI in the data section.

<figure><img src="/files/SWj9f76vhIobXrgbzlF5" alt=""><figcaption></figcaption></figure>

## Automatic definition of spatial data

For Builder to automatically recognize the spatial data definition, regardless of whether the source is a table or an SQL query, your source must contain at least one valid spatial column with its related type as follows:

* **Column storing geometry type**: This column should store either point, line, or polygon geometry in a valid format. The column can have any name.
* **Column storing spatial index ID**: To be recognized by default, the spatial column should follow our naming convention:
  * **H3**: The column must be named `h3`.
  * **Quadbin**: The column must be named `quadbin`.

## Manual definition of spatial data

If Builder cannot automatically recognize a spatial data definition, you can still load it as a source in the map and use the UI to define your spatial column and type. Once your definition is set, you can click "Apply Selection" and Builder will use that definition to render your layer.

<figure><img src="/files/kdO6EqcLJ01CHvRoSUGp" alt=""><figcaption></figcaption></figure>

## Managing multiple spatial columns

If your source contains multiple spatial columns, you can use the UI to decide which specific spatial column and type you want to use to render the layers associated with your source. For example, you might have a column containing the point geometry and additional columns representing the isochrones from that location.

<figure><img src="/files/F9kFk6D2Pftry2P7wAyE" alt=""><figcaption></figcaption></figure>

**Note:** The spatial data definition is set at the source level; therefore, you must ensure consistency in the definition for all layers linked to that source.

{% hint style="warning" %}
**Special considerations**

* The **spatial data** **definition is set at the source level**; therefore, you must ensure consistency in the definition for all layers linked to that source. If you change the definition but there are other layers coming from the same source, a modal will appear notifying you of the components in the map that will be affected if you proceed with the changes.
* Note spatial source definition is not supported for **pre-generated tilesets or raster sources**.
  {% endhint %}


# Managing data freshness

Maintaining accurate analytics in your map visualizations depends greatly on the freshness of your data. This section will delve into how Builder ensures your data remains current and will detail the options you have for refreshing your data sources.

## Caching and data freshness

Builder makes it straightforward to manage data freshness right from the initial map load. Data caching is enabled by default, varying by data type and warehouse provider, but you have the liberty to set specific freshness intervals for your map's data sources.

**Default freshness settings**

* **SQL Query sources:** By default, data is cached for one year across all connections. If your data remains unchanged, it will be automatically refreshed after a year.
* **Table sources:** The duration of data caching varies depending on your data warehouse provider:
  * **BigQuery, Snowflake, and Oracle:** Requests are cached for a minimum of 5 minutes. CARTO continues to serve cached results if the table data hasn't been updated.
  * **Redshift, Databricks, and PostgreSQL:** Requests are cached for 30 minutes.
* **Pre-generated tileset sources:** Data is cached for a year. It's automatically refreshed after this period if unchanged.
* **Raster sources:** Data is cached for a year. It's automatically refreshed after this period if unchanged.

**Customizing data freshness**

Choose from predefined freshness periods for your data sources to ensure maps load with the most current data, providing reliable analytics.

<figure><img src="/files/CSl7d8xjJFsDYNhspA8G" alt=""><figcaption></figcaption></figure>

### How caching works

Caching plays a crucial role in optimizing the performance and responsiveness of your map. Each component, such as a map layer, leverages its own cache to store data essential for its visualization. Here's how it functions:

* **Data Storage**: When you view a layer within a specific map extent, the system caches the data retrieved by that particular query. This means that if you or another user views the same layer with the same map extent again, the system can quickly display the data from the cache without needing to re-fetch it from the data source.
* **Handling Changes**: Any modifications to the viewport extent, adjustments to widget filters, or changes in SQL parameter inputs trigger a new query to the data warehouse for data that hasn't been cached yet. Once this query is executed, its results are stored in the cache for future use.

This caching mechanism ensures efficient data retrieval and visualization, significantly enhancing the user experience by reducing load times and improving the map's overall performance.

<figure><img src="/files/IPmQdVDspyExrNEp4wos" alt=""><figcaption><p>Data freshness example diagram</p></figcaption></figure>

## Refresh data manually

Refreshing your data sources couldn't be simpler. Whether you need to update all sources or just specific ones, Builder's "Refresh" options are designed for efficiency. Initiating a refresh reloads your data sources and their associated layers, clearing any previous cache and sending a new request to your data warehouse. This process guarantees you're always working with the latest data.

<figure><img src="/files/rrMoyGLZcQ1zl683wfWU" alt=""><figcaption></figcaption></figure>

{% hint style="info" %}
**Important consideration**

Manual refreshes will increase the amount of data processed in your data warehouse, which might have a significant cost associated to it.

The cached objects associated to the data source will be invalidated, and the SQL queries that were executed to generate them will be executed again.
{% endhint %}


# Changing data source location

Builder now enables you to modify the location or connection of your data sources easily using the 'Change data source’ option available in the source card. This functionality ensures that map configurations remain consistent as long as the updated data sources maintain the same field names and types. For any components where a property cannot be identified, the map component will revert to its default settings.

<figure><img src="/files/Il4DnVVHDnwn1uqSigq6" alt=""><figcaption></figcaption></figure>

### **How to change the source location and/or connection**

* **Table Data Sources**:
  * Navigate to the **source card panel** and click on the **three dots menu**.
  * Select the **‘Change data source’** option and locate the new data source.
  * Once the new dataset is identified, click 'Change source'.
* **SQL Query Data Sources**:
  * Access the **three dots menu** in the **source card panel** to update the connection.
  * Alternatively, in the **SQL Editor panel**, click on the connection information in the top-right corner to modify it.
  * Select your desired connection and click **‘Change Source’**.

<figure><img src="/files/ZaE59CGiZ0QUrbWufml2" alt=""><figcaption></figcaption></figure>

### **Impact of changing data source**

If the new data source contains the same fields with matching names and types, the map will retain its existing configuration, and no changes are expected. However, if some properties used in the map are missing in the updated data source, the following behavior should be expected:

**Styling and Interactions:**

* If a property used in interactions (e.g., hover or click actions) is missing in the new data source, those interactions will be removed.
* If a property used for layer styling (e.g., coloring by a column) is no longer available, the layer will revert to the **default style.**

**Widgets:**

* Widgets linked to missing properties will remain visible, and their configurations will be preserved.
* As an Editor, you can manually select a new column from the dropdown menu in the widget configuration panel or remove the widget entirely if no replacement column exists.

**SQL Parameters:**

* The updated connection must have access to the tables referred to in your custom SQL query. If not, you’ll need to update the query to refer to the relevant table locations.
* For SQL Parameters, ensure that the updated query is still valid so that parameter controls continue to work as expected.


# Table and column capitalization

When working with CARTO, how your table and column names are handled depends on two factors: your data warehouse provider and how you access the data.

## How you access data matters

| Access method                                                      | How identifiers are handled                                                      |
| ------------------------------------------------------------------ | -------------------------------------------------------------------------------- |
| **Table sources** (Data Explorer, Builder table source, Workflows) | CARTO handles quoting automatically, but has limitations with non-standard names |
| **SQL Query sources** (Builder SQL editor)                         | You control quoting — full flexibility but requires knowledge of provider rules  |

## Provider-specific rules

Each data warehouse treats unquoted identifiers differently:

| Provider       | Default behavior           | Quote character     |
| -------------- | -------------------------- | ------------------- |
| **BigQuery**   | Case-sensitive (unchanged) | `` ` `` (backticks) |
| **Snowflake**  | Converted to UPPERCASE     | `"` (double quotes) |
| **PostgreSQL** | Converted to lowercase     | `"` (double quotes) |
| **Redshift**   | Converted to lowercase     | `"` (double quotes) |
| **Databricks** | Case-insensitive           | `` ` `` (backticks) |
| **Oracle**     | Converted to UPPERCASE     | `"` (double quotes) |

## Known limitations with table sources

When loading **tables** in Data Explorer, Builder (table source), or Workflows, certain column naming patterns are not fully supported.

### **Unsupported patterns**

| Provider          | Unsupported pattern                          | Example                   | Workaround                                           |
| ----------------- | -------------------------------------------- | ------------------------- | ---------------------------------------------------- |
| **Snowflake**     | Lowercase column names (created with quotes) | `"myColumn"`, `"revenue"` | Use SQL Query source, or rename columns to UPPERCASE |
| **Oracle**        | Lowercase column names (created with quotes) | `"myColumn"`, `"revenue"` | Use SQL Query source, or rename columns to UPPERCASE |
| **PostgreSQL**    | Uppercase column names (created with quotes) | `"MyColumn"`, `"Revenue"` | Use SQL Query source, or rename columns to lowercase |
| **All providers** | Columns with special characters              | `my-column`, `my column`  | Use SQL Query source, or rename columns              |
| **All providers** | SQL reserved words as column names           | `select`, `from`, `where` | Use SQL Query source, or rename columns              |

{% hint style="warning" %}
**Why this happens:** When you create a column with quotes in your warehouse (e.g., `"myColumn"` in Snowflake), the warehouse preserves that exact casing. However, when CARTO builds queries for table sources, it may not apply the required quoting for these edge cases.
{% endhint %}

## Using SQL Query sources

SQL Query sources give you full control over identifier quoting. Use the appropriate quote character for your warehouse:

### Snowflake

Double quotes preserve lowercase or mixed case:

```sql
SELECT "myColumn", "Revenue_2024" FROM "MySchema"."SalesData"
```

### PostgreSQL and Redshift

Double quotes preserve uppercase or mixed case:

```sql
SELECT "MyColumn", "Revenue_2024" FROM "public"."SalesData"
```

### BigQuery

Backticks for all identifiers; case is always preserved:

```sql
SELECT myColumn, Revenue_2024 FROM `project.dataset.SalesData`
```

### Databricks

Backticks for special characters; case doesn't matter:

```sql
SELECT myColumn FROM `my-catalog`.schema.sales_data
```

### Oracle

Double quotes preserve lowercase or mixed case:

```sql
SELECT "myColumn", "Revenue_2024" FROM SCHEMA_NAME."SalesData"
```

## Best practices

To ensure compatibility across all CARTO features, use naming conventions that match your provider's default behavior:

{% hint style="info" %}
**Recommended naming conventions**
{% endhint %}

| Provider                  | Recommended naming                    |
| ------------------------- | ------------------------------------- |
| **Snowflake**             | `UPPERCASE` or `UPPER_SNAKE_CASE`     |
| **PostgreSQL / Redshift** | `lowercase` or `snake_case`           |
| **BigQuery**              | Any consistent style (case-sensitive) |
| **Databricks**            | Any style (`snake_case` recommended)  |
| **Oracle**                | `UPPERCASE` or `UPPER_SNAKE_CASE`     |

**General guidelines:**

* Use `snake_case` with letters matching your provider's default (uppercase for Snowflake and Oracle, lowercase for PostgreSQL)
* Avoid spaces, hyphens, and special characters in names
* Avoid SQL reserved words (`select`, `from`, `where`, `order`, `group`, etc.)
* If you must use non-standard names, access the data via SQL Query source

## Troubleshooting

| Error                                                 | Likely cause                                          | Solution                                               |
| ----------------------------------------------------- | ----------------------------------------------------- | ------------------------------------------------------ |
| "Column not found" in Snowflake                       | Column was created with lowercase (quoted)            | Use SQL Query source with proper quoting: `"myColumn"` |
| "Column does not exist" in PostgreSQL                 | Column was created with uppercase (quoted)            | Use SQL Query source with proper quoting: `"MyColumn"` |
| "ORA-00904: invalid identifier" in Oracle             | Column was created with lowercase (quoted)            | Use SQL Query source with proper quoting: `"myColumn"` |
| Table loads but some columns missing                  | Column names use reserved words or special characters | Use SQL Query source                                   |
| Works in warehouse console, fails in CARTO table view | Non-standard identifier naming                        | Use SQL Query source instead                           |


# Layers

Layers in Builder are connected to data sources and are used to render features on a map by directly connecting to your data warehouse. Once a data source is added to Builder, a layer is automatically added for that data source. If the spatial definition is valid, the features will be rendered on the map. Learn more about defining source spatial data in this [section](/carto-user-manual/maps/data-sources/defining-source-spatial-data).

## Layer options

When working with layers in Builder, you have the following options:

* **Zoom to:** Zoom to the layer extent, taking into account any filtering applied in Widgets and/or Parameters when applicable.
* **Show only this/Show all layers:** Easily set layers visibility on and off.
* **Layer style:** Access the layer panel to set your layer styling configuration.
* **Duplicate layer**: Duplicate a layer with the same styling properties.
* **Rename:** Edit the name of your layer.
* **Delete**: Remove the layer and its corresponding source.

## Layer groups

When a map has many layers, you can organize them into named, collapsible **groups**. Groups appear in both places your layers show up, the **layer panel** while you build and the **legend** your viewers see, so the same structure keeps a busy map readable on both sides. Grouping is an organizational tool, so it never changes your data or how individual features are styled.

<figure><img src="/files/hHoqFClcMxWsfUEjP4bZ" alt=""><figcaption></figcaption></figure>

### Creating and managing groups <a href="#creating-and-managing-groups" id="creating-and-managing-groups"></a>

From the layer panel you can:

* **Create group:** Open the add menu in the layer panel and choose **Create group** to add a new group. New groups get a default name that you can edit at any time.
* **Add to group / Move to group:** From a layer's options menu, choose **Add to group** to place it in an existing group, or drag the layer onto the group. Use **Move to group** to send a grouped layer to a different group.
* **Remove from group:** Return a layer to the top level of the layer list.
* **Rename:** Click the group name to edit it.
* **Expand / Collapse:** Fold a group to tuck its layers away in the panel, or expand it to see them again. This only changes the panel, not the map.
* **Delete group:** Remove the group. Its layers return to the top level of the list. Deleting a group never deletes your layers or data.

You can also reorder layers and groups by dragging them within the panel. The order in the panel sets the drawing order on the map, with layers at the top drawn above the ones below.

### Group visibility <a href="#group-visibility" id="group-visibility"></a>

Each group has its own visibility control:

* **Hide group / Show group:** Turn every layer in the group off or on at once. A group's visibility combines with each layer's own visibility, so a layer is drawn on the map only when both the group and the layer are set to visible.
* **Show only this:** Show the layers in this group and hide everything else, so you can focus on one part of the map.
* **Zoom to:** Frame the map around the layers in the group.

In the [legend](/carto-user-manual/maps/legend), groups appear as labelled sections that mirror the layer panel, so the people you share the map with get the same organized view rather than a flat list.

## Visualization types

The spatial definition of the source linked to a layer specifies the layer visualization type and additional visualization and styling options. The different layer visualization types supported in Buider are:

* [**Point**](/carto-user-manual/maps/layers/point): Displays as point geometries. Point data can be dynamically aggregated to the following types:
  * [**Grid**](/carto-user-manual/maps/layers/point/grid-point-aggregation)**:** Aggregated point geometry to grid.
  * [**H3**](/carto-user-manual/maps/layers/point/h3-point-aggregation): Aggregated point geometry to hexagonal cells.
  * [**Heatmap**](/carto-user-manual/maps/layers/point/heatmap-point-aggregation): Aggregated point geometry by density.
  * [**Cluster**](/carto-user-manual/maps/layers/point/cluster-point-aggregation)**:** Aggregated point geometry by circles.
* [**Polygon**](/carto-user-manual/maps/layers/polygon): Displays as polygon geometries.
* [**Line**](/carto-user-manual/maps/layers/line): Displays as line geometries.
* [**Grid**](/carto-user-manual/maps/layers/grid)**:** Displays features as grid cells.
* [**H3**](/carto-user-manual/maps/layers/h3): Displays features as hexagon cells.
* [**Raster**](/carto-user-manual/maps/layers/raster): Displays a grid of pixels.

### Visibility by zoom level <a href="#visibility-by-zoom-level" id="visibility-by-zoom-level"></a>

Control the zoom range where a layer should be visibile. This is useful for combining different type of sources, such as aggregated data for lower zoom levels and non-aggregated data for higher levels or visualizing different administrative levels.

<figure><img src="/files/qQ3dQtUUTIVjsyoUcxNg" alt=""><figcaption></figcaption></figure>

### Aggregate by geometry <a href="#aggregate-by-geometry" id="aggregate-by-geometry"></a>

If you are working with point, polygon or line layer visualization types containing identical geometries with varying attributes (e.g., weather stations or buildings), you can use the **Aggregate by geometry** functionality to aggregate your layer based on a distinct spatial column. This allows you to:

* Aggregate geometries in your layer ensuring an optimal performance.
* Aggregate styling and interaction attributes to retrieve relevant information link to your aggregated feature.
* Maintain widgets functionality over the original source, enabling drill-down operations for deeper insights.

For derived metrics like rates, ratios and weighted averages, **Aggregate by geometry** also supports [custom SQL aggregation expressions](/carto-user-manual/maps/layers/point#custom-aggregation-expressions) on styling channels and popup fields. Available on [point](/carto-user-manual/maps/layers/point#custom-aggregation-expressions), [line](/carto-user-manual/maps/layers/line#custom-aggregation-expressions) and [polygon](/carto-user-manual/maps/layers/polygon#custom-aggregation-expressions) layers.

<figure><img src="/files/RdXhNKX0C2XsZYRHIL4x" alt=""><figcaption></figcaption></figure>

## Layer styling

Layer styling is essential for making your maps informative and engaging. Below are generic aspects of visualization and styling options available in Builder. For more detailed styling capabilities for a specific layer type, we recommend to check each layer type as defined above.

### Labels <a href="#labels" id="labels"></a>

Text labels add typographic detail to your map, helping you communicate feature names or values directly on the Map View. Labels are available for **point, polygon, and line** layers.

Enable the **Labels** option in the layer panel, choose the column to display, and adjust **Font Size**, **Font Color**, **Text Anchor**, and **Placement**. CARTO places each label automatically, at the center of every polygon and along the middle of every line.

For **line** layers you can also set a **unique ID field**. A line feature is often split across several map tiles, which would otherwise produce one label per tile. Choosing a column that identifies each feature, such as a road name or ID, keeps a single label per feature.

### Color palettes <a href="#fill-color" id="fill-color"></a>

When styling layers in Builder, you can choose a few different types of **color palettes**:

* **Diverging:** Highlight values that are above and below an interesting mid-point in quantitative data. This is a great way to show data values that differ greatly from the norm. For example, you may use a diverging colour scheme to show population change.
* **Sequential:** Ideal for data that follows an order, often numeric ranging from low to high. For example, you may use a sequential colour scheme to show counts within a H3 grid.
* **Qualitative:** Represents different categories of data. For example, a qualitative scheme is a good choice for showing different types of Points of Interest.
* **Singlehue:** Gradual transition of a single color from light to dark. For example to visualize the quality network coverage signal.
* **Custom:** Pick a new color either by clicking on the color picker or inputting HEX/RGB values. Color steps can be added, removed and shuffled.

{% hint style="info" %}
When working with [**aggregated data sources**](/carto-user-manual/maps/data-sources#aggregated-grids), you will need to select an aggregation operation for your columns.

Connections to **Redshift** clusters only support aggregation of categorical properties by any value.
{% endhint %}

Admins can also create **custom color palettes** from the organization settings. These are reusable color schemes and they are available to the whole organization, removing the need to define a new custom palette every time a custom set of colours is used for styling.

For more information, see our [article on custom color palettes](/carto-user-manual/settings/customizations/configuring-custom-color-palettes).

### Color schema by HexColor <a href="#fill-color" id="fill-color"></a>

You can also tap into the **HexColor** feature to style qualitative data using the hex color codes from either your table or SQL query source. To harness this capability:

1. Navigate to the *Color based on* selector and choose the text column you want to associate with the hex color code.
2. In the *Palette* section, select the 'HexColor' option.
3. Finally, choose the column containing the hex color code values.

For more information about how to leverage this functionality see this [tutorial](https://academy.carto.com/building-interactive-maps/data-visualization/style-qualitative-data-using-hex-color-codes).

{% hint style="warning" %}
**Pre-generated tileset** layers styled with HexColor are not currently supported in the legend. If you require this functionality, please provide feedback through your CARTO point of contact.
{% endhint %}

### Color Scale <a href="#fill-color" id="fill-color"></a>

Depending on the property selected to define your color schema, you have different color scale functionalities to define the color classification method.

For numeric columns, you can choose the following data classification methods:

* **Quantile**: A quantile color scale is determined by rank. A quantile classification is well suited to linearly distributed data. Each quantile class contains an equal number of features. There are no empty classes or classes with too few or too many values. This can be misleading sometimes, since similar features can be placed in adjacent classes or widely different values can be in the same class, due to equal number grouping.
* **Quantize**: A quantized color scale is determined by grouping values in discrete increments. It allows to transform an initially continuous range into a discrete set of classes. Quantize scales will slice the domain’s extent into intervals of roughly equal lengths.
* **Logarithmic**: A Logarithmic scale based on powers of `10` will be created automatically, based on the number of steps in the selected color palette. Logarithmic scales tend to work well with [aggregated data sources](/carto-user-manual/maps/data-sources#aggregated-grids).
* **Custom**: A custom color scale is determined by arbitrary breaks in the classification. A custom scale is well suited to tweak color ramps, adjusting the values to fine tune the visualizations.

For text columns, you can use the **Ordinal** classification method to set a specific category to each color value:

<figure><img src="/files/IbUj1E0pn92bcZenmGJK" alt=""><figcaption></figcaption></figure>

### 3D visualization using Height <a href="#height" id="height"></a>

Builders allows you to assign heights to build 3D visualization for both polygons and spatial index sources. You can activate this option in the Height section, using the slider to define a fix value or using a property to define the height.

<figure><img src="/files/TXcEAJD76LVtfW6UQEUj" alt=""><figcaption></figcaption></figure>

When using the Height functionality, remember to activate the 3D view located in the toolbar above the map. Using this, you can achieve stunning visualizations as per below map.

{% embed url="<https://clausa.app.carto.com/map/620c2d98-4000-4e23-bb21-a6b3f941ed55>" %}
Explore a map with 3D polygons whose height is defined by the number of floors.
{% endembed %}

## Layer blending <a href="#layer-blending" id="layer-blending"></a>

Layer blending is a technique used to determine how overlapping features in different layers interact in terms of their visual representation. When two layers are blended, you can select the following blending options:

* **Additive:** This mode adds the color values of overlapping features. When two colors are added together, the resulting color is often lighter. This blending mode is commonly used to visualize densities or intensities.
* **Subtractive:** This blending mode subtracts the color values of the upper layer from the layer beneath it. The result is typically a darker color. In some contexts, this mode can help emphasize differences between layers.


# Point

In CARTO Builder, the Point layer visualization option allows you to render and style point features on your map. This layer type offers various advanced styling options to enhance the visual representation of your data such as creating heatmap or grid visualizations dynamically from your original source.

<figure><img src="/files/r27kMWxshAva8FgEucij" alt=""><figcaption></figcaption></figure>

## Visualization

You have different visualization options when it comes to point data. Using this functionality, we allow users to dynamically aggregate the original source to:

* [**Grid**](/carto-user-manual/maps/layers/point/grid-point-aggregation) : Aggregated geometry into grid cells.
* [**H3**](/carto-user-manual/maps/layers/h3): Aggregated geometry into hexagonal bins.
* [**Heatmap**](/carto-user-manual/maps/layers/point/heatmap-point-aggregation): Aggregated geometry by density.
* [**Cluster**](/carto-user-manual/maps/layers/point/cluster-point-aggregation): Aggregated geometry into circles.

Within the **Advanced visualization options** <img src="/files/KXy7rV4Gu0pLuWqxXqlk" alt="" data-size="line"> , you can access **Zoom Visibility** to define the range at which your layer should be visualized. This ensures that your lines are displayed at appropriate zoom levels, improving the clarity and relevance of your map.
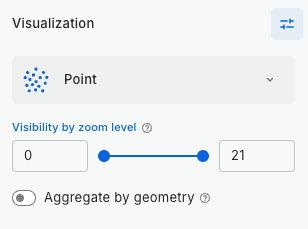
<figure><img src="/files/VAsI5eBC8qgTLO3fTVAW" alt=""><figcaption></figcaption></figure>

If your data source contains identical geometries with varying attributes (e.g., weather stations or buildings), you can use the **Aggregate by geometry** functionality to aggregate your layer based on a distinct spatial column. [Learn more in this section](/carto-user-manual/maps/layers#visibility-by-zoom-level-1).

## Symbol

When configuring your point layer symbol, you either use a simple point shape <img src="/files/y5Q6ySJMp3yMEWQQtXLh" alt="" data-size="line"> to render your point layer or you can use a custom marker <img src="/files/NPUotC3XYozBQXbuF8KP" alt="" data-size="line">.

### Custom markers

**Custom markers** allows you to set an icon or an image as a marker in your map, either a single marker or use multiple markers by property. Out-of-the-box options from [Maki icons collection](https://labs.mapbox.com/maki-icons/) is readily available. Additionally, you can upload your own .png or .svg file to be used as marker in the map.

{% hint style="warning" %}
When uploading custom markers, the **maximum allowed resolution is 120×120 pixels** and the **maximum file size is 200K**
{% endhint %}

### Radius / Size

The **Radius** dropdown offers three options in order:

* **Fixed** — a single pixel size, set with a simple slider.
* **Scale with zoom level** — a zoom-dependent size that grows and shrinks with the map zoom (see below).
* **A property from your data** — a radius range driven by a numeric column.

<figure><img src="/files/YY8gBWZ62Ed3wdGWKMbY" alt="" width="303"><figcaption></figcaption></figure>

#### Scale with zoom level

When you pick **Scale with zoom level**, the point radius grows and shrinks with the map zoom — keeping points visually proportional to the map context as the user zooms in and out, instead of staying a constant pixel size.

<figure><img src="/files/6abnZERznC1rce7HSoVg" alt="" width="303"><figcaption></figcaption></figure>

* The radius input label changes to **Base size at zoom level {N}**, where *N* is the map zoom at the moment you enabled the option. The pixel size you choose is the size points will have at that reference zoom; below it points get smaller, above it they get larger. *N* is then locked — to change it, switch back to **Fixed**, zoom to the desired view, and reselect **Scale with zoom level**.
* A **Min / Max bounds** control appears below to clamp the rendered pixel size, so points never become too small to see or too large to be useful.

## Fill

In this section you can define **Color** that will be used to fill your point symbol. You can set a simple color or use a [color schema](/carto-user-manual/maps/layers#fill-color) based on a given property to add depth and meaning to your lines. Additionally, you can adjust the fill opacity to your desired percentage for better visual effects.

<figure><img src="/files/xbiEEq4I7ocdf7XUwwnm" alt=""><figcaption></figcaption></figure>

When configuring either the color based on a property, you can access **Advanced fill options** <img src="/files/KXy7rV4Gu0pLuWqxXqlk" alt="" data-size="line"> to set the [color scale](/carto-user-manual/maps/layers#fill-color-2). This allows for a more granular and informative visualization.

## Stroke

The stroke of your line layer can be customized in various ways to suit your visualization needs:

* **Stroke Color**: Set a simple color or use a color schema based on a given property to add depth and meaning to your lines. Additionally, you can adjust the stroke opacity to your desired percentage for better visual effects.
* **Stroke Weight**: Define the stroke weight as either a fixed value or based on a given property. You can modify the stroke weight using a simple slider when set to fixed, or by defining a weight range when configured by a property.
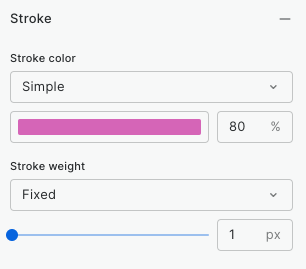
<figure><img src="/files/EvpHu53Z0awxQdDRDLI8" alt=""><figcaption></figcaption></figure>

When configuring either the stroke color or stroke weight based on a property, you can access **Advanced stroke options** <img src="/files/KXy7rV4Gu0pLuWqxXqlk" alt="" data-size="line"> to set the color scale or weight scale. This allows for a more granular and informative visualization.

## Labels

You can add labels for your point layer visualization. It can be either single label or double label. You can style and set the label size as well as configuring the placement of the label.
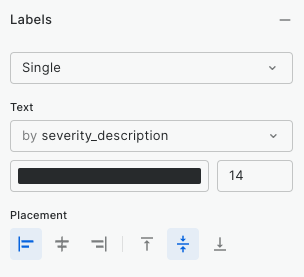
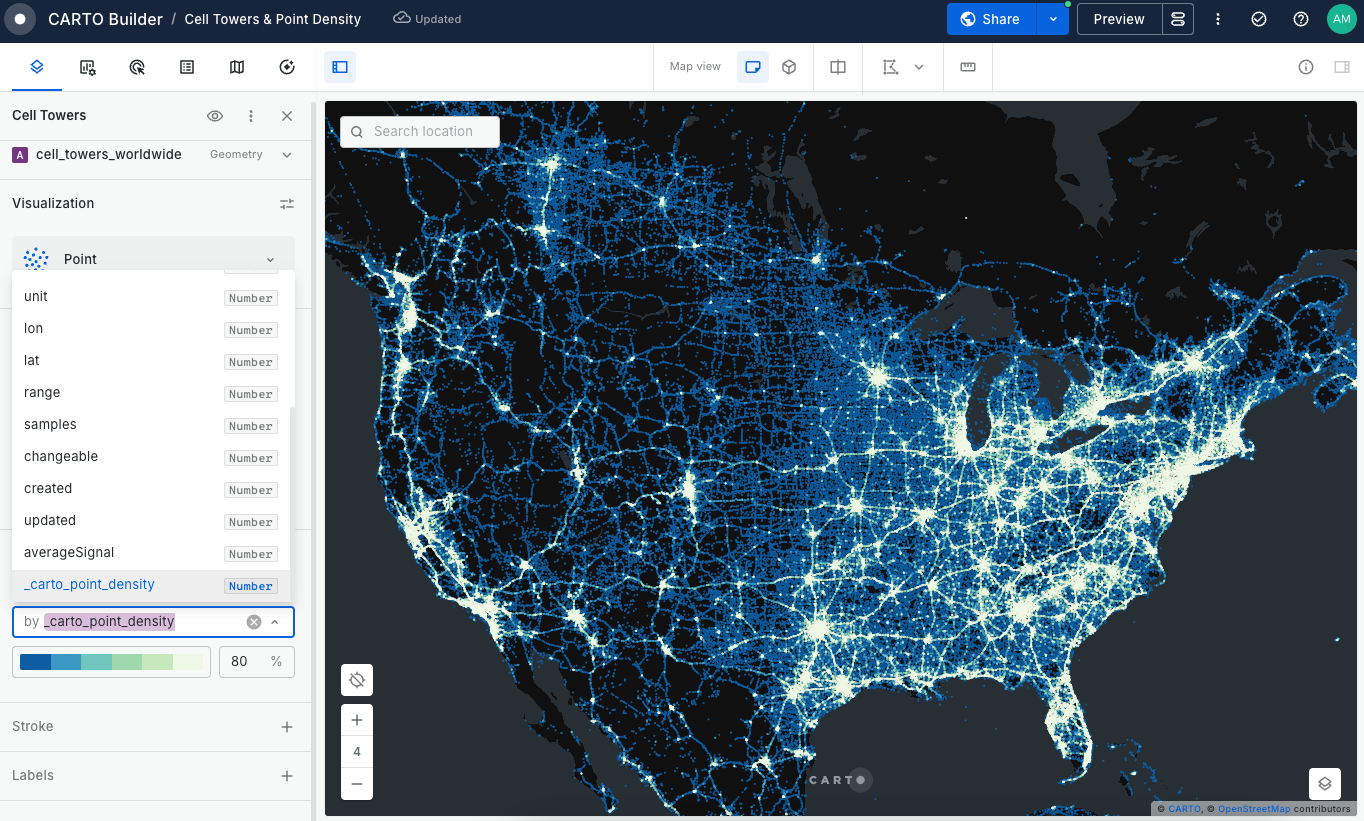
<figure><img src="/files/Kh61R1YNEGirqlItPIVB" alt=""><figcaption></figcaption></figure>

## Using `_carto_point_density` attribute

When working with point dynamic tiling sources in Builder, points are automatically aggregated for optimal visualization. The closer you zoom into the map, the more granular the view becomes, showing individual points.

In Builder, you can now leverage the automatically added `_carto_point_density` property to style the radius, fill and stroke of your layer based on the number of points aggregated at each visible point.

<figure><img src="/files/j09TIzt1GjtDaNxSJiXH" alt=""><figcaption></figcaption></figure>

## Custom aggregation expressions

On layers using [Aggregate by geometry](/carto-user-manual/maps/layers#aggregate-by-geometry), apart from the predefined aggregation methods (`avg`, `sum`, `min`, `max`, `count`), you can write a custom SQL aggregation expression that runs on your data warehouse. This is useful for derived metrics like rates, ratios and weighted averages.

```sql
SUM(female) / NULLIF(SUM(population), 0)
```

Custom aggregation is also available in popup fields. See [Interactions](/carto-user-manual/maps/interactions#custom-aggregation-in-popups).


# Grid point aggregation

Grid point aggregation allows you to dynamically visualize your point data as an aggregated grid, leveraging CARTO's native support for spatial indexes. This type of visualization is ideal for simplifying large datasets, improving performance by reducing rendering complexity, and identifying patterns and trends within the data.

<figure><img src="/files/VIcFJYAIrTCcsdbCb711" alt=""><figcaption></figcaption></figure>

## Visualization

In the Visualization section, you can easily identify the type of layer your visualizing. Additionally, within the **Advanced visualization options** <img src="/files/KXy7rV4Gu0pLuWqxXqlk" alt="" data-size="line"> , you can access **Zoom Visibility** to define the range at which your layer should be visualized. This ensures that your lines are displayed at appropriate zoom levels, improving the clarity and relevance of your map.
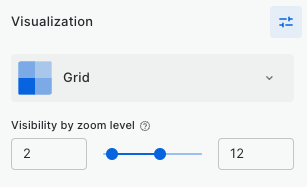
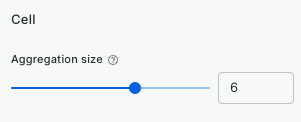
<figure><img src="/files/ii0gPddzcUQ7NC80BE1T" alt=""><figcaption></figcaption></figure>

For this type of layer, there is an additional `COUNT` aggregation operation available for numeric properties. In order to ensure a precise count, our recommendation is to use a unique id column in your data.

## Cell

When using Grid layer visualization type in Builder, data is aggregated as you zoom in and out on the map. In the Cell section, you can define the aggregation size to determine the level of granularity you prefer for your data aggregation.

<figure><img src="/files/i3OwQnrtyYvWD7nb30Bq" alt=""><figcaption></figcaption></figure>

## Fill

In this section you can define **Color** that will be used to fill your cell. You can set a simple color or use a [color schema](/carto-user-manual/maps/layers#fill-color) based on a given property to add depth and meaning to your lines. Additionally, you can adjust the fill opacity to your desired percentage for better visual effects.

<figure><img src="/files/xbiEEq4I7ocdf7XUwwnm" alt=""><figcaption></figcaption></figure>

When configuring either the color based on a property, you can access **Advanced fill options** <img src="/files/KXy7rV4Gu0pLuWqxXqlk" alt="" data-size="line"> to set the [color scale](/carto-user-manual/maps/layers#fill-color-2). This allows for a more granular and informative visualization.

## Stroke

The stroke of your line layer can be customized in various ways to suit your visualization needs:

* **Stroke Color**: Set a simple color or use a color schema based on a given property to add depth and meaning to your lines. Additionally, you can adjust the stroke opacity to your desired percentage for better visual effects.
* **Stroke Weight**: Define the stroke weight as either a fixed value or based on a given property. You can modify the stroke weight using a simple slider when set to fixed, or by defining a weight range when configured by a property.

<figure><img src="/files/EvpHu53Z0awxQdDRDLI8" alt=""><figcaption></figcaption></figure>

When configuring either the stroke color or stroke weight based on a property, you can access **Advanced stroke options** <img src="/files/KXy7rV4Gu0pLuWqxXqlk" alt="" data-size="line"> to set the color scale or weight scale. This allows for a more granular and informative visualization.

## Height

You can enable height visualization to extrude the height of your grid layer. When this is enabled, make sure to change the map view to 3D so you can see the features on this view mode.

Set a fixed height or set the height value based on a given property. You use the slider to multiple the height value according to your need.
<figure><img src="/files/LYoVMh60FAvHDjahokkj" alt=""><figcaption></figcaption></figure>

When configuring the height based on a property, you can access **Advanced height options** <img src="/files/KXy7rV4Gu0pLuWqxXqlk" alt="" data-size="line"> to set the height scale. Additionally, you can enable the Show wireframe option to visualize the stroke of the 3D objects.

## Custom aggregation expressions

Apart from the predefined aggregation methods (`avg`, `sum`, `min`, `max`, `count`), you can write a custom SQL aggregation expression that runs on your data warehouse. This is useful for derived metrics like rates, ratios and weighted averages.

```sql
SUM(female) / NULLIF(SUM(population), 0)
```

Custom aggregation is also available in popup fields. See [Interactions](/carto-user-manual/maps/interactions#custom-aggregation-in-popups).

{% hint style="info" %}
**Working with aggregated property values**

When working with H3 point aggregation layer, all properties used for visualization and styling purposes must use a defined aggregation method. You can access this while using the column drop-down menu.

For this layer type there is an additional COUNT aggregation operation available for numeric properties. In order to ensure a precise count, our recommendation is to use a unique id column in your data.
{% endhint %}


# H3 point aggregation

H3 point aggregation allows you to dynamically visualize your point data as an aggregated hexagonal bins, leveraging CARTO's native support for H3 spatial indexes. This type of visualization is ideal for simplifying large datasets, improving performance by reducing rendering complexity, and identifying patterns and trends within the data.

<figure><img src="/files/NWP2xtjcl7b180sipgYI" alt=""><figcaption></figcaption></figure>

{% hint style="warning" %}
Please note that the **h3-pg PostgreSQL extension** is required for dynamically aggregating points into H3 cells from PostgreSQL data sources.
{% endhint %}

## Visualization

In the Visualization section, you can easily identify the type of layer your visualizing. Additionally, within the **Advanced visualization options** <img src="/files/KXy7rV4Gu0pLuWqxXqlk" alt="" data-size="line"> , you can access **Zoom Visibility** to define the range at which your layer should be visualized. This ensures that your lines are displayed at appropriate zoom levels, improving the clarity and relevance of your map.
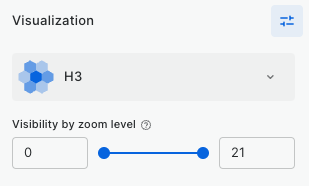
<figure><img src="/files/Ixw1hiuPZyoaY2HXiExF" alt=""><figcaption></figcaption></figure>

## Cell

When using Grid layer visualization type in Builder, data is aggregated as you zoom in and out on the map. In the Cell section, you can define the aggregation size to determine the level of granularity you prefer for your data aggregation.

<figure><img src="/files/i3OwQnrtyYvWD7nb30Bq" alt=""><figcaption></figcaption></figure>

## Fill

In this section you can define the **Color** that will be used to fill your cell. You can set a simple color or use a [color schema](/carto-user-manual/maps/layers#fill-color) based on a given property to add depth and meaning to your lines. Additionally, you can adjust the fill opacity to your desired percentage for better visual effects.

<figure><img src="/files/xbiEEq4I7ocdf7XUwwnm" alt=""><figcaption></figcaption></figure>

When configuring either the color based on a property, you can access **Advanced fill options** <img src="/files/KXy7rV4Gu0pLuWqxXqlk" alt="" data-size="line"> to set the [color scale](/carto-user-manual/maps/layers#fill-color-2). This allows for a more granular and informative visualization.

## Stroke

The stroke of your line layer can be customized in various ways to suit your visualization needs:

* **Stroke Color**: Set a simple color or use a color schema based on a given property to add depth and meaning to your lines. Additionally, you can adjust the stroke opacity to your desired percentage for better visual effects.
* **Stroke Weight**: Define the stroke weight as either a fixed value or based on a given property. You can modify the stroke weight using a simple slider when set to fixed, or by defining a weight range when configured by a property.

<figure><img src="/files/EvpHu53Z0awxQdDRDLI8" alt=""><figcaption></figcaption></figure>

When configuring either the stroke color or stroke weight based on a property, you can access **Advanced stroke options** <img src="/files/KXy7rV4Gu0pLuWqxXqlk" alt="" data-size="line"> to set the color scale or weight scale. This allows for a more granular and informative visualization.

## Height

You can enable height visualization to extrude the height of your grid layer. When this is enabled, make sure to change the map view to 3D so you can see the features on this view mode.

Set a fixed height or set the height value based on a given property. You use the slider to multiple the height value according to your need.

<figure><img src="/files/LYoVMh60FAvHDjahokkj" alt=""><figcaption></figcaption></figure>

When configuring the height based on a property, you can access **Advanced height options** <img src="/files/KXy7rV4Gu0pLuWqxXqlk" alt="" data-size="line"> to set the height scale. Additionally, you can enable the Show wireframe option to visualize the stroke of the 3D objects.

## Custom aggregation expressions

Apart from the predefined aggregation methods (`avg`, `sum`, `min`, `max`, `count`), you can write a custom SQL aggregation expression that runs on your data warehouse. This is useful for derived metrics like rates, ratios and weighted averages.

```sql
SUM(female) / NULLIF(SUM(population), 0)
```

Custom aggregation is also available in popup fields. See [Interactions](/carto-user-manual/maps/interactions#custom-aggregation-in-popups).

{% hint style="info" %}
**Working with aggregated property values**

When working with H3 point aggregation layer, all properties used for visualization and styling purposes must use a defined aggregation method. You can access this while using the column drop-down menu.

For this type of layer, there is an additional `COUNT` aggregation operation available for numeric properties. In order to ensure a precise count, our recommendation is to use a unique id column in your data.
{% endhint %}


# Heatmap point aggregation

Heatmap point aggregation allows you to dynamically display your point data as a heatmap visualization, even when working with large-scale data. This type of visualization is ideal for simplifying complex datasets, identify hotspot patterns and gain insights from your data.
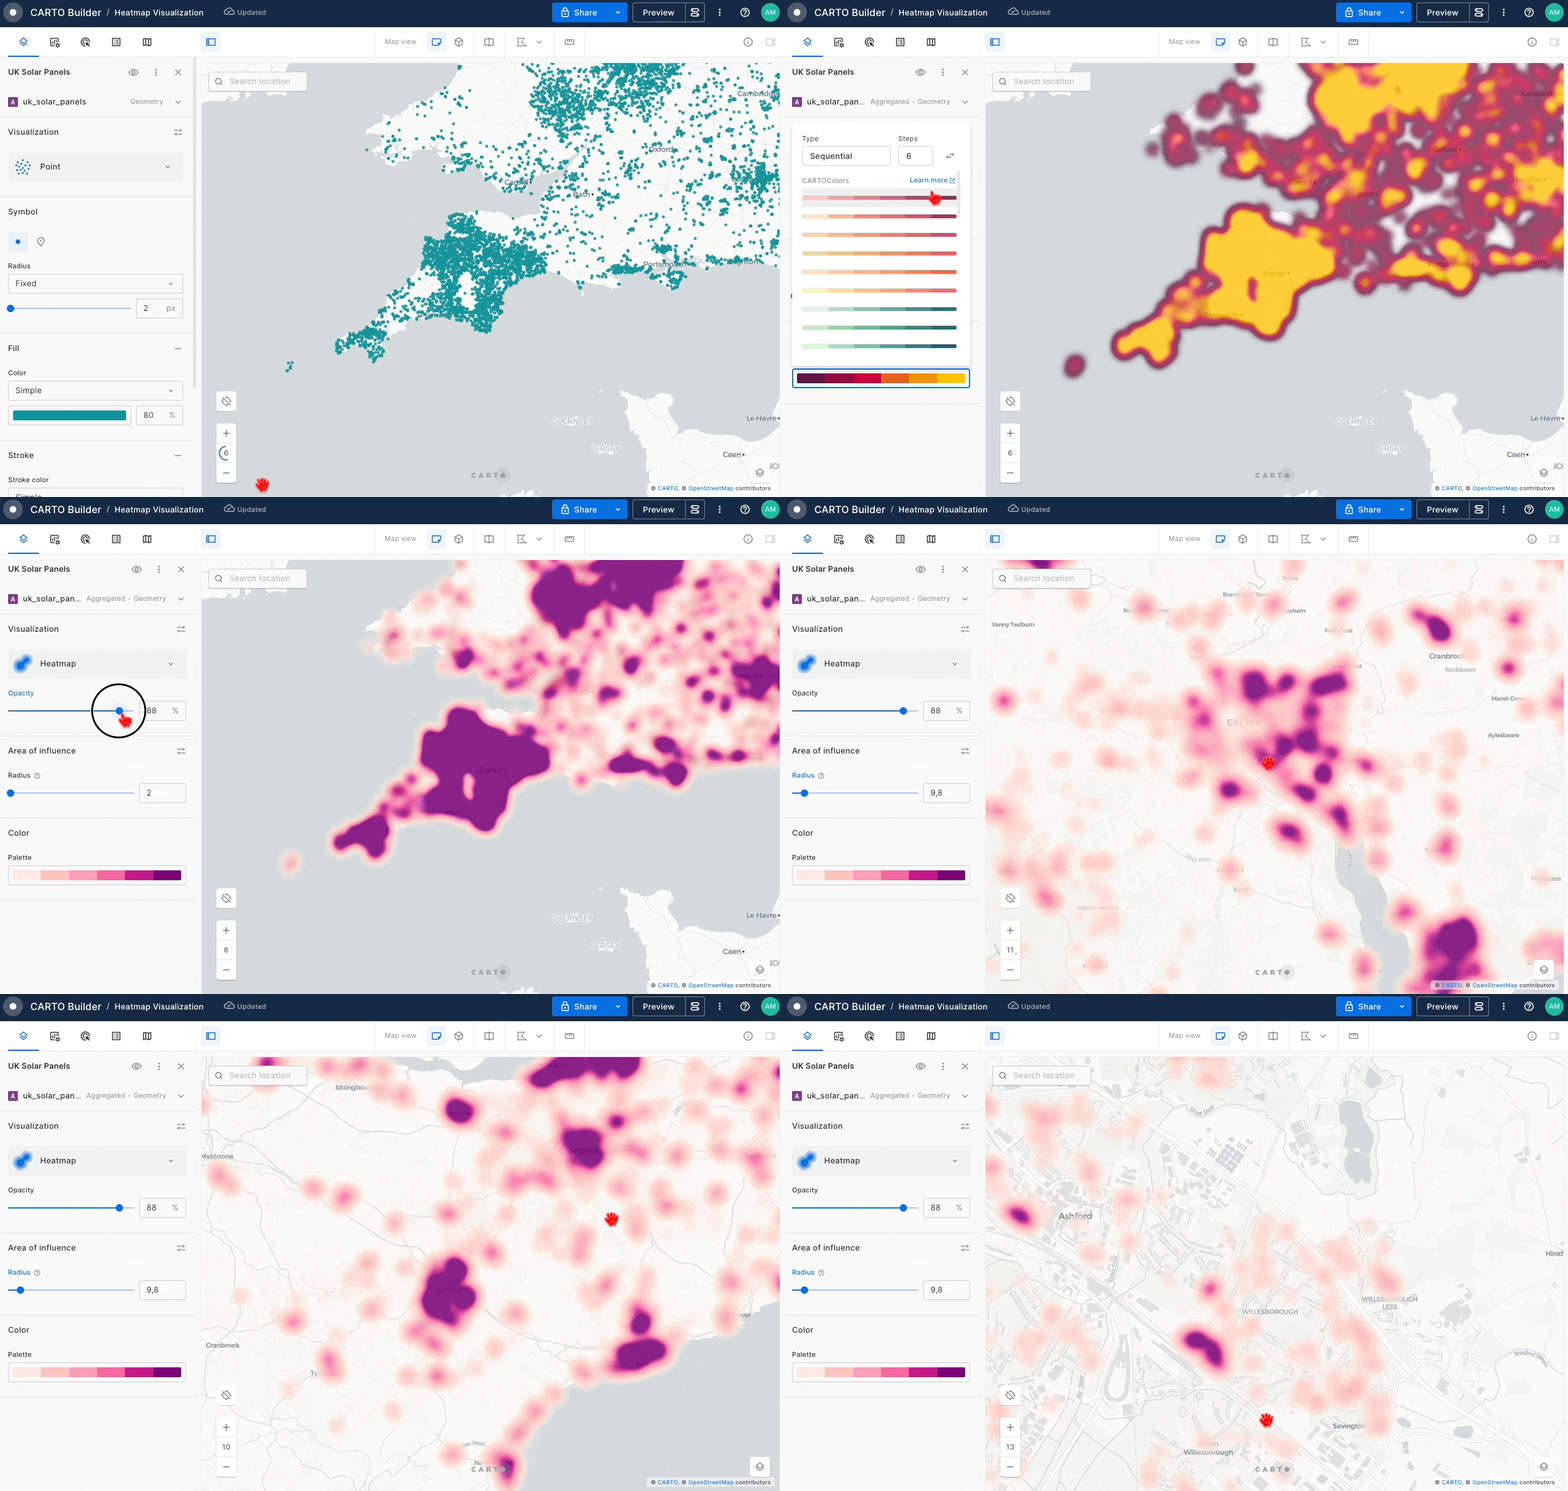
<figure><img src="/files/XbqQesVstG5kGjj49TSF" alt=""><figcaption></figcaption></figure>

## Visualization

In the Visualization section you can specify the Opacity setting at layer source. Additionally, within the **Advanced visualization options** <img src="/files/KXy7rV4Gu0pLuWqxXqlk" alt="" data-size="line"> , you can access **Zoom Visibility** to define the range at which your layer should be visualized.
<figure><img src="/files/uFCAAuPOhKRUOtJB0j9W" alt=""><figcaption></figcaption></figure>

## Area of influence

The area of influence for heatmap layers defines the radius around each point that contributes to the heatmap. A smaller radius results in a smoother heatmap with lower detail, whereas a larger radius shows more distinct variations. This radius can either be uniform or vary according to a specific property.

<figure><img src="/files/pvYvF5p5b6qv4CKtscPe" alt=""><figcaption></figcaption></figure>

## Color

You can style your heatmap choosing the desired palette in the Color section. For more information about color palettes supported in Builder check this [section](/carto-user-manual/maps/layers#fill-color).

<figure><img src="/files/nXrVZ9eUUZ689Cke0Jws" alt=""><figcaption></figcaption></figure>


# Cluster point aggregation

Cluster point aggregation allows you to dynamically group and display your point data as clusters, even when working with large-scale datasets. This type of visualization is ideal for simplifying complex data, identifying concentration patterns, and gaining insights by visualizing data density in a more digestible format.

<figure><img src="/files/uTa1S8gTxsZIVc6bItIt" alt=""><figcaption></figcaption></figure>

## Visualization

In the Visualization section you can specify the Opacity setting at layer source. Additionally, within the **Advanced visualization options** <img src="/files/KXy7rV4Gu0pLuWqxXqlk" alt="" data-size="line"> , you can access **Zoom Visibility** to define the range at which your layer should be visualized.

<figure><img src="/files/7ZDQf1vfooiMIDIAtjih" alt=""><figcaption></figcaption></figure>

## Symbol

In this section, you can define the cluster radius range and adjust the symbol’s aggregation size. This allows you to control the level of detail in the clustering—lower values result in more detailed, granular clusters.

<figure><img src="/files/7W9LKDvuGlNIi6zsFPGB" alt=""><figcaption></figcaption></figure>

## Fill

Define the **Color** that will be used to fill your cluster. You can set a simple color or use a [color schema](/carto-user-manual/maps/layers#fill-color) based on a given property to add depth and meaning to your lines. Additionally, you can adjust the fill opacity to your desired percentage for better visual effects.

<figure><img src="/files/If199utdcXNwbe6rX3J2" alt=""><figcaption></figcaption></figure>

When configuring either the color based on a property, you can access **Advanced fill options** <img src="/files/KXy7rV4Gu0pLuWqxXqlk" alt="" data-size="line"> to set the [color scale](/carto-user-manual/maps/layers#fill-color-2). This allows for a more granular and informative visualization.

## Stroke

In the Stroke section, you can customize the stroke color and adjust its opacity. Additionally, you can set the stroke weight to match your visualization needs.

<figure><img src="/files/cFrOUTumIicrgVlQrdAM" alt=""><figcaption></figcaption></figure>

## Label

Labels for cluster layers allow you to display the number of aggregated points within each cluster. You can customize both the text color and the halo (outline) color to fit your visualization needs.

<figure><img src="/files/33LxEIaI1NqpAw8MzSCg" alt=""><figcaption></figcaption></figure>


# Polygon

In CARTO Builder, the Point layer visualization option allows you to render and style point features on your map. This layer type offers various advanced styling options to enhance the visual representation of your data such as creating heatmap or grid visualizations dynamically from your original source.

<figure><img src="/files/vfJfyZlba98xPK99qXaO" alt=""><figcaption></figcaption></figure>

## Visualization

Within the **Advanced visualization options** <img src="/files/KXy7rV4Gu0pLuWqxXqlk" alt="" data-size="line"> , you can access **Zoom Visibility** to define the range at which your layer should be visualized. This ensures that your lines are displayed at appropriate zoom levels, improving the clarity and relevance of your map.
<figure><img src="/files/lkNZkt9IDxmhxTU1W0G5" alt=""><figcaption></figcaption></figure>

If your data source contains identical geometries with varying attributes (e.g., weather stations or buildings), you can use the **Aggregate by geometry** functionality to aggregate your layer based on a distinct spatial column. [Learn more in this section](/carto-user-manual/maps/layers#visibility-by-zoom-level-1).

## Fill

In this section you can define **Color** that will be used to fill your point symbol. You can set a simple color or use a [color schema](/carto-user-manual/maps/layers#fill-color) based on a given property to add depth and meaning to your lines. Additionally, you can adjust the fill opacity to your desired percentage for better visual effects.

<figure><img src="/files/xbiEEq4I7ocdf7XUwwnm" alt=""><figcaption></figcaption></figure>

When configuring either the color based on a property, you can access **Advanced fill options** <img src="/files/KXy7rV4Gu0pLuWqxXqlk" alt="" data-size="line"> to set the [color scale](/carto-user-manual/maps/layers#fill-color-2). This allows for a more granular and informative visualization.

## Stroke

The stroke of your line layer can be customized in various ways to suit your visualization needs:

* **Stroke Color**: Set a simple color or use a color schema based on a given property to add depth and meaning to your lines. Additionally, you can adjust the stroke opacity to your desired percentage for better visual effects.
* **Stroke Weight**: Define the stroke weight as either a fixed value or based on a given property. You can modify the stroke weight using a simple slider when set to fixed, or by defining a weight range when configured by a property.

<figure><img src="/files/EvpHu53Z0awxQdDRDLI8" alt=""><figcaption></figcaption></figure>

When configuring either the stroke color or stroke weight based on a property, you can access **Advanced stroke options** <img src="/files/KXy7rV4Gu0pLuWqxXqlk" alt="" data-size="line"> to set the color scale or weight scale. This allows for a more granular and informative visualization.

## Height

You can enable height visualization to extrude the height of your grid layer. When this is enabled, make sure to change the map view to 3D so you can see the features on this view mode.

Set a fixed height or set the height value based on a given property. You use the slider to multiple the height value according to your need.

<figure><img src="/files/LYoVMh60FAvHDjahokkj" alt=""><figcaption></figcaption></figure>

When configuring the height based on a property, you can access **Advanced height options** <img src="/files/KXy7rV4Gu0pLuWqxXqlk" alt="" data-size="line"> to set the height scale. Additionally, you can enable the Show wireframe option to visualize the stroke of the 3D objects.

## Custom aggregation expressions

On layers using [Aggregate by geometry](/carto-user-manual/maps/layers#aggregate-by-geometry), apart from the predefined aggregation methods (`avg`, `sum`, `min`, `max`, `count`), you can write a custom SQL aggregation expression that runs on your data warehouse. This is useful for derived metrics like rates, ratios and weighted averages.

```sql
SUM(female) / NULLIF(SUM(population), 0)
```

Custom aggregation is also available in popup fields. See [Interactions](/carto-user-manual/maps/interactions#custom-aggregation-in-popups).


# Line

In CARTO Builder, the Point layer visualization option allows you to render and style point features on your map. This layer type offers various advanced styling options to enhance the visual representation of your data such as creating heatmap or grid visualizations dynamically from your original source.

<figure><img src="/files/KqVhl6PYNqDmmcItyaxF" alt=""><figcaption></figcaption></figure>

## Visualization

Within the **Advanced visualization options** <img src="/files/KXy7rV4Gu0pLuWqxXqlk" alt="" data-size="line"> , you can access **Zoom Visibility** to define the range at which your layer should be visualized. This ensures that your lines are displayed at appropriate zoom levels, improving the clarity and relevance of your map.
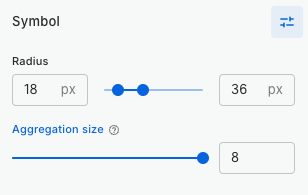
<figure><img src="/files/EUMPs7wUboByFCgje47S" alt=""><figcaption></figcaption></figure>

If your data source contains identical geometries with varying attributes (e.g., weather stations, admin regions or buildings), you can use the **Aggregate by geometry** functionality to aggregate your layer based on a distinct spatial column. [Learn more in this section](/carto-user-manual/maps/layers#visibility-by-zoom-level-1).

## Stroke

The stroke of your line layer can be customized in various ways to suit your visualization needs:

* **Stroke Color**: Set a simple color or use a color schema based on a given property to add depth and meaning to your lines. Additionally, you can adjust the stroke opacity to your desired percentage for better visual effects.
* **Stroke Weight**: Define the stroke weight as either a fixed value or based on a given property. You can modify the stroke weight using a simple slider when set to fixed, or by defining a weight range when configured by a property.

<figure><img src="/files/EvpHu53Z0awxQdDRDLI8" alt=""><figcaption></figcaption></figure>

When configuring either the stroke color or stroke weight based on a property, you can access **Advanced stroke options** <img src="/files/KXy7rV4Gu0pLuWqxXqlk" alt="" data-size="line"> to set the color scale or weight scale. This allows for a more granular and informative visualization.

## Custom aggregation expressions

On layers using [Aggregate by geometry](/carto-user-manual/maps/layers#aggregate-by-geometry), apart from the predefined aggregation methods (`avg`, `sum`, `min`, `max`, `count`), you can write a custom SQL aggregation expression that runs on your data warehouse. This is useful for derived metrics like rates, ratios and weighted averages.

```sql
SUM(female) / NULLIF(SUM(population), 0)
```

Custom aggregation is also available in popup fields. See [Interactions](/carto-user-manual/maps/interactions#custom-aggregation-in-popups).


# Grid

Data sources using spatial column storing quadbin identifiers and spatial type quadbin will be rendered as a Grid layer type. Grid layers uses quadbin to natively render features on the map in an aggregated manner.

<figure><img src="/files/lqWSzkkvd0HBnscHIKm3" alt=""><figcaption></figcaption></figure>

## Visualization

In the Visualization section, you can easily identify the type of layer your visualizing. Additionally, within the **Advanced visualization options** <img src="/files/KXy7rV4Gu0pLuWqxXqlk" alt="" data-size="line"> , you can access **Zoom Visibility** to define the range at which your layer should be visualized. This ensures that your lines are displayed at appropriate zoom levels, improving the clarity and relevance of your map.
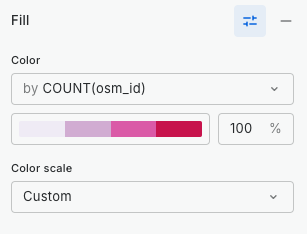
<figure><img src="/files/ii0gPddzcUQ7NC80BE1T" alt=""><figcaption></figcaption></figure>

## Cell

When using Grid layer visualization type in Builder, data is aggregated as you zoom in and out on the map. In the Cell section, you can define the aggregation size to determine the level of granularity you prefer for your data aggregation.

<figure><img src="/files/i3OwQnrtyYvWD7nb30Bq" alt=""><figcaption></figcaption></figure>

## Fill

In this section you can define **Color** that will be used to fill your point symbol. You can set a simple color or use a [color schema](/carto-user-manual/maps/layers#fill-color) based on a given property to add depth and meaning to your lines. Additionally, you can adjust the fill opacity to your desired percentage for better visual effects.

<figure><img src="/files/xbiEEq4I7ocdf7XUwwnm" alt=""><figcaption></figcaption></figure>

When configuring either the color based on a property, you can access **Advanced fill options** <img src="/files/KXy7rV4Gu0pLuWqxXqlk" alt="" data-size="line"> to set the [color scale](/carto-user-manual/maps/layers#fill-color-2). This allows for a more granular and informative visualization.

## Stroke

The stroke of your line layer can be customized in various ways to suit your visualization needs:

* **Stroke Color**: Set a simple color or use a color schema based on a given property to add depth and meaning to your lines. Additionally, you can adjust the stroke opacity to your desired percentage for better visual effects.
* **Stroke Weight**: Define the stroke weight as either a fixed value or based on a given property. You can modify the stroke weight using a simple slider when set to fixed, or by defining a weight range when configured by a property.

<figure><img src="/files/EvpHu53Z0awxQdDRDLI8" alt=""><figcaption></figcaption></figure>

When configuring either the stroke color or stroke weight based on a property, you can access **Advanced stroke options** <img src="/files/KXy7rV4Gu0pLuWqxXqlk" alt="" data-size="line"> to set the color scale or weight scale. This allows for a more granular and informative visualization.

## Height

You can enable height visualization to extrude the height of your grid layer. When this is enabled, make sure to change the map view to 3D so you can see the features on this view mode.

Set a fixed height or set the height value based on a given property. You use the slider to multiple the height value according to your need.

<figure><img src="/files/LYoVMh60FAvHDjahokkj" alt=""><figcaption></figcaption></figure>

When configuring the height based on a property, you can access **Advanced height options** <img src="/files/KXy7rV4Gu0pLuWqxXqlk" alt="" data-size="line"> to set the height scale. Additionally, you can enable the Show wireframe option to visualize the stroke of the 3D objects.

## Custom aggregation expressions

Apart from the predefined aggregation methods (`avg`, `sum`, `min`, `max`, `count`), you can write a custom SQL aggregation expression that runs on your data warehouse. This is useful for derived metrics like rates, ratios and weighted averages.

```sql
SUM(female) / NULLIF(SUM(population), 0)
```

Custom aggregation is also available in popup fields. See [Interactions](/carto-user-manual/maps/interactions#custom-aggregation-in-popups).

{% hint style="info" %}
**Working with aggregated property values**

When working with H3 point aggregation layer, all properties used for visualization and styling purposes must use a defined aggregation method. You can access this while using the column drop-down menu.

For this type of layer, there is an additional `COUNT` aggregation operation available for numeric properties. In order to ensure a precise count, our recommendation is to use a unique id column in your data.
{% endhint %}


# H3

Data sources with a spatial column storing H3 identifiers and a spatial type of H3 are rendered as an H3 layer type in CARTO Builder. H3 layers leverage the H3 cell ids to efficiently render features on the map in an aggregated format, enabling seamless visualization of large-scale spatial datasets.

<figure><img src="/files/v47vzmjxZGlyRtQYHlGe" alt=""><figcaption></figcaption></figure>

## Visualization

In the Visualization section, you can easily identify the type of layer your visualizing. Additionally, within the **Advanced visualization options** <img src="/files/KXy7rV4Gu0pLuWqxXqlk" alt="" data-size="line"> , you can access **Zoom Visibility** to define the range at which your layer should be visualized. This ensures that your lines are displayed at appropriate zoom levels, improving the clarity and relevance of your map.
<figure><img src="/files/Ixw1hiuPZyoaY2HXiExF" alt=""><figcaption></figcaption></figure>

## Cell

When using Grid layer visualization type in Builder, data is aggregated as you zoom in and out on the map. In the Cell section, you can define the aggregation size to determine the level of granularity you prefer for your data aggregation.

<figure><img src="/files/i3OwQnrtyYvWD7nb30Bq" alt=""><figcaption></figcaption></figure>

## Fill

In this section you can define **Color** that will be used to fill your point symbol. You can set a simple color or use a [color schema](/carto-user-manual/maps/layers#fill-color) based on a given property to add depth and meaning to your lines. Additionally, you can adjust the fill opacity to your desired percentage for better visual effects.

<figure><img src="/files/xbiEEq4I7ocdf7XUwwnm" alt=""><figcaption></figcaption></figure>

When configuring either the color based on a property, you can access **Advanced fill options** <img src="/files/KXy7rV4Gu0pLuWqxXqlk" alt="" data-size="line"> to set the [color scale](/carto-user-manual/maps/layers#fill-color-2). This allows for a more granular and informative visualization.

## Stroke

The stroke of your line layer can be customized in various ways to suit your visualization needs:

* **Stroke Color**: Set a simple color or use a color schema based on a given property to add depth and meaning to your lines. Additionally, you can adjust the stroke opacity to your desired percentage for better visual effects.
* **Stroke Weight**: Define the stroke weight as either a fixed value or based on a given property. You can modify the stroke weight using a simple slider when set to fixed, or by defining a weight range when configured by a property.

<figure><img src="/files/EvpHu53Z0awxQdDRDLI8" alt=""><figcaption></figcaption></figure>

When configuring either the stroke color or stroke weight based on a property, you can access **Advanced stroke options** <img src="/files/KXy7rV4Gu0pLuWqxXqlk" alt="" data-size="line"> to set the color scale or weight scale. This allows for a more granular and informative visualization.

## Height

You can enable height visualization to extrude the height of your grid layer. When this is enabled, make sure to change the map view to 3D so you can see the features on this view mode.

Set a fixed height or set the height value based on a given property. You use the slider to multiple the height value according to your need.

<figure><img src="/files/LYoVMh60FAvHDjahokkj" alt=""><figcaption></figcaption></figure>

When configuring the height based on a property, you can access **Advanced height options** <img src="/files/KXy7rV4Gu0pLuWqxXqlk" alt="" data-size="line"> to set the height scale. Additionally, you can enable the Show wireframe option to visualize the stroke of the 3D objects.

## Custom aggregation expressions

Apart from the predefined aggregation methods (`avg`, `sum`, `min`, `max`, `count`), you can write a custom SQL aggregation expression that runs on your data warehouse. This is useful for derived metrics like rates, ratios and weighted averages.

```sql
SUM(female) / NULLIF(SUM(population), 0)
```

<figure><img src="/files/rUHoFB56ytGul0v9Jx84" alt=""><figcaption></figcaption></figure>

Custom aggregation is also available in popup fields. See [Interactions](/carto-user-manual/maps/interactions#custom-aggregation-in-popups).

{% hint style="info" %}
**Working with aggregated property values**

When working with H3 point aggregation layer, all properties used for visualization and styling purposes must use a defined aggregation method. You can access this while using the column drop-down menu.

For this type of layer, there is an additional `COUNT` aggregation operation available for numeric properties. In order to ensure a precise count, our recommendation is to use a unique id column in your data.
{% endhint %}


# Raster

In CARTO Builder, the Raster layer visualization option allows you to render and style raster data such as such as deforestation patterns, land classifications, or flood risk models, directly on your map.

<figure><img src="/files/PEX4dBZGpf3BleQQnz6k" alt=""><figcaption></figcaption></figure>

## Visualization

Within the **Advanced Visualization Options** <img src="/files/KXy7rV4Gu0pLuWqxXqlk" alt="" data-size="line">, you can control the **opacity** of your raster layer, allowing you to blend it seamlessly with other layers on your map for improved visual clarity.

You can also use **Visibility by zoom level** to define the range of zoom levels at which your layer will be displayed. This ensures your map remains relevant by showing layers only at the appropriate scales.
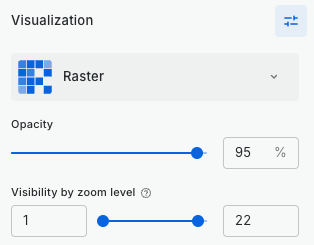
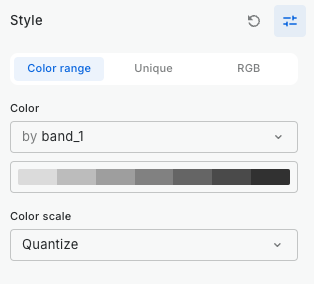
<figure><img src="/files/gUmtiHcU9x2r6rRTZnQ4" alt=""><figcaption></figcaption></figure>

## Style

A raster layer can be styled in the following manners:

* **Color Range**: Ideal for continuous data like elevation or temperature ranges.
* **Unique:** Best for categorical data such as land use classification or vegetation types.
* **RGB**: Suitable for visualizing satellite imagery sources to obtain true-color or false-color composite.

### Color Range

Color Range allows you to style a band by different ranges. The Color Range will be used by default if you have 'Grey' as the Color Interpreter in your raster metadata band. Learn more about Color Interpreter here.

<figure><img src="/files/kvpynUn4gJHqBaWNW6QE" alt=""><figcaption></figcaption></figure>

{% hint style="info" %}
Quantiles color scale is available only if the `quantile` stat has been added to the specific band during the raster-loader process.
{% endhint %}

### Unique

Unique style allows you to style discrete numeric bands using unique color values. The Unique style will be used by default if you have 'Palette' as the [Color Interpreter](#color-interpreter) by default. Learn more about Color Interpreter here.

<figure><img src="/files/BTbMHCLY1YVVUoM8wMmF" alt=""><figcaption></figcaption></figure>

{% hint style="info" %}
Unique style is only available for rasters containing at least a discrete numeric band containing `top_values` stat in the raster band metadata.
{% endhint %}

### RGB

RGB styles allows you to assign bands to the `red`, `green` and `blue` channel spectrum. The RGB style will be used by default when red, green and blue bands are color interpreter in the metadata. Learn more about [Color Interpreter](#color-interpreter) here.

<figure><img src="/files/2sQC5BhtVl68eGEMlnST" alt=""><figcaption></figcaption></figure>

#### Custom expressions

Here you can select specific bands as well as adding your own custom expressions. To add a *custom expression*, simply type in the selector menu the expression you want to add. You must ensure the syntax is correct before adding an expression.

<figure><img src="/files/CljFbilHqOBUOiXaujLL" alt=""><figcaption></figcaption></figure>

#### **Color interpreter**

If your original raster includes a **Color Interpreter**, this will be respected during the uploading process and will be used by default to style your raster layer in CARTO Builder. The current **Color Interpreter types** supported, based on [GDAL data model](https://gdal.org/en/latest/user/raster_data_model.html), are as follows:

* **Palette**: For discrete numeric bands, the **Unique style** will be applied by default. This type supports a **Color Table**, which defines the relationship between numeric values and colors.
* **Gray**: For bands with a gray interpreter, a grayscale palette is applied using the **Color Range** and **Quantize color scale** for smoother visualization.
* **Red, Green, and Blue (RGB)**: When bands are interpreted as red, green, and blue, the **RGB style** is used by default. Each band is assigned to the corresponding red, green, or blue channel to render a composite image.

<figure><img src="/files/zENoKSRLOEziwkrdktlM" alt=""><figcaption></figcaption></figure>

#### No data value

CARTO Builder will not render any pixels assigned the **No Data Value** for each band. For example, if the no data value for a specific band is set to `0`, any pixels with this value will not appear in the visualization.

For **RGB rasters**, the no data value must match across all three bands (red, green, and blue) for a pixel to be ignored. For instance, if the no data values are set to `0` for these bands, the corresponding pixel will be excluded from rendering only when all three bands have a value of `0`.

Learn more about data preparation and no data value assignment in this [section](/carto-user-manual/data-explorer/importing-data/importing-rasters).


# Zoom to layer

You can use the Zoom to layer functionality in Builder to zoom your map to display all the features of a layer. This helps you quickly locate your layer, speeding up your exploration journey.

<figure><img src="/files/cSvVTUJncfbUUoBsWi5U" alt=""><figcaption></figcaption></figure>

## **Accessing zoom to layer**

The Zoom to Layer feature can be accessed from the Layer Card and Layer Panel for Editors, and from the legend for both Editors and Viewers.

<figure><img src="/files/RUfCgaaCICMEkwcb86zC" alt=""><figcaption></figcaption></figure>

\
If your layer features have been filtered by Widgets or SQL Parameters, the zoom will always account for this filtering, allowing you to easily focus on the selected features.

{% hint style="info" %}
**Limitations**

Please note that Zoom to layer is not supported for H3 spatial indexes in **PostgreSQL** and **Redshift**. Additionally, it is not supported for **Databricks** sources.

Zooming to layers linked to **spatial index sources** (H3 or Grid) and **pre-generated tileset** sources won't take into account the widget filtering status.

When a **parameter control combination** does not return any values, the Zoom to layer functionality will not work and will return an error message.
{% endhint %}

## Switching layer visibility

The eye icon in the Layer Card, Layer Panel, and Legend allows users to easily toggle layers on or off. For maps with many layers, the "Show only this/Show all layers" functionality is particularly useful. It enables you to switch off all other layers or make them all visible if only one layer is currently displayed.

<figure><img src="/files/m5zr8OxORDGvSWCEPZE8" alt=""><figcaption></figcaption></figure>


# Widgets

In Builder, widgets empower users to dynamically explore data, leading to rich visualizations. They also serve to filter data based on the map viewport and interconnected widgets.

Below are the current type of Widgets available to customize your visualization and enable a richer interaction with your data:

* [**Formula Widget**](/carto-user-manual/maps/widgets/formula-widget): Shows aggregated numerical data as a single metric.
* [**Category Widget**](/carto-user-manual/maps/widgets/category-widget): Segments data into distinct categories displaying aggregated metrics.
* [**Pie Widget**](/carto-user-manual/maps/widgets/pie-widget): Visualizes categorical data by displaying the proportion of each category relative to the whole data set.
* [**Histogram Widget**](/carto-user-manual/maps/widgets/histogram-widget): Shows the frequency distribution across equal bins in the data range.
* [**Range Widget**](/carto-user-manual/maps/widgets/range-widget): Shows a specific range of numerical data adjustable via slider or input values.
* [**Time Series Widget**](/carto-user-manual/maps/widgets/time-series-widget)**:** Shows the frequency distribution aggregated by a temporal period. It also allows to create animated maps.
* [**Table Widget**](/carto-user-manual/maps/widgets/table-widget): Displays tabular data for easy viewing and interaction.

{% hint style="info" %}
Time Series Widget is not supported for raster or pre-generated tilesets sources.

Table Widget is not supported for raster sources.
{% endhint %}

### Adding a Widget

Add a widget to Builder by clicking "New Widget" and select your data source.

<figure><img src="/files/fSN978BEmV6vXe8BemN4" alt=""><figcaption></figcaption></figure>

Then, select a widget type from the menu: *Formula,* *Category*, *Histogram*, *Range*, *Time Series* or *Table*.

<figure><img src="/files/ntQkb7e9G8bqpuwVqzLr" alt=""><figcaption></figcaption></figure>

### Configuring a Widget

Once you have selected the widget type of your preference, you are ready to configure your Widget.

### Widget Data

In the Data section of the Widget configuration, choose an aggregation operation `COUNT`, `AVG`, `MAX`, `MIN` or `SUM` and, if relevant, specify the column on which to perform the aggregation.

<figure><img src="/files/DQcsbCEG730XsttpsvOb" alt=""><figcaption><p><em>Selecting an operation</em></p></figcaption></figure>

{% hint style="info" %}
When working with **pre-generated tilesets**, please ensure your data have a unique identifier named *`geoid`* for correct Widgets calculations.
{% endhint %}

### Widget Display

Using the **Formatting** option, you can auto-format data, ensuring enhanced clarity. For instance, you can apply automatic rounding, comma-separations, or percentage displays.

<figure><img src="/files/qY0xuQo1Y9UXO8j0khMr" alt=""><figcaption><p><em>Formatting selector on Widget configuration</em></p></figcaption></figure>

You can use **Notes** to supplement your Widgets with descriptive annotations which support [Markdown syntax](https://www.markdownguide.org/basic-syntax/), allowing to add text formatting, ordered lists, links, etc.

<figure><img src="/files/9jK1AZ0LfvUVT8azMs0s" alt=""><figcaption><p><em>Adding a rich note using markdown</em></p></figcaption></figure>

### Widget Behavior

Widgets offer two distinct modes of operation: "Global" and "Viewport".

**Global Mode**

By default widgets are calculated in global mode where information is displayed for the full data source. This option does not take into account the viewport extent of the data.

**Viewport Mode**

You can configure widgets to work in viewport mode, meaning the data gets updated when the viewport extent changes.

For dynamic tiling sources, viewport widgets get the data by performing a SQL query to the data warehouse; whereas, if you are working with pre-generated tilesets, viewport widgets work with the data that has been downloaded for visualization which is available locally in the browser.

{% hint style="info" %}
Please be aware that **global mode is not supported for pre-generated** **tileset** sources. In such scenarios, the functionality defaults to viewport mode. This means that all calculations are based on the extent of the map's current viewport.
{% endhint %}

**Cross-filtering**

Some widgets support **cross-filtering**, allowing them to filter not only themselves but also other components on the map. When enabled, the widget can apply filters across:

* A **single source** (default behavior), affecting all layers and widgets connected to that source.
* **Multiple sources**, as long as they share the same filtering property (e.g., region, category, or timestamp).

When **cross-filtering is disabled** for a widget, it becomes read-only: it still displays aggregated data but cannot trigger any filtering actions on the widget itself or related components. This behavior can be toggled on or off per widget using the **cross-filtering toggle** in the widget configuration panel.

<figure><img src="/files/qD8fir2ImxFcVyTZOBt0" alt=""><figcaption></figcaption></figure>

{% hint style="info" %}
**Limitations**

The **Time Series widget** supports cross-filtering across multiple sources **only over the temporal property**. Split by property is not supported.

Only **one Range widget per map** using a specific property can be configured to cross-filter across multiple sources.
{% endhint %}

**Collapsing widgets**

In the Behavior section of Builder, you have the option to make Widgets **collapsible**, allowing them to be hidden when needed. Additionally, widgets can be set to **automatically collapse** when their associated layers are not visible.

{% hint style="info" %}
As Widget settings differ between widget types, please visit the individual widget's documentation page for more detailed information.
{% endhint %}


# Formula widget

Formula Widget allows you to derive Key Performance Indicators (KPIs) and metrics by performing operations directly from your source data.

<figure><img src="/files/a9duJnt2xt3b0bWBXkFv" alt=""><figcaption><p><em>Using Formula Widgets in Builder</em></p></figcaption></figure>

### Widget Data

When configuring the Formula Widget calculations, you have the flexibility to choose in the Data section from a *provided aggregation list* or to set a *custom aggregation*.

The *provided aggregation list* options include `COUNT`, `AVG`, `MAX`, `MIN`, and `SUM`, offering a range of commonly used operations. When using these aggregation options, you simply need to specify the field from your data source that you want to aggregate.

<figure><img src="/files/QyodO9IvyEUVqyEUuclE" alt=""><figcaption><p><em>Provided aggregations in Formula Widget</em></p></figcaption></figure>

For more complex and custom calculations, you can select the *custom aggregation* option to create your own SQL Expression. With this option, you can use a wide range of SQL functions, operators and syntax using single or multiple columns from your data source.

<figure><img src="/files/uyoqXSsfmEj2ySxtF2Bg" alt=""><figcaption><p><em>Custom aggregation using SQL Expression</em></p></figcaption></figure>

{% hint style="info" %}
Custom aggregation option in Formula Widget is not available for pre-generated Tilesets.
{% endhint %}

### Widget Display

From the Display options, you can set the **format** of the data displayed in the widget as well as adding **notes** which support [Markdown syntax](https://www.markdownguide.org/basic-syntax/) to provide further context your widget.

<figure><img src="/files/B9TM4ndha9TNj2mjd9yh" alt=""><figcaption><p><em>Using display options to set formatting and add notes</em></p></figcaption></figure>

### Widget Behavior

Within the Behavior section, you can define how your widget operates by choosing between **"Viewport" or "Global" modes**. Additionally, you can make your widgets **collapsible**, allowing you to hide them when needed. Learn more about widget behavior [here](/carto-user-manual/maps/widgets#widget-behaviour).


# Category widget

A Category Widget summarize and compare categorical data using proportional bar lengths to represent values. The longer the horizontal bar, the greater the value it represents.

<figure><img src="/files/7vrGUzK5NzKQgtg4G1IT" alt=""><figcaption><p><em>Category Widget in Builder for United Kingdom insights</em></p></figcaption></figure>

### Widget Data

When configuring the Category Widget, you can either perform a simple `COUNT` operation over your define category field or you can perform an aggregated operation using `AVG`, `MAX`, `MIN`, or `SUM` on your define numeric field for each of the specified categories. For example, you can calculate the SUM population for each land use category.

<figure><img src="/files/cyXm3B3dZ2FVtlx1LW2l" alt=""><figcaption><p><em>Performing an aggregation operation with Category widget</em></p></figcaption></figure>

For more complex and custom calculations, you can select the *custom aggregation* option to create your own SQL Expression. With this option, you can use a wide range of SQL functions, operators and syntax using single or multiple columns from your data source.

<figure><img src="/files/PQuDmQppTpp71jO2IhPV" alt=""><figcaption><p><em>Custom aggregation using SQL Expression</em></p></figcaption></figure>

### Widget Display

From **Display options**, you can adjust the **formatting** of the values displayed. You can also use the **Order by** option to sort values **alphabetically** (ascending or descending) or by **value** (ascending or descending), including aggregated values. The default is **value descending**.

Additionally, you can add notes that support [Markdown syntax](https://www.markdownguide.org/basic-syntax/) to provide further context to users.

<figure><img src="/files/VDLFq5z8xA9hxFx26fML" alt=""><figcaption></figcaption></figure>

### Widget Behavior

Within the "Behavior" section, you can define how your widget operates: choose between **"Viewport" or "Global" modes**. Additionally, you can make your widgets **collapsible**, allowing you to hide them when needed.

You can also enable or disable the widget’s filtering capability using the **cross-filtering** toggle icon. When enabled, the widget can filter itself and other components connected to the **same data source** or across **multiple sources** if they share the same property.

Learn more about widget behavior [here](/carto-user-manual/maps/widgets#widget-behaviour).


---

[Next Page](/llms-full.txt/1)