> For the complete documentation index, see [llms.txt](https://docs.carto.com/llms.txt). Markdown versions of documentation pages are available by appending `.md` to page URLs; this page is available as [Markdown](https://docs.carto.com/whats-new/q3-2026.md).
# Q3 2026
New features and improvements introduced from July to September 2026
{% updates %}
{% update date="2026-09-23" tags="new,platform" %}
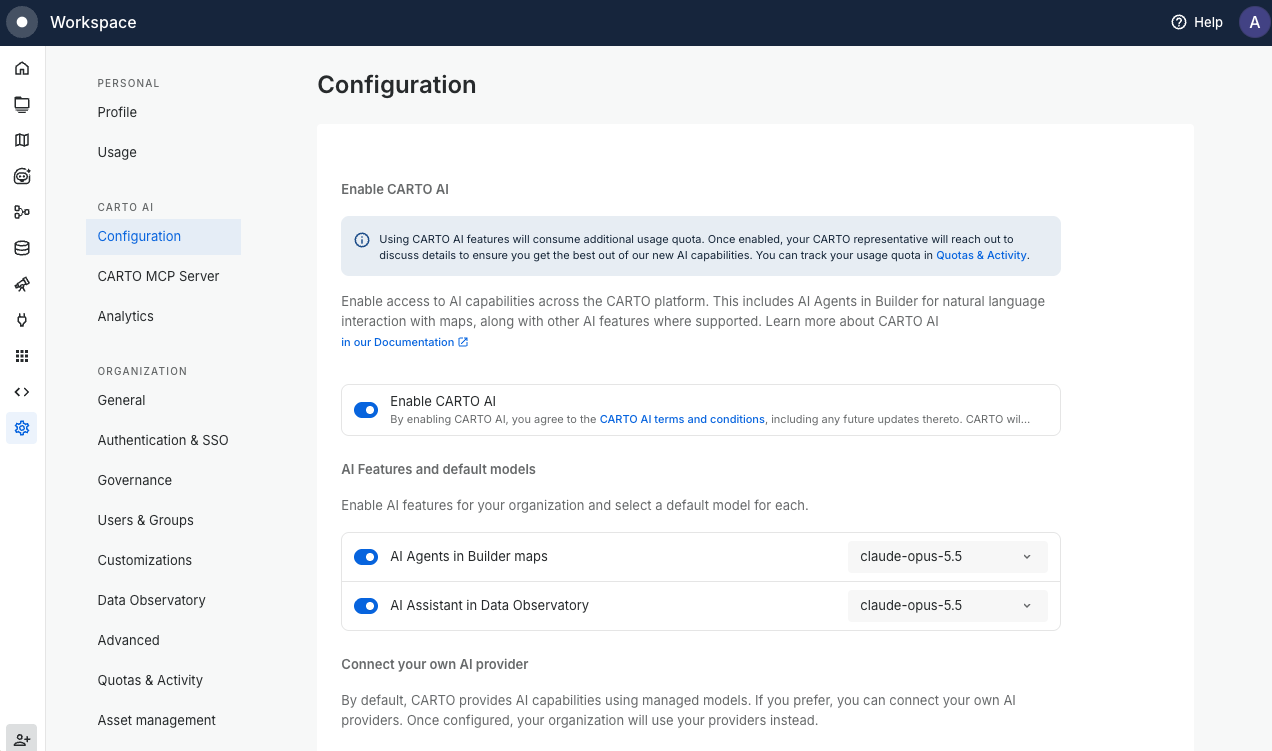
## Claude 5, Gemini 3.8 and GPT-6 Astra are now in CARTO
CARTO AI now offers the newest generation of models, including Claude Opus 5.5 within a day of its launch. The CARTO-managed set adds `claude-sonnet-5`, our new default for geospatial use cases, `claude-opus-5.5`, our most capable model for the hardest geospatial reasoning, and `gemini-3.8-flash` for fast, high-volume interactions.
If you bring your own provider, the newest models are available too. `claude-fable-5.1`, `claude-opus-5` and `claude-sonnet-5` run on Anthropic, Bedrock and Vertex AI, with `claude-opus-5.5` also on Vertex AI. Claude 5 models are available on Databricks as well. `gemini-3.8-flash` runs on Vertex AI, Google AI Studio and Databricks, and `gpt-6-astra` on OpenAI.
Learn more in the [CARTO AI settings](/carto-user-manual/settings/carto-ai.md) documentation.
{% endupdate %}
{% update date="2026-09-21" tags="new,workspace" %}
## Share connections with specific users and groups
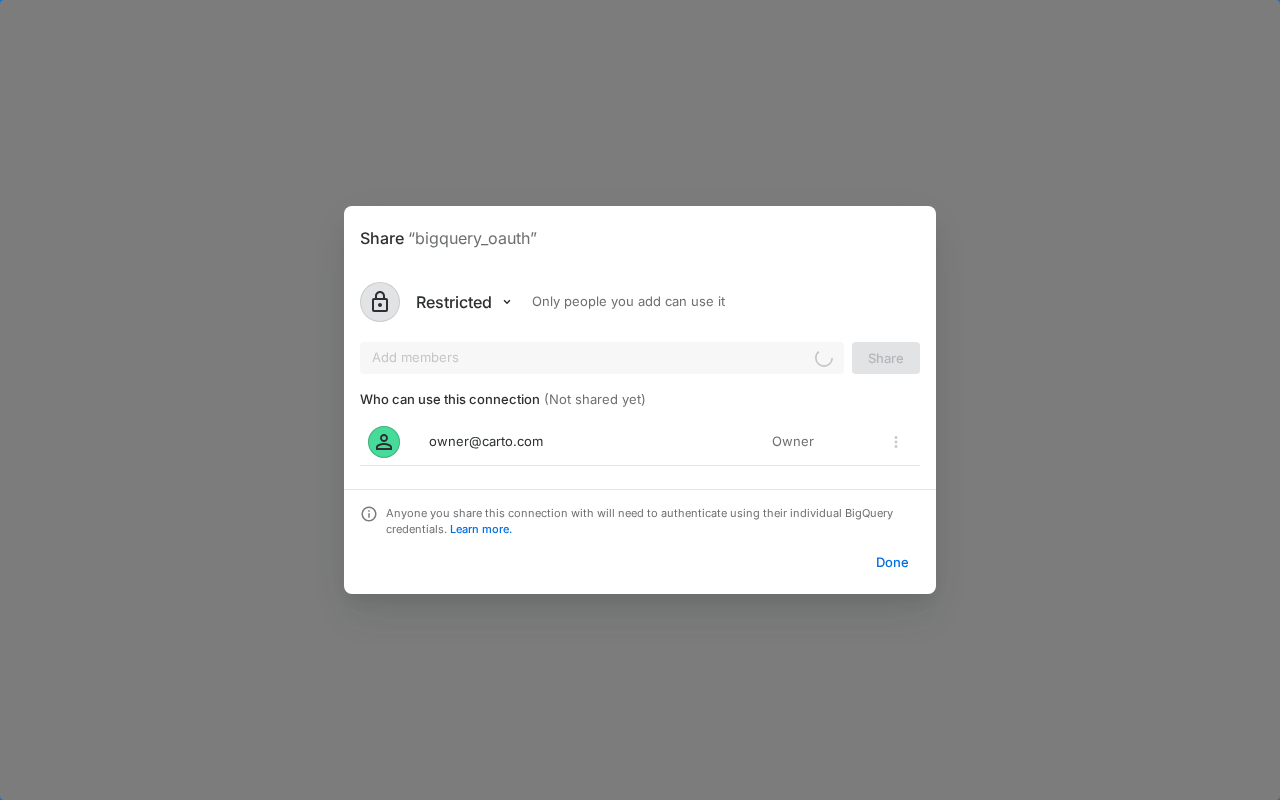
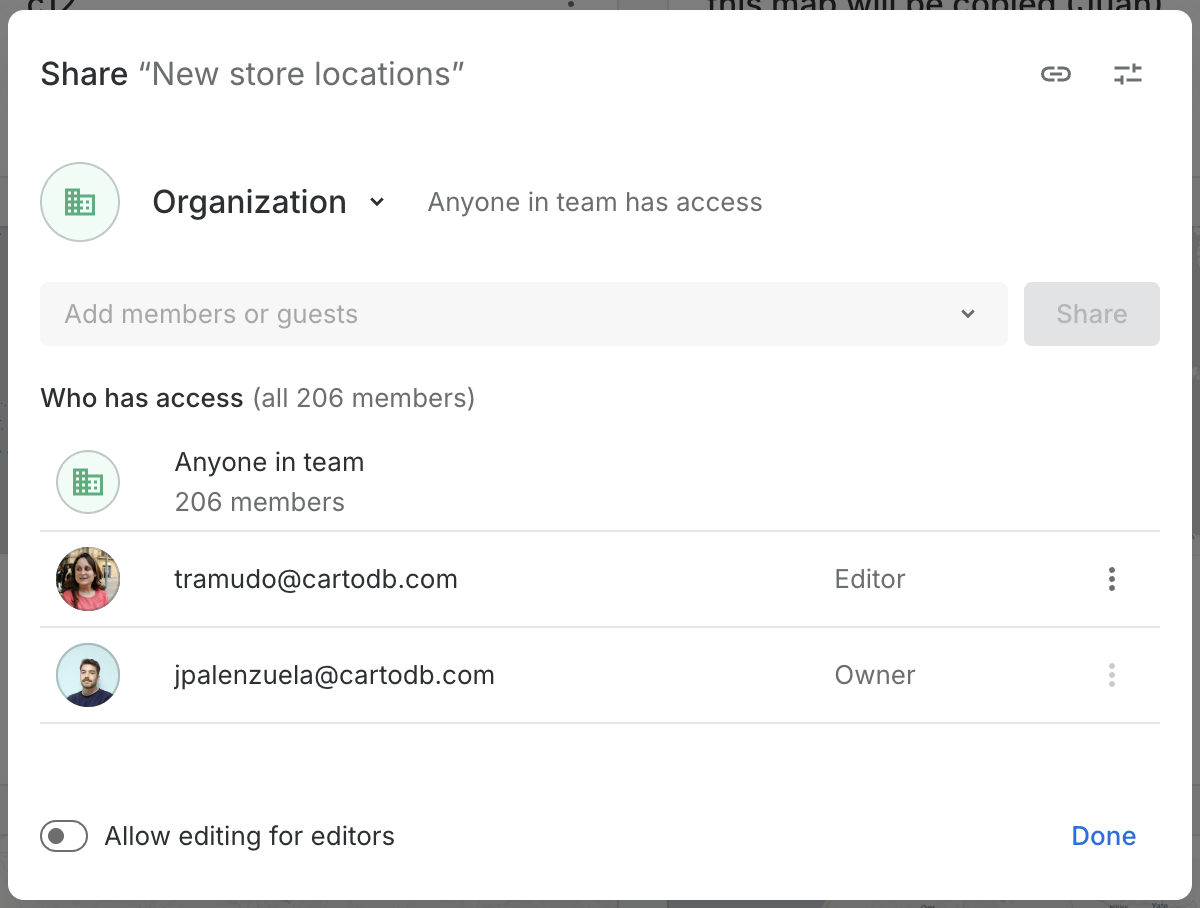
You can now share any connection with specific users or groups, not just with your entire organization, using the same sharing model as maps and workflows.
The dialog also makes clear what sharing means for each connection: recipients either access the data through the identity configured in the connection, or authenticate with their own warehouse credentials.
Learn more in our [Sharing connections documentation](/carto-user-manual/connections/sharing-a-connection.md).
{% endupdate %}
{% update date="2026-09-10" tags="improvement,workflows" %}
## Choose the file format when exporting from Workflows
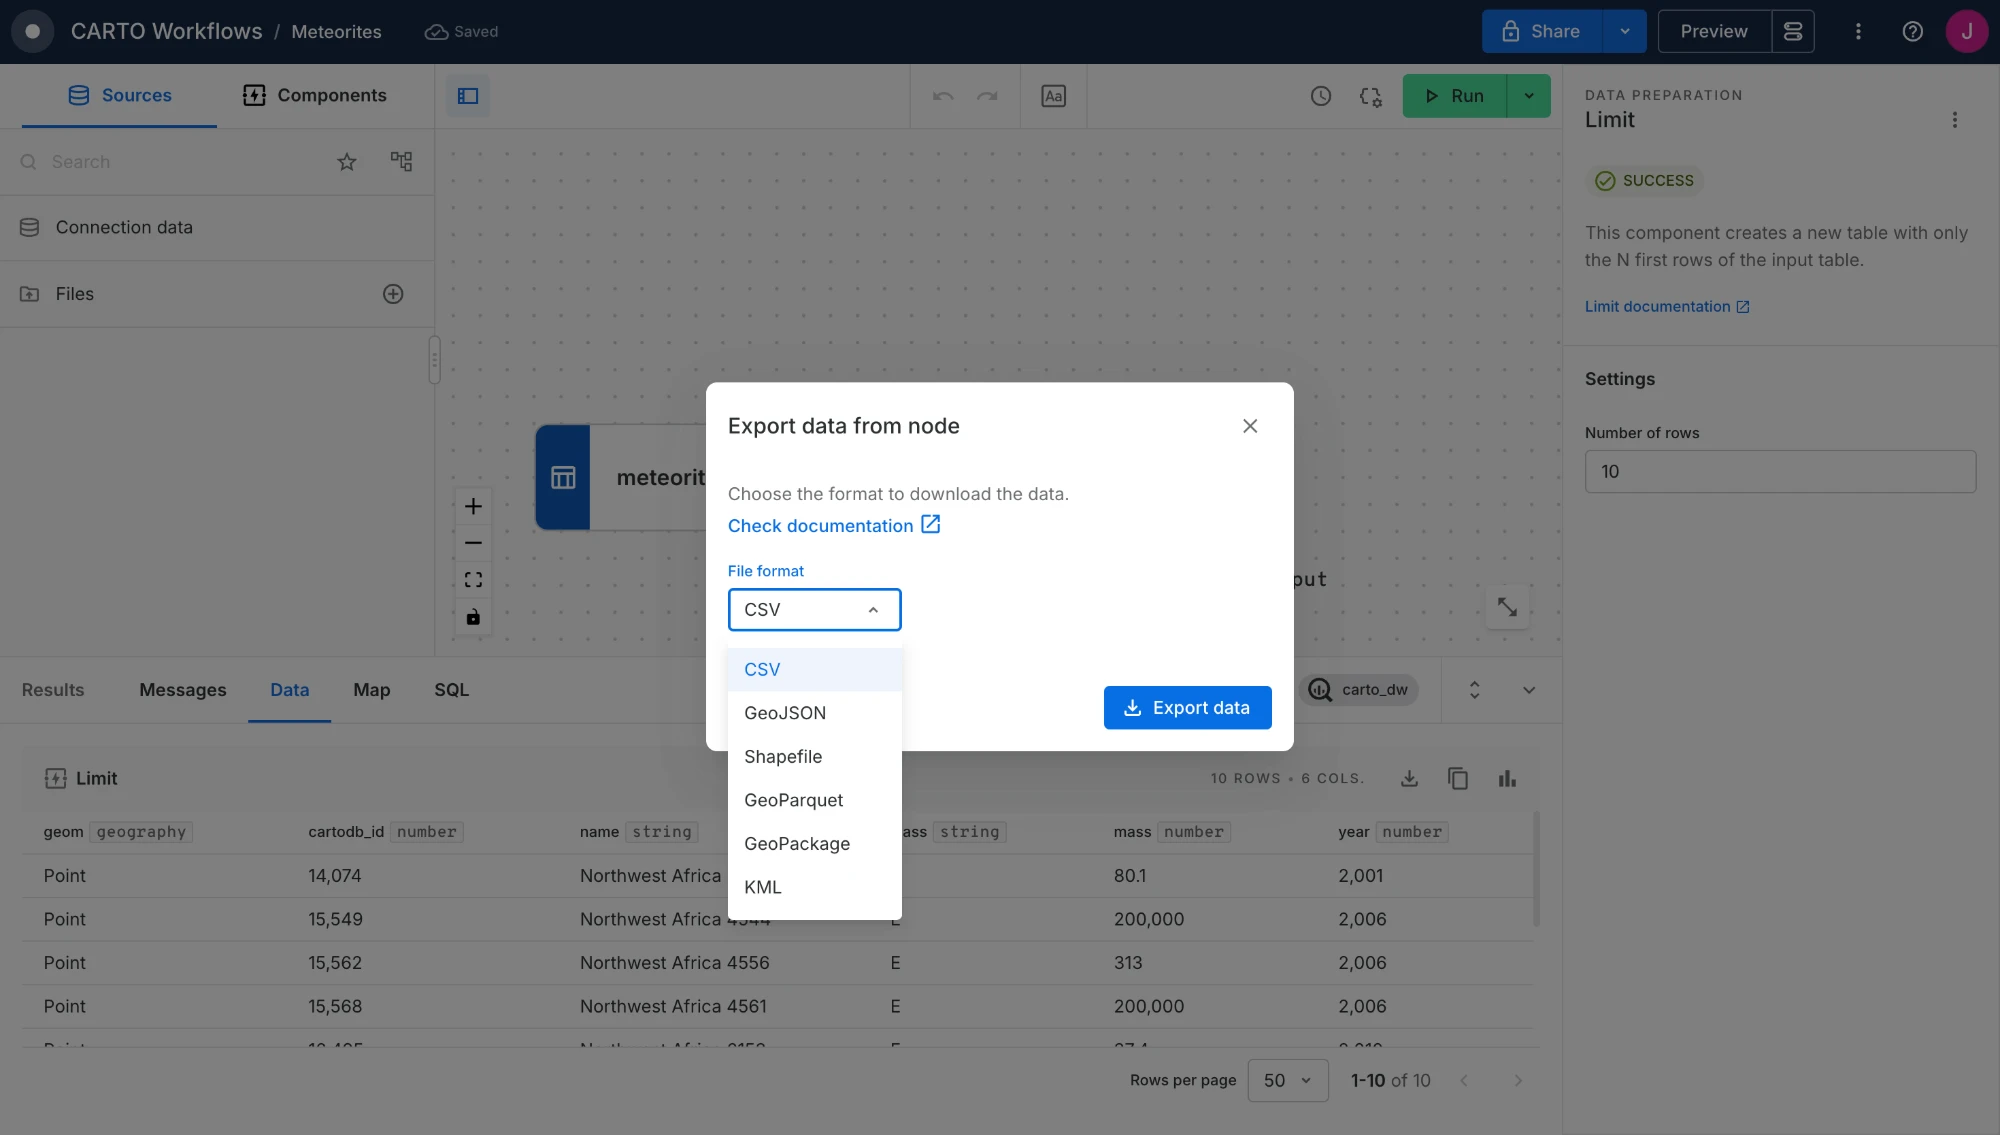
Exporting a node result is no longer limited to CSV. Pick **CSV**, **GeoJSON**, **Shapefile**, **GeoParquet**, **GeoPackage** or **KML** and get a file you can open straight away in desktop GIS, Google Earth or your data pipeline, with no conversion step. These are the same formats available in Builder.
CSV stays selected by default, and Viewers of a shared workflow get the same choice when the Editor allows them to export.
Learn more in our [Exporting data documentation](/carto-user-manual/workflows/exporting-data.md).
{% endupdate %}
{% update date="2026-09-07" tags="new,platform" %}
## Deploy CARTO Self-Hosted on any cloud
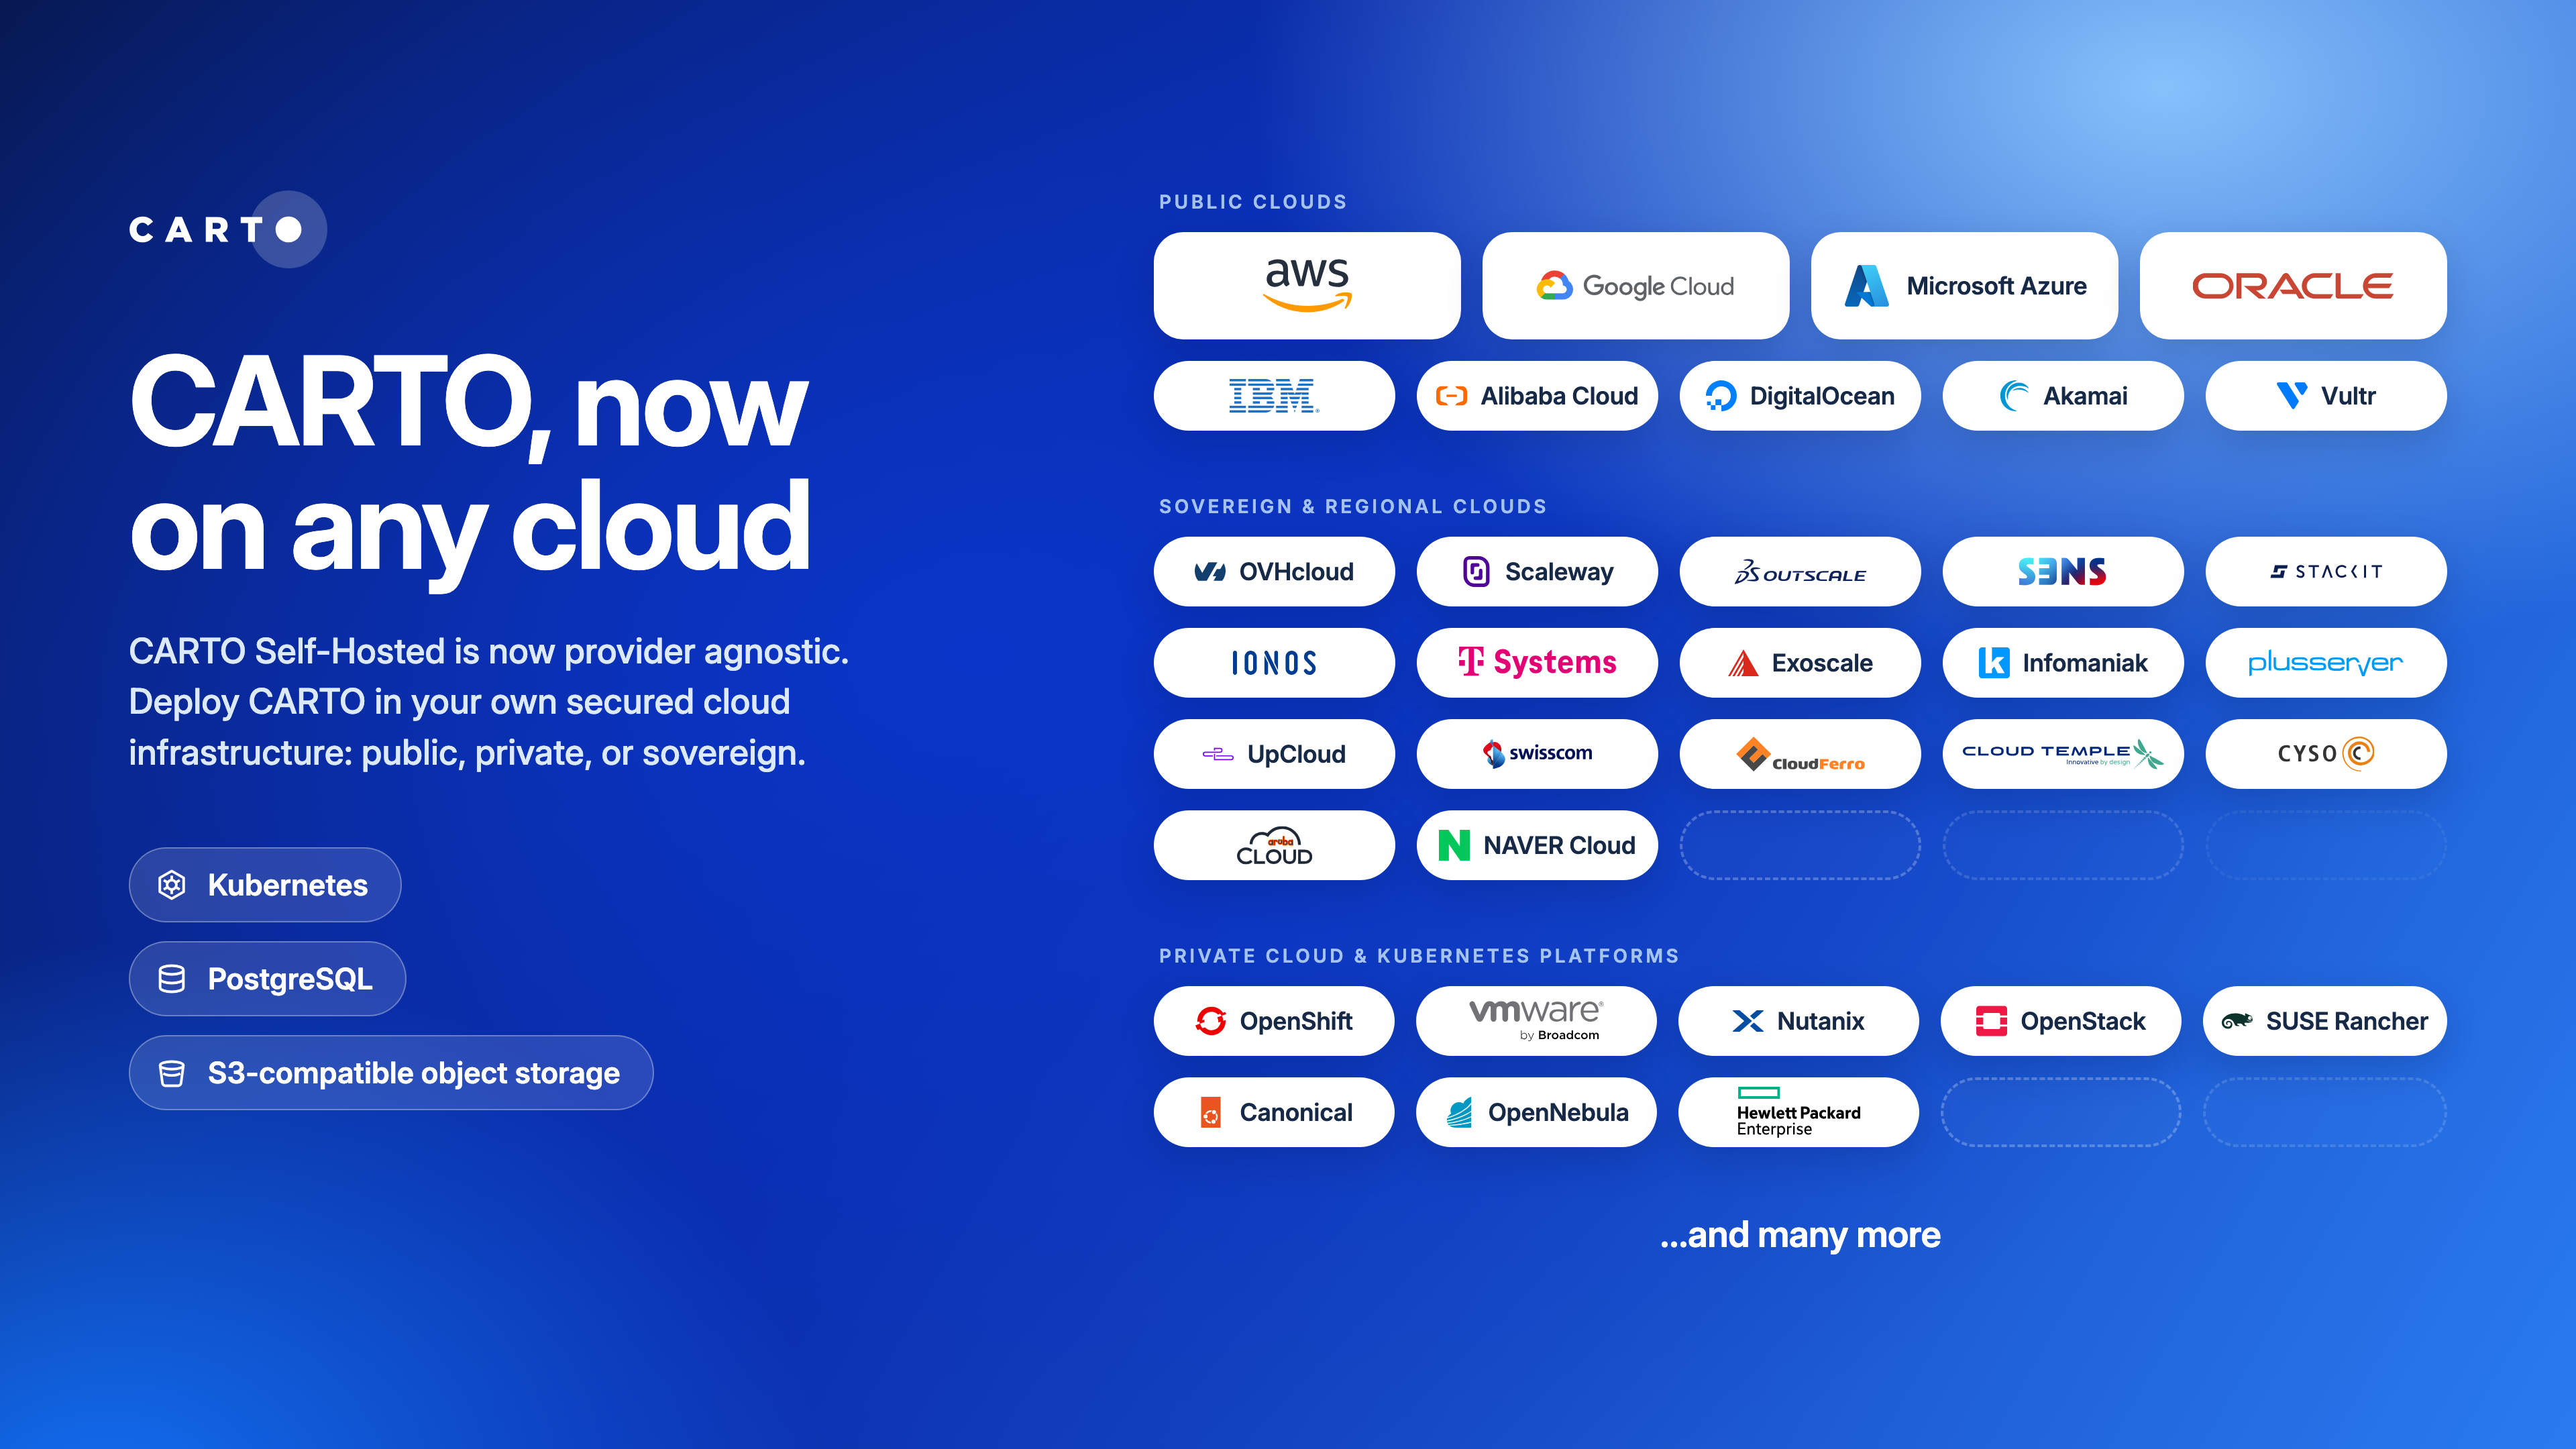
CARTO Self-Hosted is now provider agnostic. Alongside AWS, Google Cloud, Azure, and Oracle Cloud, any infrastructure that provides **standard Kubernetes**, a **PostgreSQL** database, and **S3-compatible object storage** can run a complete CARTO deployment: regional providers such as OVHcloud or Scaleway, **sovereign clouds** operated within national borders, and **private clouds** or on-premises platforms with S3-compatible storage such as Ceph.
This is possible because CARTO Self-Hosted now works with any S3-compatible object storage, so it adapts to the infrastructure you already run. Configuration follows the same steps as before, with a couple of extra fields for your storage endpoint.
This opens CARTO to organizations whose data residency or sovereignty requirements call for infrastructure in a specific jurisdiction or in their own data center.
Available since CARTO Self-Hosted [2026.8.11](https://docs.carto.com/whats-new/pages/bDddXkUezz5UkejnQDMd#2026.8.11). Learn more in our [Object Storage prerequisites](/carto-self-hosted/planning/prerequisites/object-storage.md) and [Configure your own buckets](/carto-self-hosted/configuration/data-and-storage/configure-your-own-buckets.md) documentation.
{% endupdate %}
{% update date="2026-09-03" tags="new,builder" %}
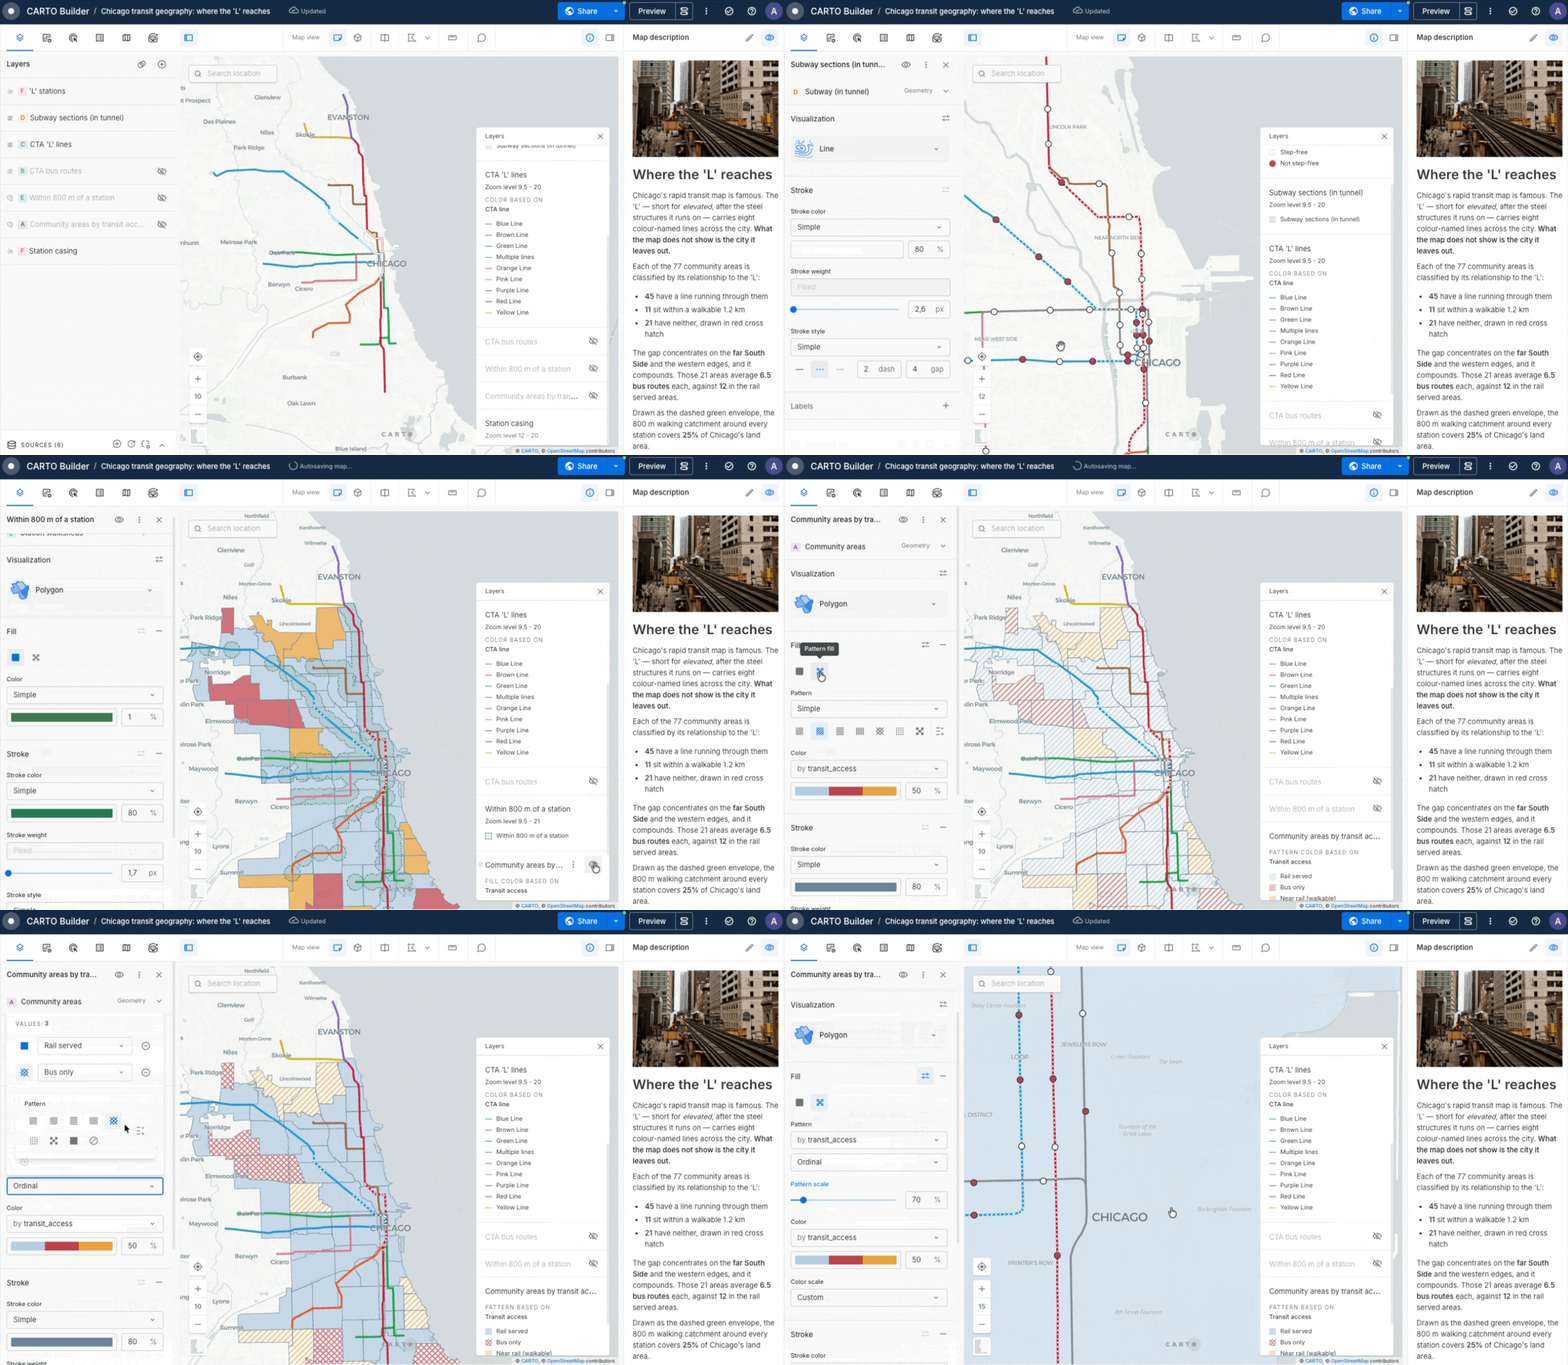
## Dashed strokes and fill patterns in Builder
Your maps are no longer limited to solid lines and flat fills. Line layers and polygon borders can now be drawn as **Solid**, **Dashed** or **Dotted**, with control over the dash and gap lengths, and polygons can be filled with a **pattern** (horizontal or vertical lines, forward or backward diagonals, cross-hatch, dots or checkerboard) at the density and scale you choose.
This unlocks the cartographic conventions your audience already reads: a dashed border for a proposed route or a boundary that is not yet final, hatching for a restricted or protected zone, a pattern for areas where data is missing or uncertain.
Stroke styles and fill patterns are reflected in the legend of your published maps, so the people you share with get the same reading.
Learn more in our [Layer styling documentation](/carto-user-manual/maps/layers.md#stroke-styles).
{% endupdate %}
{% update date="2026-08-26" tags="improvement,carto-for-agents" %}
## All of CARTO, in every agentic platform - via our MCP Server
The CARTO MCP Server now exposes **every CARTO capability as an MCP tool**, so your agents can explore, create, edit and manage all of your CARTO content from the agentic platform your team already uses — no terminal and no coding required.
The tools are organized in four categories:
* **Maps**: create, update, validate, read and render Builder maps.
* **Workflows**: create, run, schedule and inspect Workflows, including Workflows published as MCP tools.
* **Data**: explore connections and tables, run SQL, geocode, create routes and isochrones, and import or export data.
* **Workspace**: manage users, credentials, projects and activity data.
Because MCP is an open standard, the same experience is available across **Claude, ChatGPT, Microsoft Copilot Studio, Gemini Enterprise, Snowflake Cowork, Databricks Agents, Oracle**, and any other MCP-compatible host.
Governance is unchanged: every tool call goes through the same platform APIs, with the user's own credentials, so existing roles, permissions and row-level security in your data warehouse still apply — if a user can't edit a map, neither can their agent. Your data never leaves the warehouse, and every action is logged and attributable in your Activity Data.
To get started, connect the [CARTO MCP Server](/carto-for-agents/mcp-server.md) to your platform following our connection guides, and pair it with our [CARTO Agent Skills](/carto-for-agents/agent-skills.md) to bring geospatial expertise along with the capabilities.
{% endupdate %}
{% update date="2026-08-21" tags="new,workspace" %}
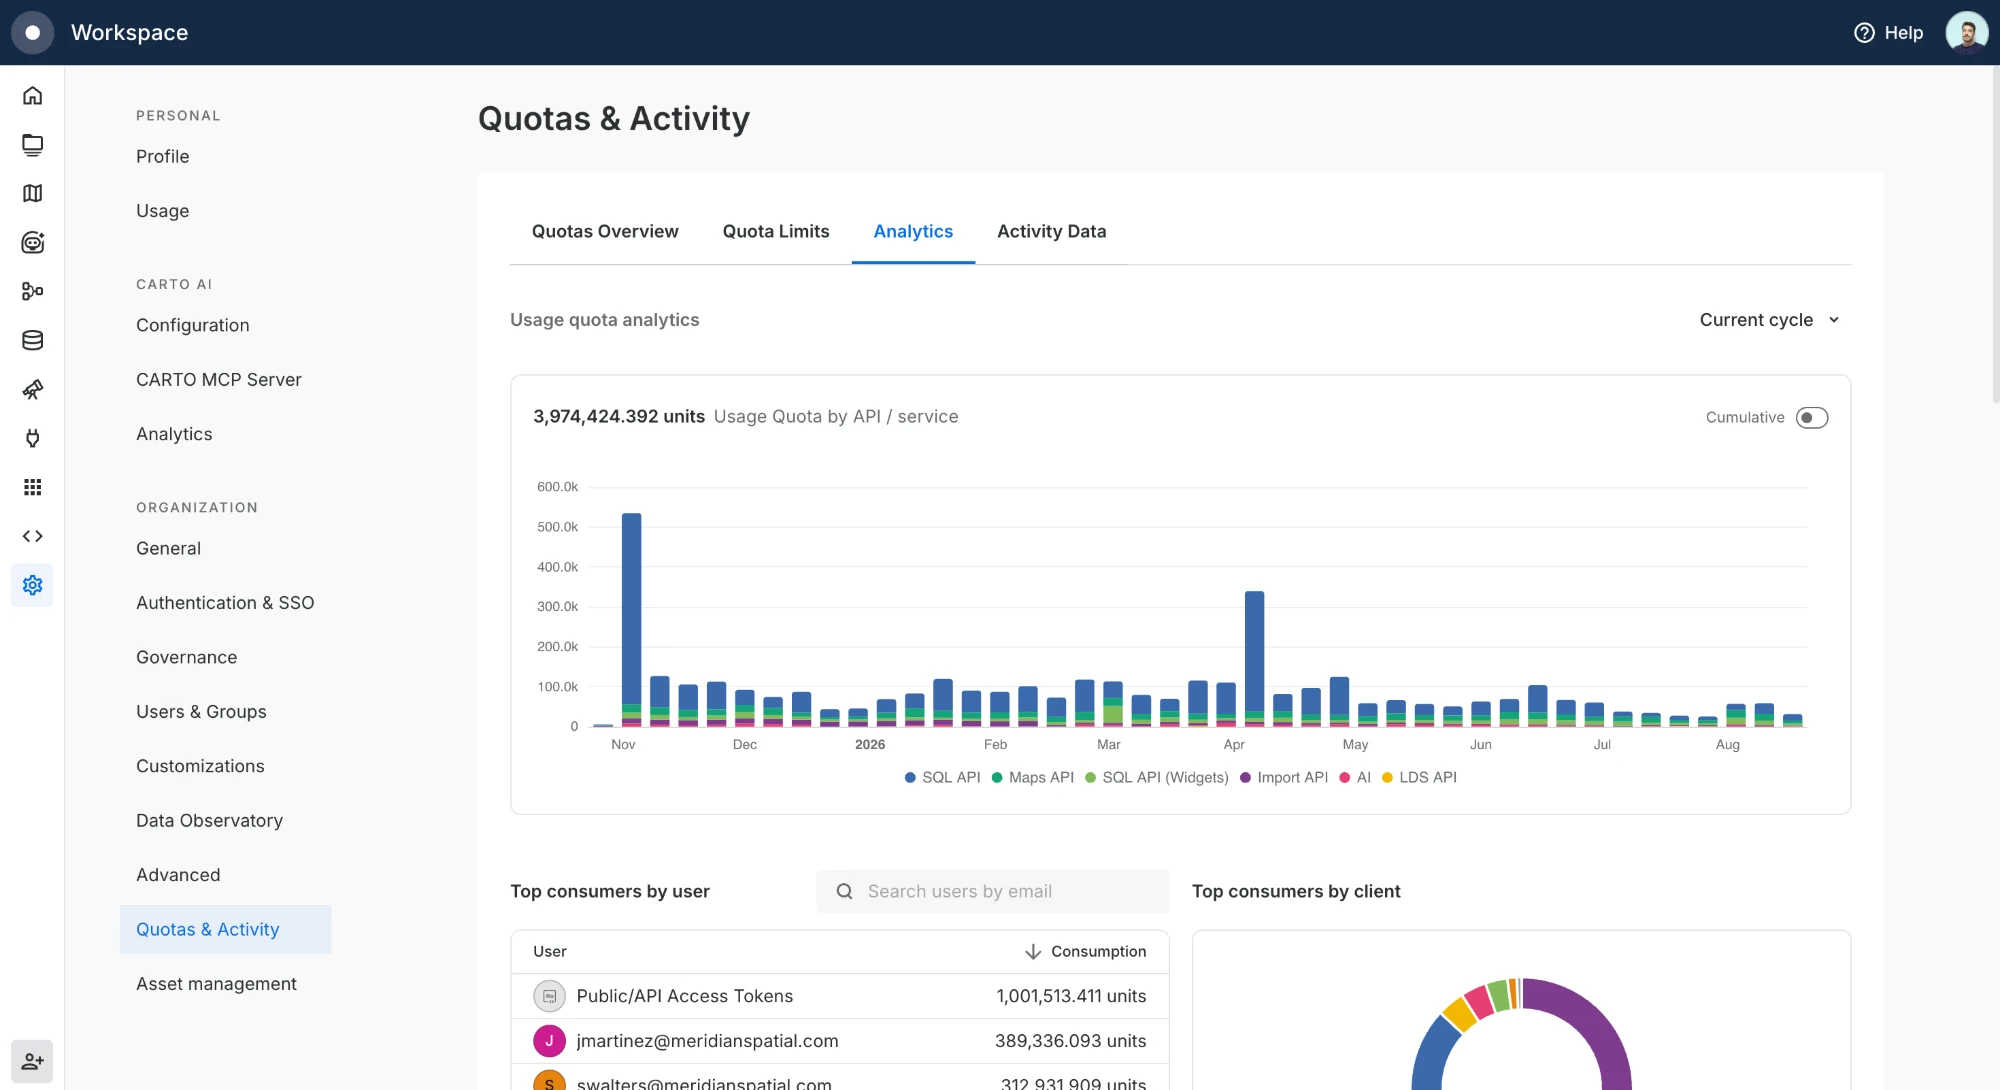
## Analyze your Usage quota consumption without exporting data
The new **Analytics** tab in **Settings > Quotas & Activity** gives Admins a visual breakdown of how the organization is consuming its Usage quota, right in the Workspace.
See consumption over time, per period or cumulative, stacked by CARTO API/service, for the time frame you choose. Ranked tables surface your top consumers by user, client, map, and workflow, each searchable by name, and clicking a period in the chart scopes those tables to that window.
Learn more in our [Usage analytics documentation](/carto-user-manual/settings/quotas-and-rate-limits/usage-analytics.md).
{% endupdate %}
{% update date="2026-08-06" tags="new,workspace" %}
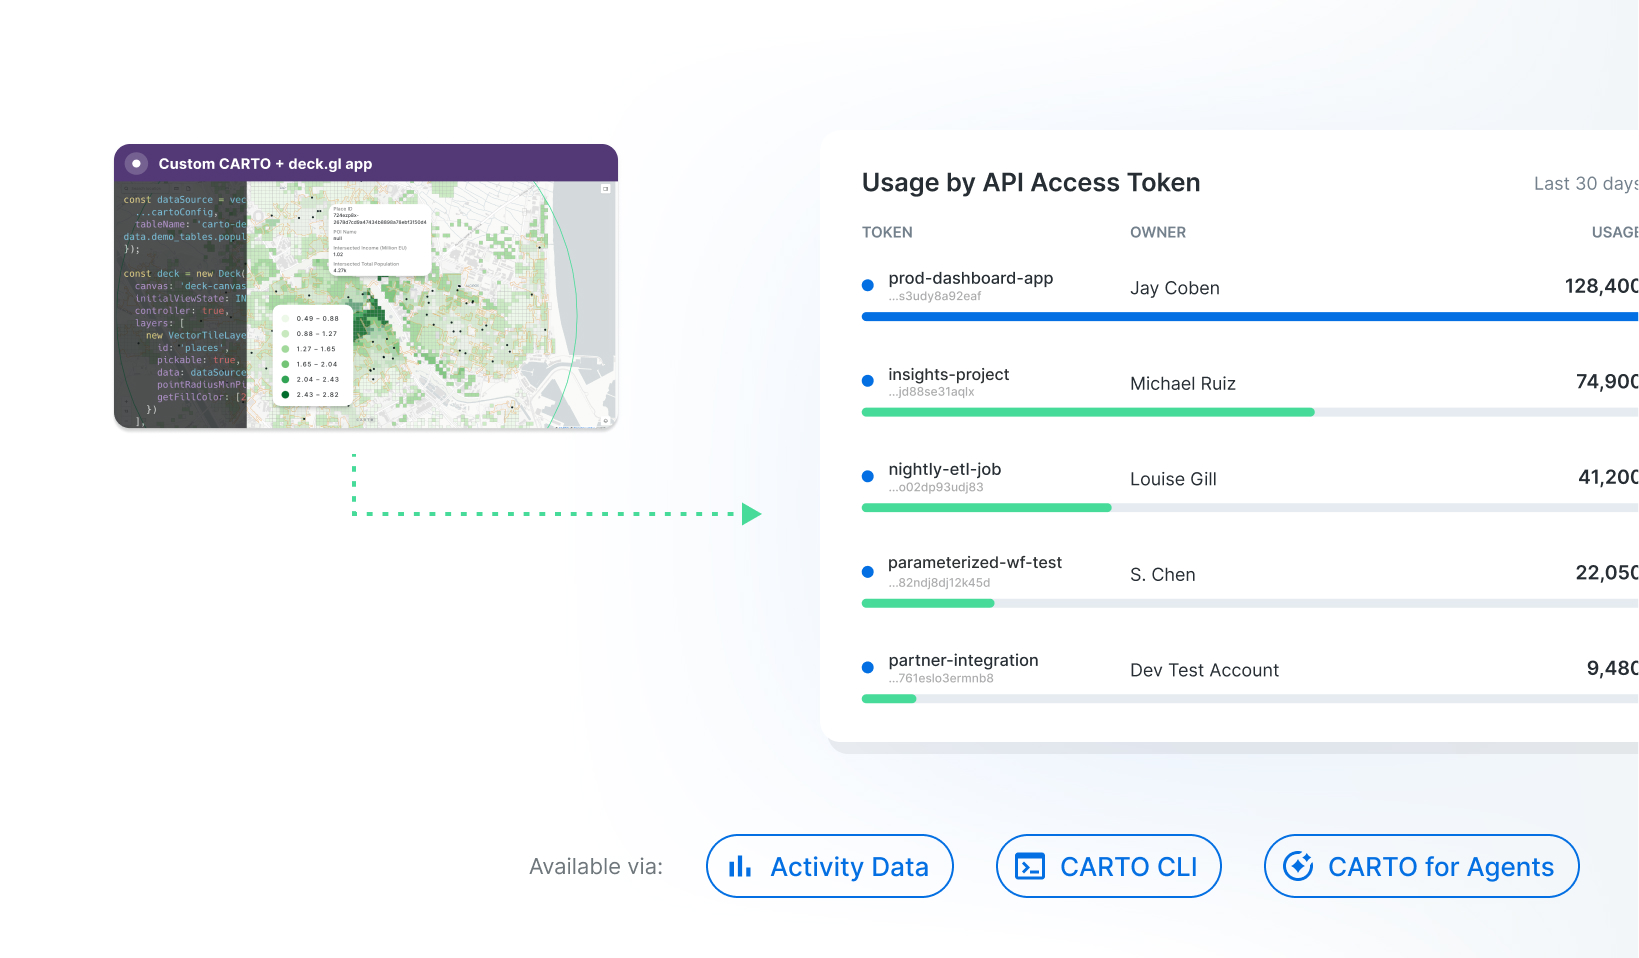
## See which API Access Token is consuming your quota
Usage from [API Access Tokens](/carto-user-manual/developers/managing-credentials/api-access-tokens.md) is now attributed to the token that produced it, instead of being lumped together as `public` traffic.
In the [API Usage](/carto-user-manual/settings/activity-data/activity-data-reference.md#api-usage) table of your Activity Data, requests made with a token now report a `user_id` like `token:_`, so you can **tell at a glance which integration, script, or application is driving your Usage Quota** — and tie consumption back to a specific team or project. As with the rest of your Activity Data, you can explore it in the Workspace, through the CARTO CLI, or with CARTO for Agents.
Learn more in the [API Usage reference](/carto-user-manual/settings/activity-data/activity-data-reference.md#api-usage).
{% endupdate %}
{% update date="2026-08-05" tags="new,workspace" %}
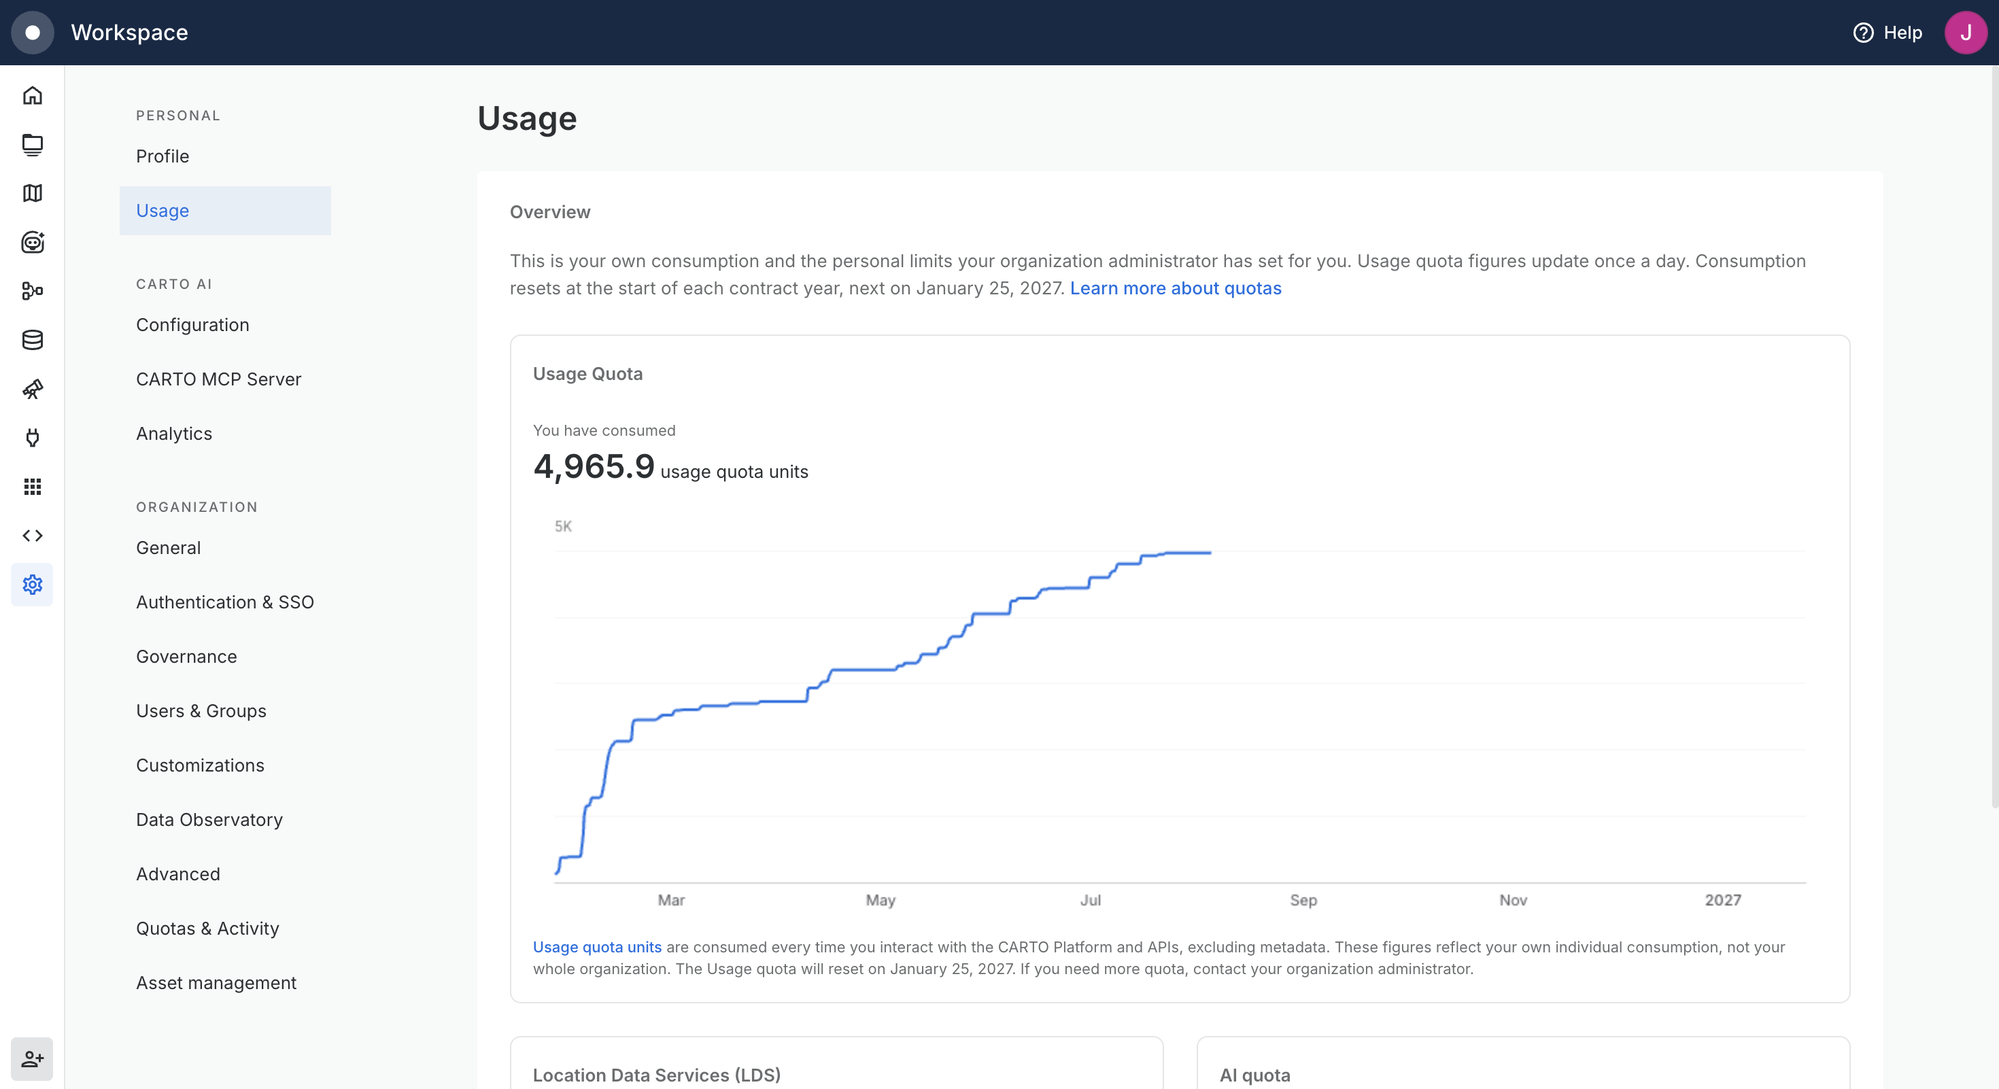
## Personal settings for all users
You can now manage your CARTO account and track your own consumption from the new **Personal** section of the Settings.
In **Profile** you'll find your account details, and you can change your password or delete your user. In **Usage** you can track your individual consumption of the Usage, LDS, and AI quotas, along with any limit your Admin has set for you.
Learn more in our [Personal settings documentation](/carto-user-manual/settings/personal-settings.md).
{% endupdate %}
{% update date="2026-08-05" tags="new,workspace" %}
## Automatic user and group provisioning with SCIM
Organizations using Single Sign-On can now provision users and groups automatically with **SCIM**. Your Identity Provider pushes changes to CARTO as they happen, so users exist before their first login, group changes apply right away, and users unassigned in your IdP lose access immediately instead of at their next login attempt.
This also applies to [group role mapping](/carto-user-manual/settings/users-and-groups/mapping-groups-to-user-roles.md), so a move between groups grants the new role without waiting for a login. SCIM is set up by our Support Team on top of an existing SSO integration, and is available for **Enterprise Large** plans and above.
Learn more in our [SCIM provisioning documentation](/carto-user-manual/settings/users-and-groups/scim-provisioning.md).
{% endupdate %}
{% update date="2026-07-29" tags="private-beta,data-observatory" %}
## PlacePulse Embeddings: a fingerprint for every place in the US
PlacePulse Embeddings, a Geospatial Foundation Model built by CARTO with [Applied Geographic Solutions (AGS)](https://appliedgeographic.com/), encodes the characteristics of a place into a single 256-dimensional vector, one for every **H3 Resolution 7** cell across the entire US. Demographics, local economy, business mix, built environment and climate risk, all compressed into one fingerprint per place.
Distributed through the Data Observatory and ready to use with the Analytics on Embeddings components in Workflows: twin areas, white space, segmentation, or ready-made features for a predictive model. Currently in **private preview** for a selected group of customers. Read the [blog post](https://carto.com/blog/placepulse-embeddings-fingerprint-every-place-us/) or [request early access](https://docs.google.com/forms/d/e/1FAIpQLSehAncVLjxLLcgyK8Ha5__l803lbtWMxKgH15LCfUhIHFS0ww/viewform?usp=dialog).
{% endupdate %}
{% update date="2026-07-28" tags="new,builder" %}
## Export your Builder maps as high-resolution images
You can now export your Builder map as a high-resolution PNG, ready to use in reports, slide decks, brochures, and print publications.
Choose the exact image dimensions you need, and Builder will generate the export at that size, keeping labels, lines, and symbols sharp.
The exported image captures your current map view, including the visible layers and basemap. You can also allow end users of shared and public maps to export images themselves.
Learn more in our [Exporting map images documentation](/carto-user-manual/maps/exporting-map-images.md).
{% endupdate %}
{% update date="2026-07-24" tags="new,workflows" %}
## Test your MCP Tools before agents call them
You can now test a Workflow-backed **MCP Tool** directly from the canvas, running it exactly as an AI Agent would — before you enable it or wire it into an agent. Open the **Run** dropdown and choose **Run MCP Tool test** to execute the tool through the same CARTO MCP Server path a real agent uses.
Enter test values in the input parameters popover (pre-filled from your workflow variables), then watch the run stream step by step in the Messages tab. For **Sync** tools you get the response immediately; for **Async** tools you see the full job submission, status polling, and result retrieval an agent goes through. The response is rendered as expandable JSON with row count and execution time, so you can preview the exact output, understand timing, and copy it to write better tool descriptions and agent instructions. A session-scoped Run history keeps every test run, including failures, so debugging no longer means guessing from a live agent.
Learn more in the [Workflows as MCP Tools](/carto-user-manual/workflows/workflows-as-mcp-tools.md#test-your-mcp-tool) documentation.
{% embed url="" %}
{% endupdate %}
{% update date="2026-07-21" tags="new,builder" %}
## Give your AI Agents spatial and business context with semantic models
You can now add a **semantic model** to an AI Agent, a structured layer of business meaning over your data. It tells the Agent what your tables and columns mean, how your datasets relate, how your metrics are calculated, and how your spatial data is structured, so the Agent writes correct SQL and applies your definitions consistently. It builds on the open [Apache Ossie](https://ossie.apache.org/) standard with a CARTO extension for geospatial fields. You can write it in Builder, import an existing YAML, or let the Agent Config Assistant generate it from your data.
Learn more in our [Semantic model documentation](/carto-user-manual/ai-agents/semantic-model.md).
{% endupdate %}
{% update date="2026-07-20" tags="new,workflows" %}
## Revamped Import/Export components in Workflows
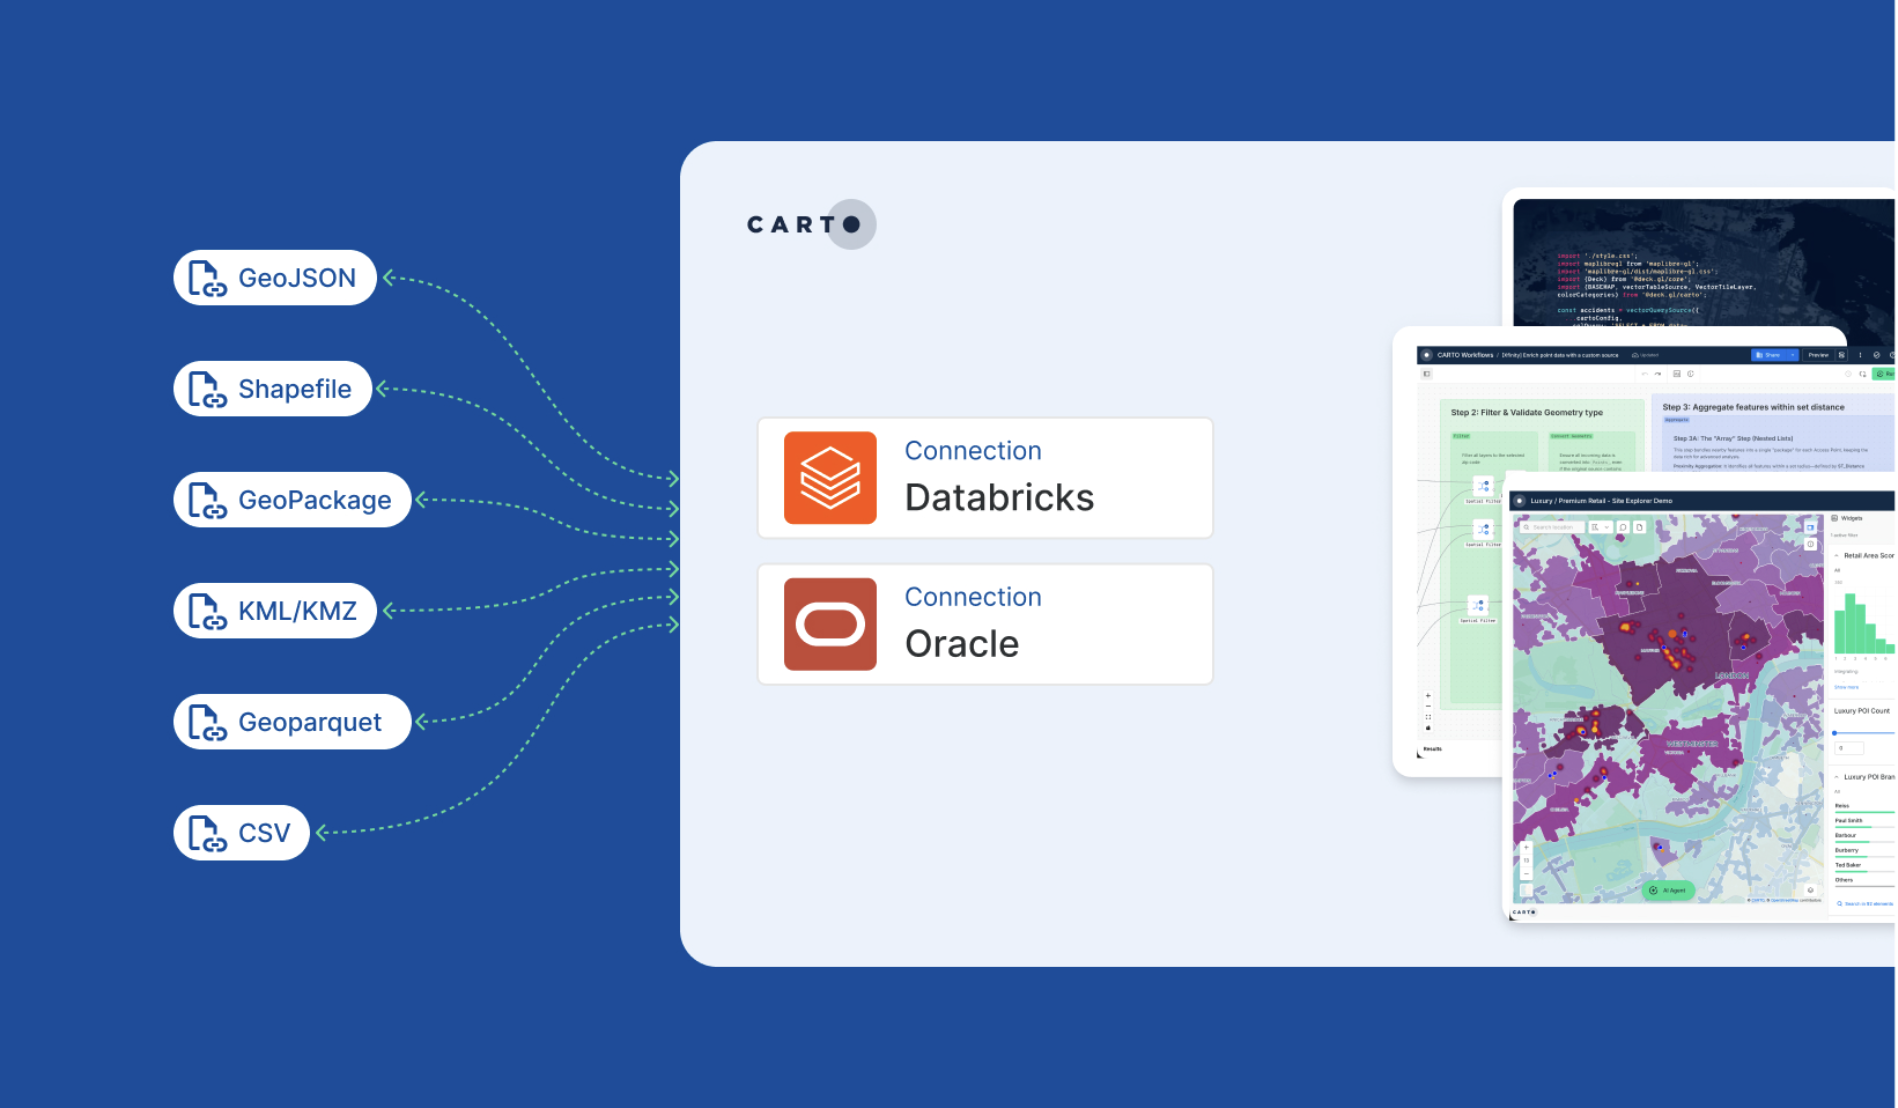
Moving data in and out of Workflows now works across **BigQuery, Snowflake, Redshift, Databricks and Oracle** from the same canvas:
* **Import from URL** and **Import from URL using table** now run on Databricks and Oracle, in addition to BigQuery, Snowflake and Redshift.
* **Export as File** is a new component that exports your table to a presigned download link, with no bucket configuration required, on all of these providers.
* **Export Tables as PDF** turns your workflow results into a shareable PDF report — with a custom title, descriptions and page orientation — on all of these providers.
* **Send by Email** now works across all of these providers too, and can attach a download link to the message.
The previous BigQuery-only export components remain available as **Export to Bucket (Legacy)** and **Send by Email (Legacy)** for your existing workflows.
Under the hood, this adds new **import** and **export** modules to the CARTO Analytics Toolbox for [Databricks](/data-and-analysis/analytics-toolbox-for-databricks/reference/import.md) and [Oracle](/data-and-analysis/analytics-toolbox-for-oracle/sql-reference/import.md).
Learn more in the [Input / Output components](/carto-user-manual/workflows/components/input-output.md) documentation.
{% embed url="" %}
{% endupdate %}
{% update date="2026-07-20" tags="new,platform" %}
## Import and export geospatial data on Databricks and Oracle
You can now import files into your warehouse and export data back out on **Databricks** and **Oracle** connections, just like you already do on BigQuery, Snowflake, Redshift and PostgreSQL. Bring data in from a local file or a URL in Data Explorer, and export your results from Builder and Workflows in the geospatial formats you work with, including CSV, GeoJSON, Shapefile, GeoPackage, KML, GeoParquet and more.
This is powered by our new Import/Export engine, which brings consistent format support across providers with no manual conversion required.
Learn more in the [Importing data](/carto-user-manual/data-explorer/importing-data.md) and [Exporting data](/carto-user-manual/maps/exporting-data.md) documentation.
{% endupdate %}
{% update date="2026-07-16" tags="new,builder" %}
## Filter your data by clicking directly on the map
You can now filter your Builder map by clicking directly on a feature, alongside widgets, parameters, and the selection tool. Filter just the selected feature or, for polygons, H3, and Quadbin cells, use the clicked feature as a spatial mask to filter all intersecting layers at once. Click-based filters automatically propagate to widgets, PDF exports, and viewport data exports, just like any other filter.
Click a postcode or region to instantly update population and other metrics in your widgets, or click individual stores, assets, or sensors to isolate and export only those features.
Learn more in our [Interactions documentation](/carto-user-manual/maps/interactions.md#filter-by-feature).
{% endupdate %}
{% update date="2026-07-14" tags="new,builder" %}
## Manage your organization's custom markers in one place
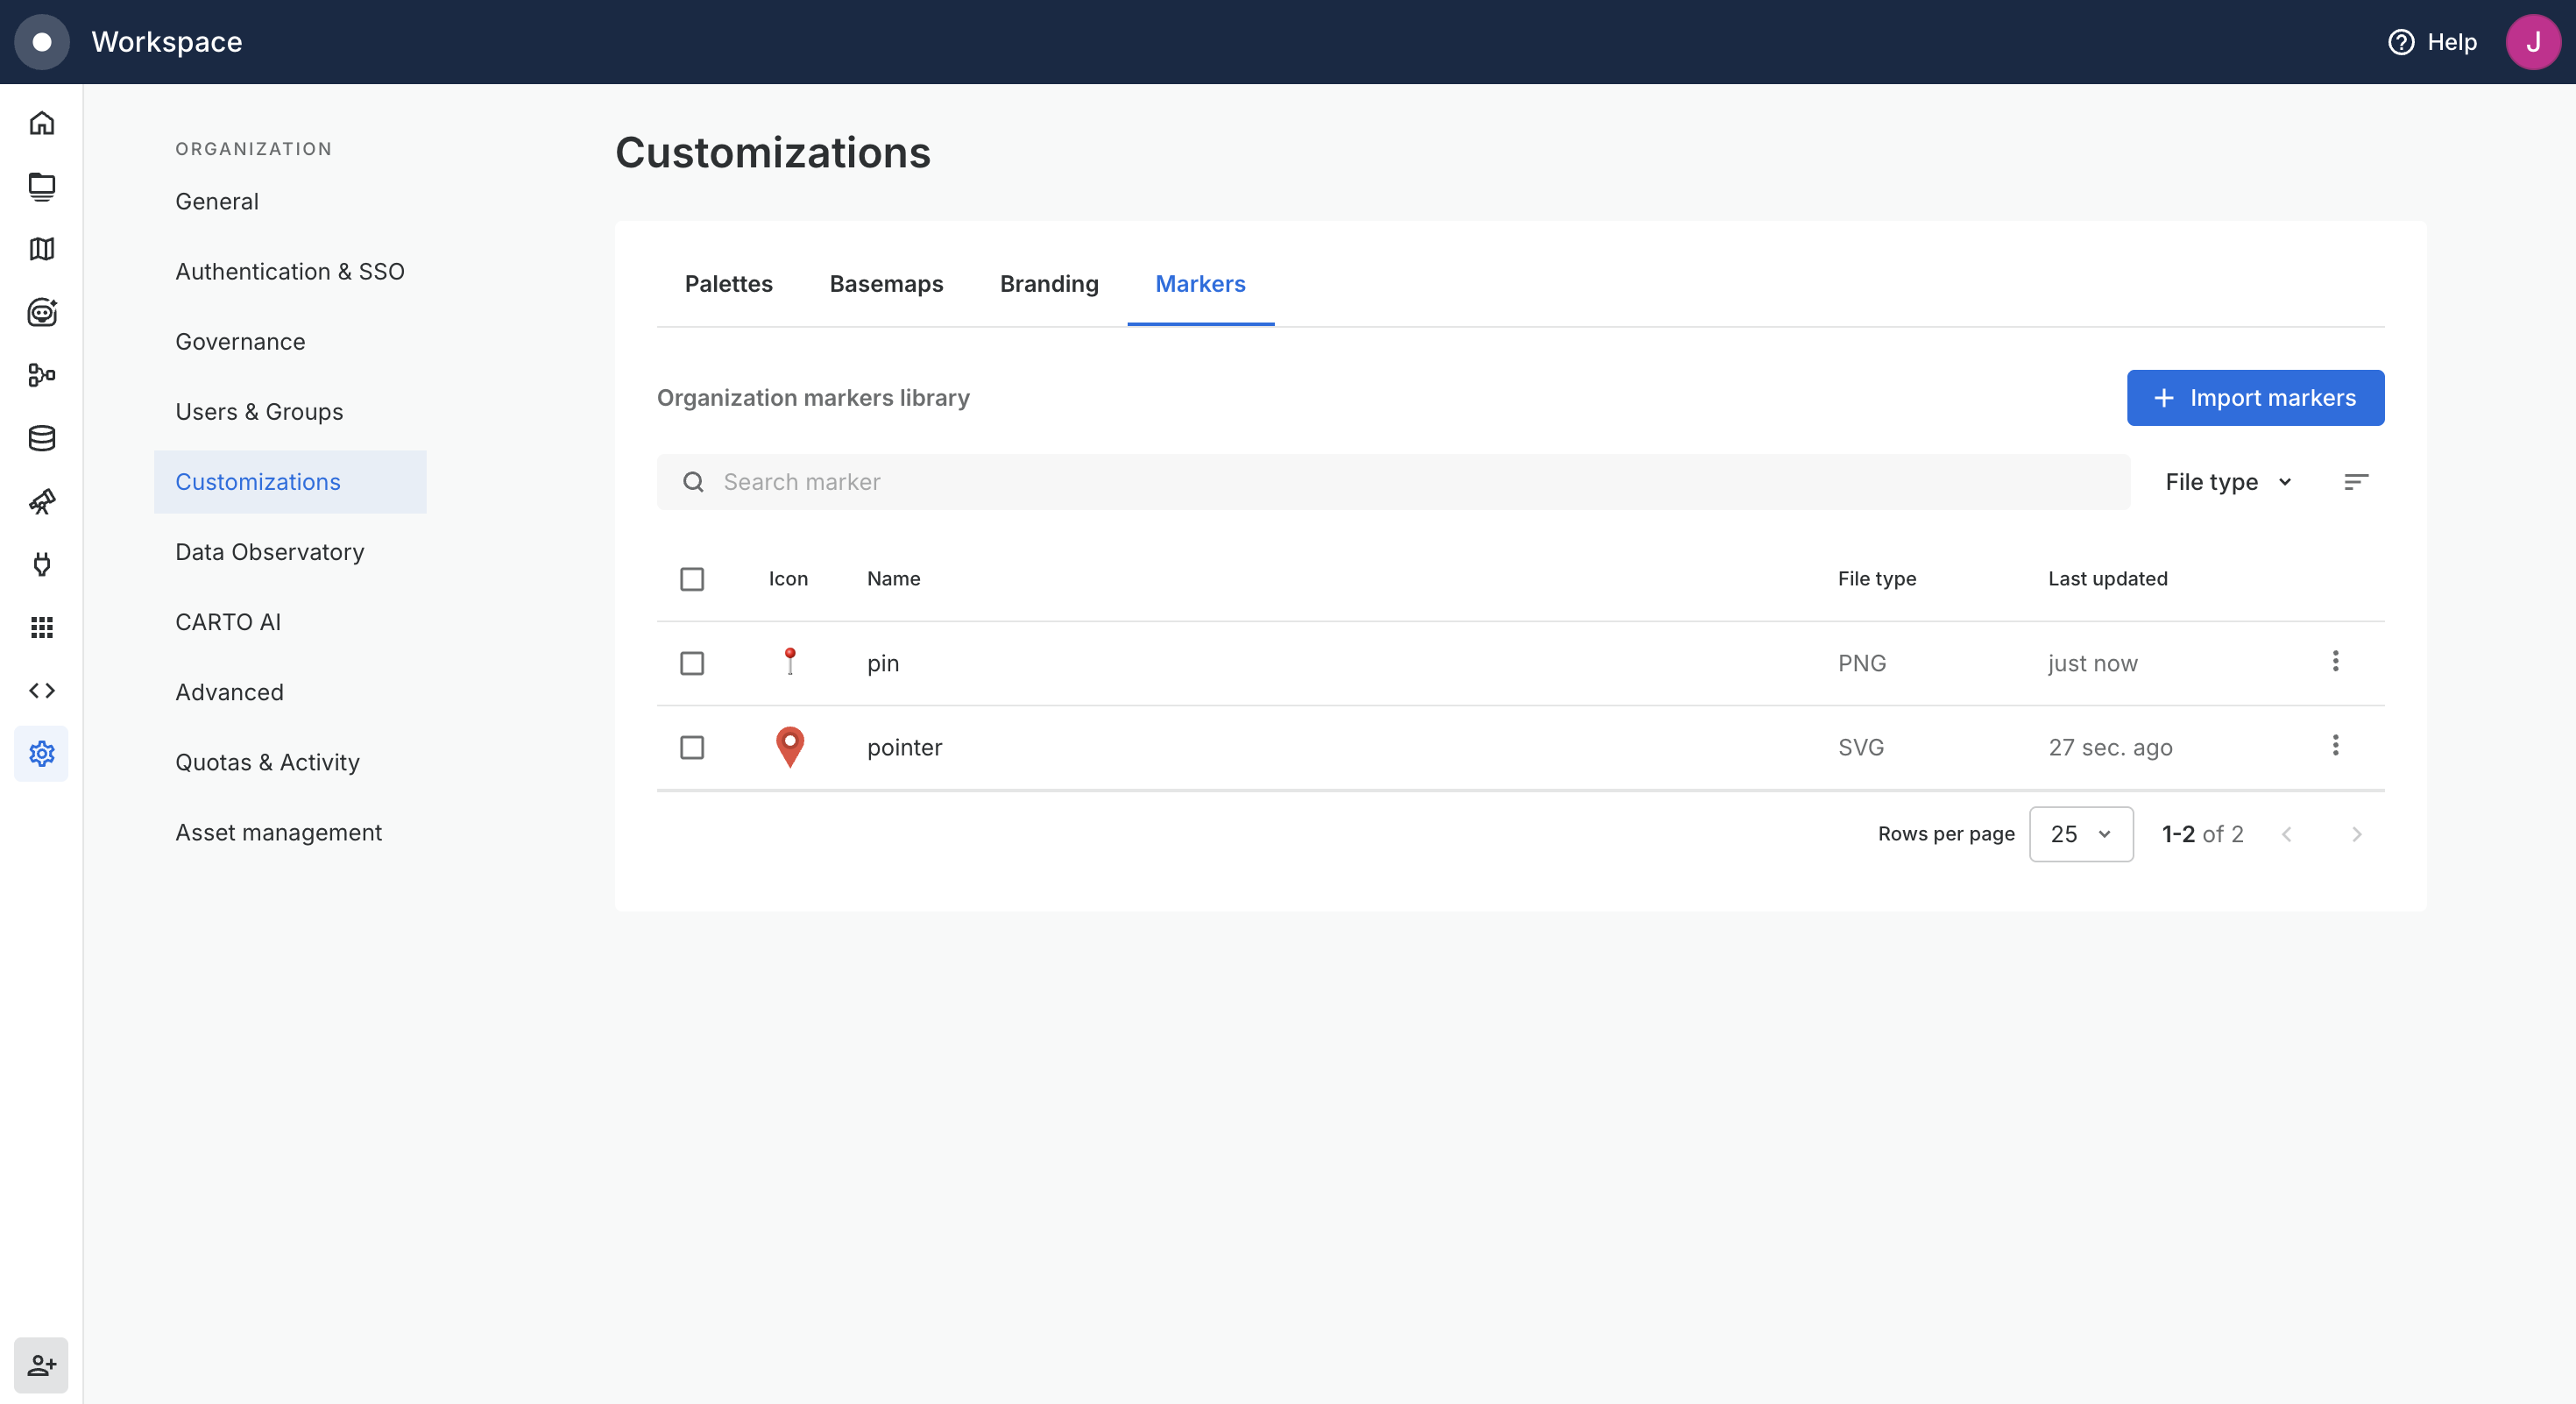
Custom markers have always been available in Builder, but Editors had to upload and manage them map by map. Now Admins can manage a shared set of custom point markers for the whole organization from **Settings > Customizations > Markers**, and Editors pick from them in Builder without re-uploading the same icons into every map. Replace or rename a marker once and the change flows to every map that uses it, so branding stays consistent as your icons evolve.
Learn more in the [Configuring custom markers](/carto-user-manual/settings/customizations/configuring-custom-markers.md) documentation.
{% endupdate %}
{% update date="2026-07-06" tags="new,builder" %}
## More export formats and controls in Builder
Data exports in Builder are now more flexible and more governed. Beyond CSV, you can export to **GeoJSON**, **Shapefile**, **GeoParquet** and **KML**, so you can take a filtered dataset straight into the tools you already use without any manual conversion.
As an Editor, you stay in control of what leaves your map: choose which sources are exportable, whitelist the columns that can be exported so sensitive attributes stay in your warehouse, and set the formats available per source. Every export honors the current map state, so filters, SQL parameters and the viewport are all respected.
Learn more in our [Exporting data documentation](/carto-user-manual/maps/exporting-data.md).
{% endupdate %}
{% update date="2026-07-03" tags="new,workspace" %}
## Organize your maps and workflows with projects and folders
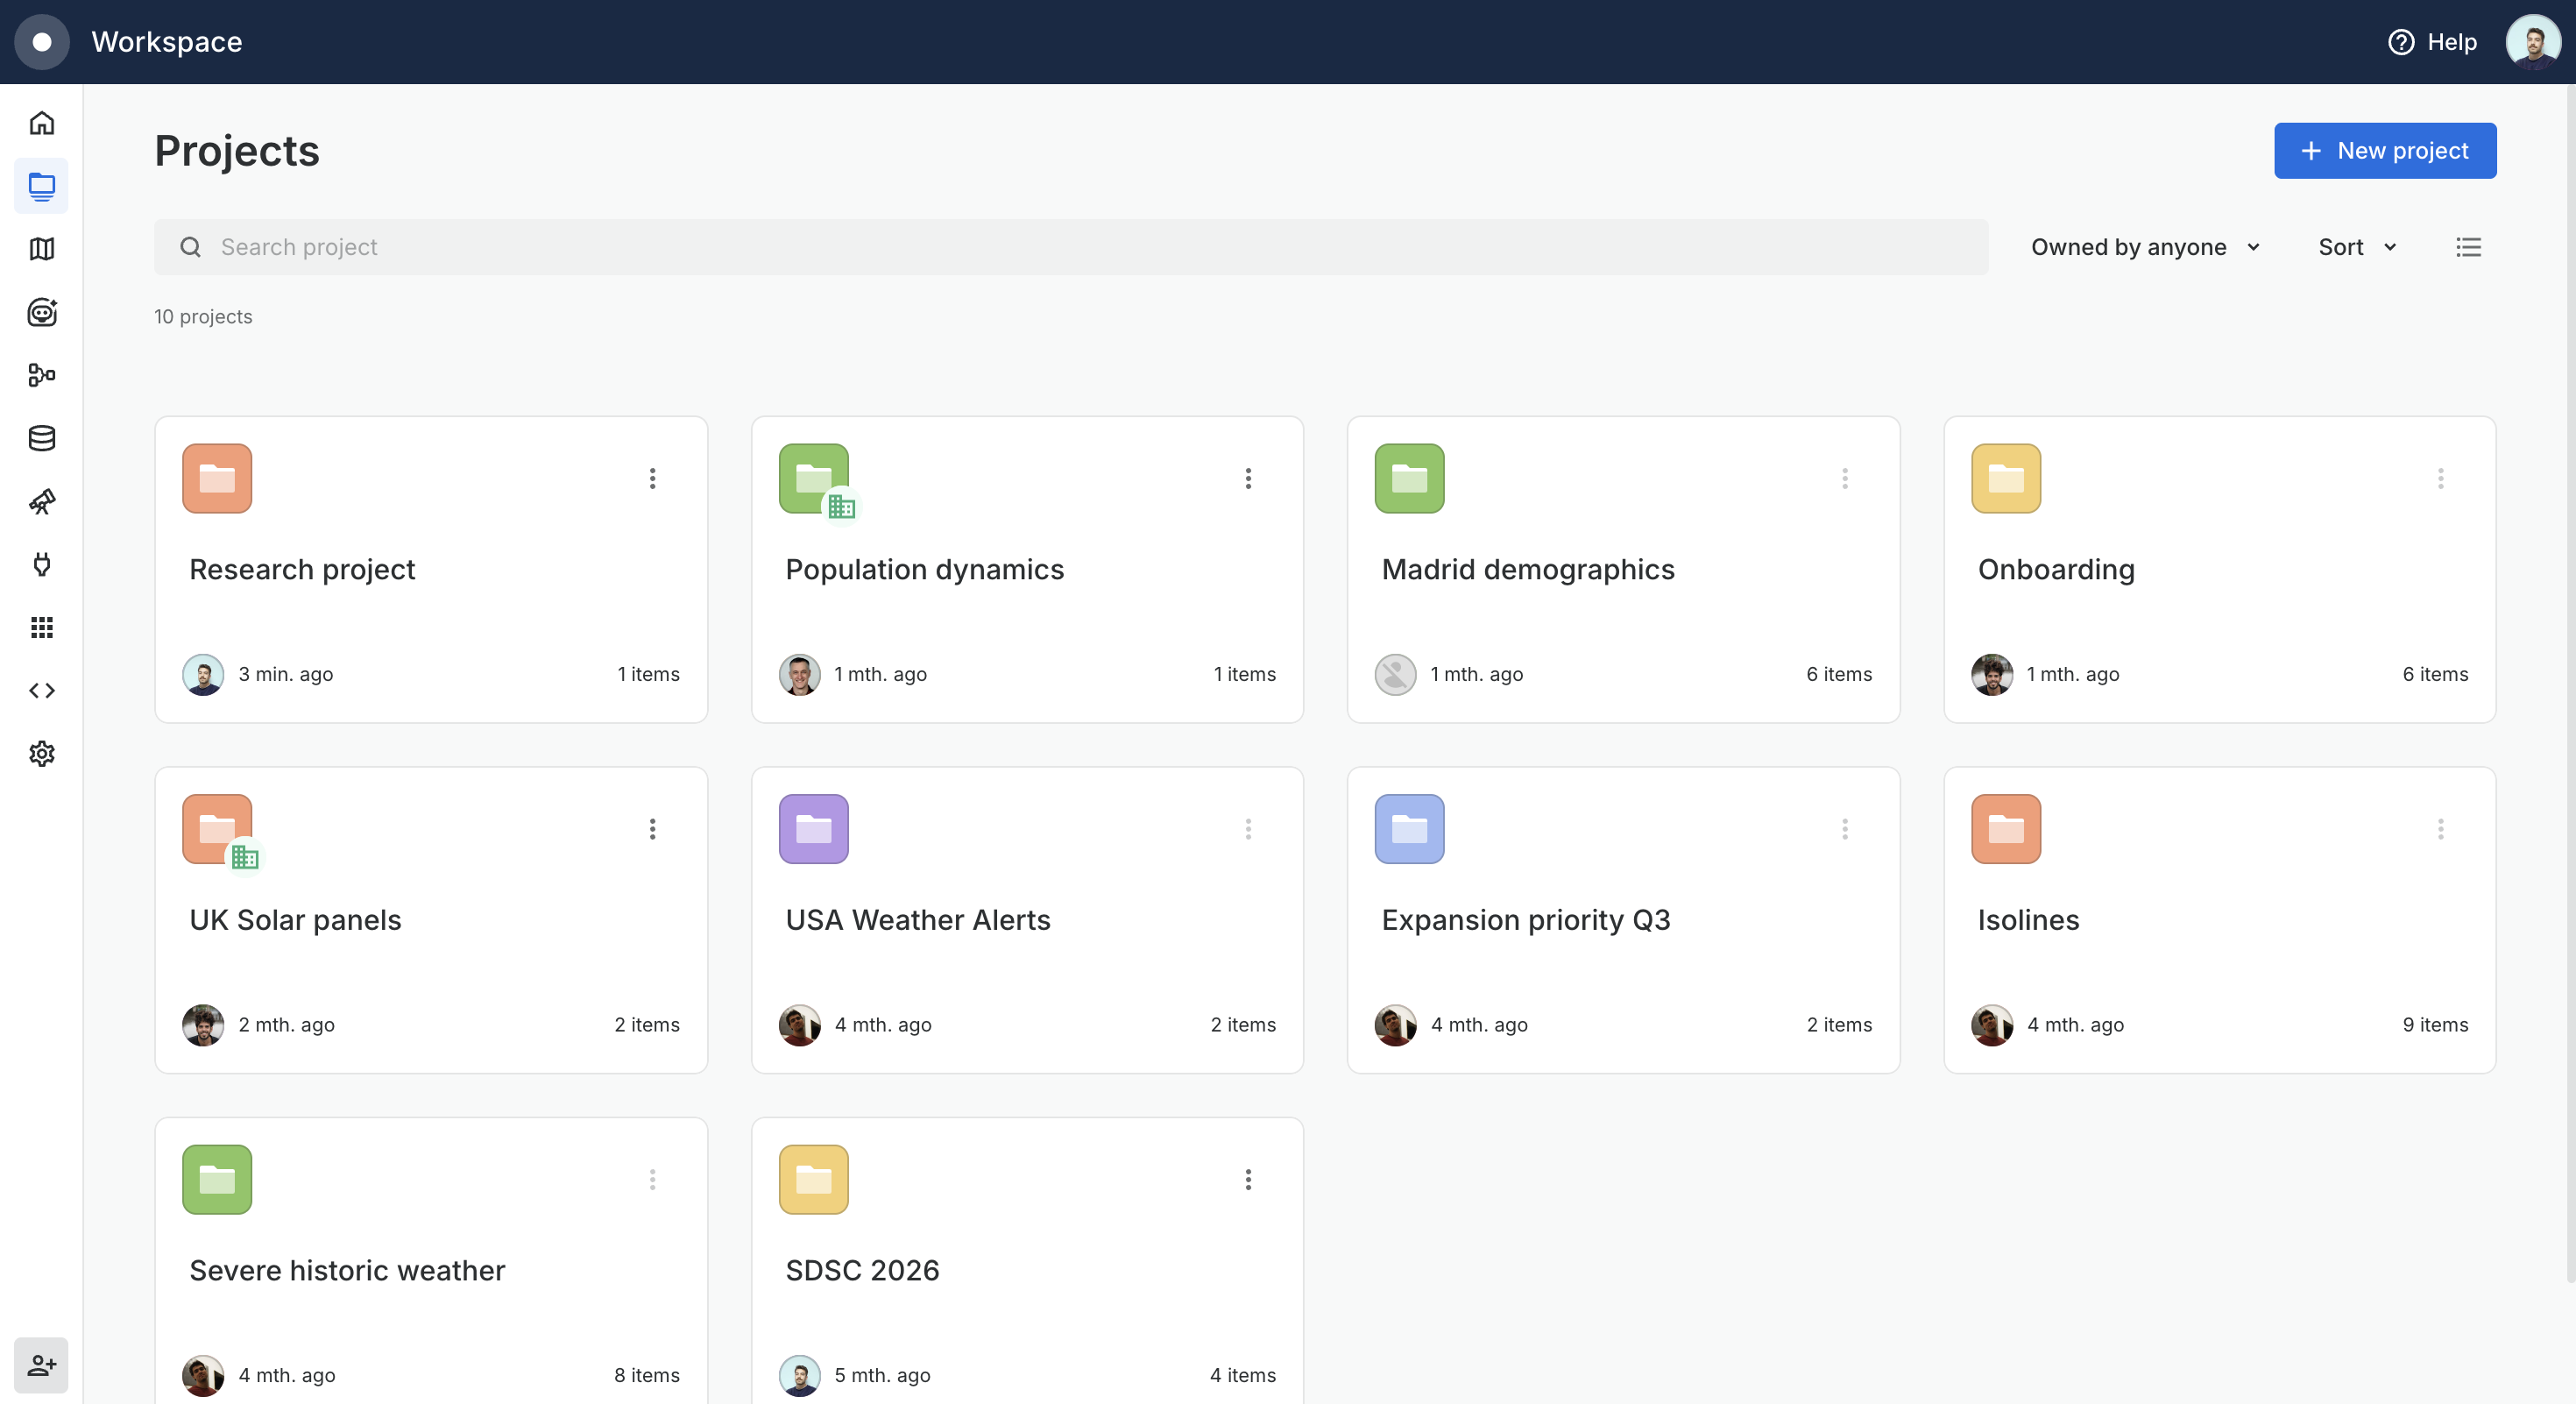
You can now organize your maps and workflows into **projects and folders** instead of one flat list. Group related work together, nest folders as deep as you need, and move or create maps and workflows right where they belong.
Projects keep your Workspace tidy and make collaboration easier: share a project or folder once and everything inside inherits those access permissions. You set permissions in one place instead of doing it asset by asset. When an asset belongs in more than one project, add a shortcut instead of moving it.
Learn more in the [Projects](/carto-user-manual/projects.md) documentation.
{% endupdate %}
{% update date="2026-07-03" tags="new,platform" %}
## More flexible sharing for maps and workflows
Sharing maps and workflows is now more flexible. Share assets with specific people or groups, with your whole organization, or publicly, and switch between those modes in a single click.
Switching keeps the people and groups you already added with the same access permissions, so you never set anything up twice. Projects and folders share the same flexiblity: share once, and every asset inside a project or folder inherits that access.
Learn more in the [map sharing](/carto-user-manual/maps/sharing-and-collaboration.md) and [workflow sharing](/carto-user-manual/workflows/sharing-workflows.md) documentation.
{% endupdate %}
{% update date="2026-07-02" tags="builder,improvement" %}
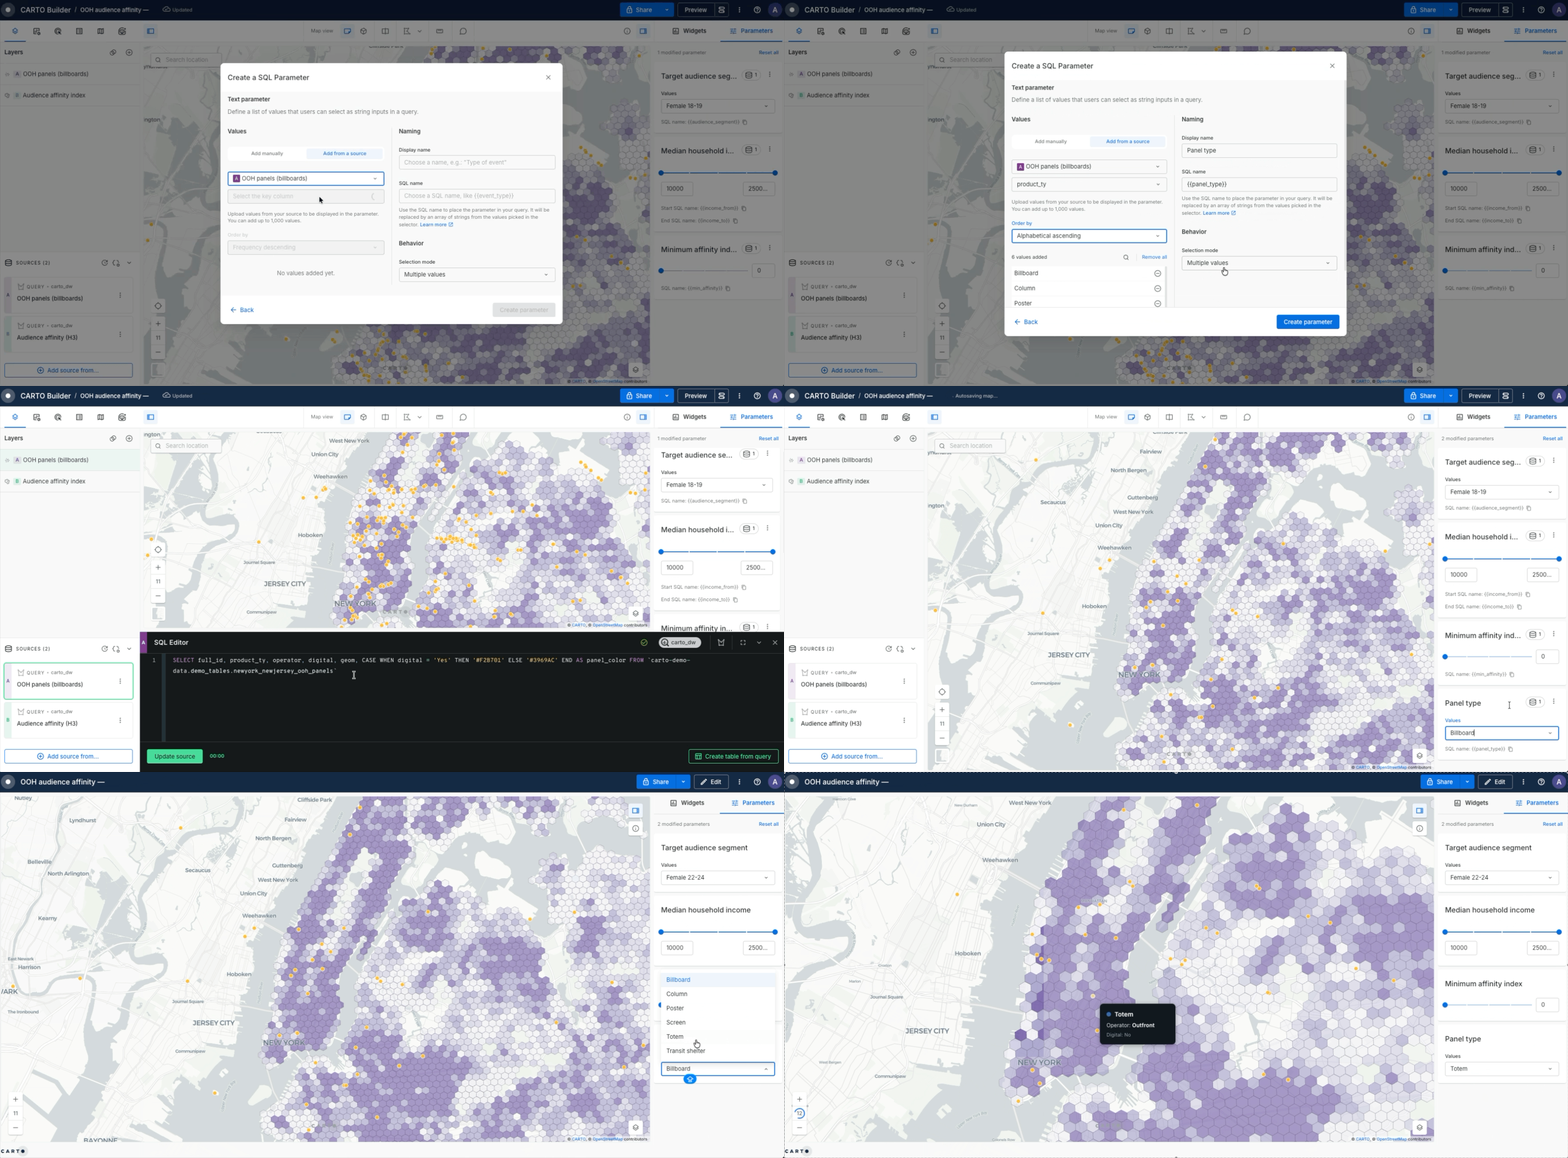
## Single-select mode for text parameters
Text parameters in Builder can now be set to **single value** instead of always allowing multiple selections. Viewers pick exactly one option from a radio list, and you decide which value is selected by default.
Single-select fits any map that should answer for one thing at a time: a single product line, region, store, audience segment, or scenario in a what-if comparison. The viewer picks one option and the map returns one clear, correct result.
Learn more in the [Text parameter](/carto-user-manual/maps/sql-parameters/text-parameter.md) documentation.
{% endupdate %}
{% update date="2026-07-01" tags="builder,improvement" %}
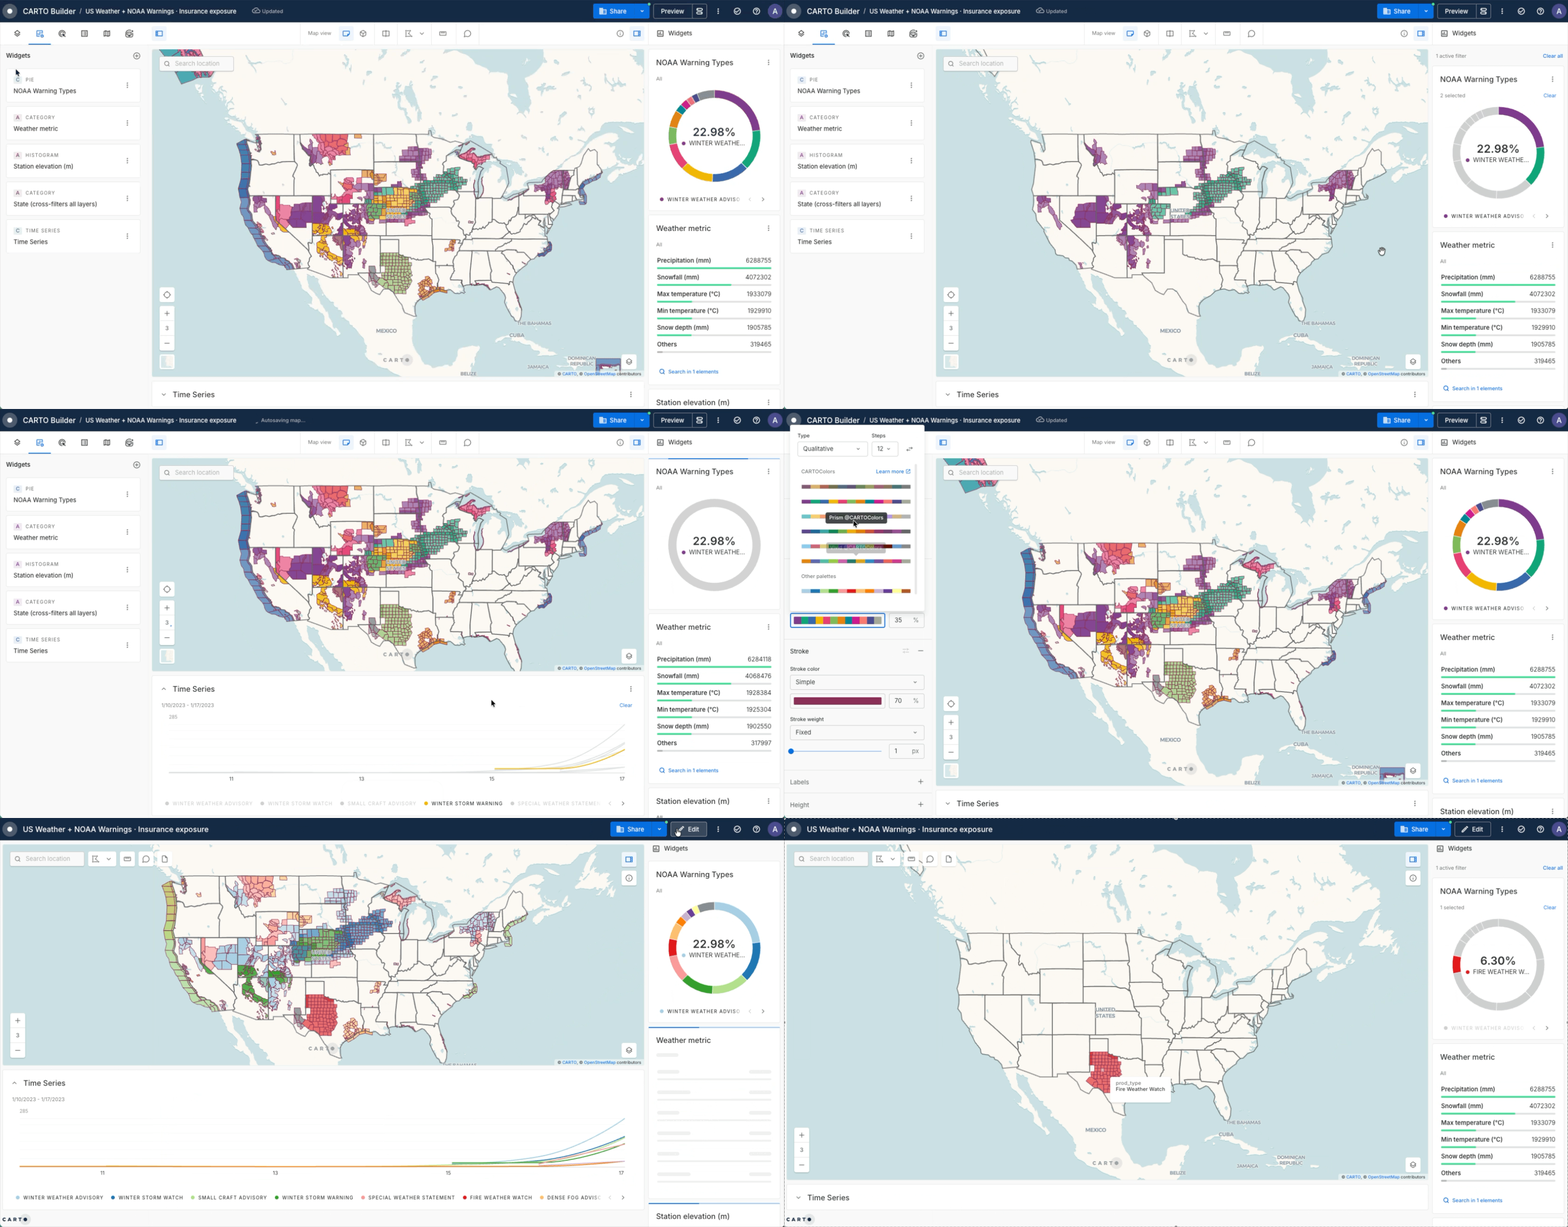
## Pie and Time Series widgets now sync with your layer colors
Pie and Time Series widgets in Builder can now inherit the colors of the layer they visualize. When a widget uses the same column your layer is styled by, it automatically picks up the layer's category colors, so the widget, the map, and the legend all match, with no extra setup. A category shown in purple on the map is purple in the widget too.
Colors are now stable within a session as well: even without a layer match, each category keeps its color as you zoom, pan, and filter, instead of shifting with the data order. This applies to the Pie widget and to the Time Series widget with Split by.
Learn more in the [Pie widget](/carto-user-manual/maps/widgets/pie-widget.md) and [Time Series widget](/carto-user-manual/maps/widgets/time-series-widget.md) documentation.
{% endupdate %}
{% endupdates %}
---
# Agent Instructions
This documentation is published with GitBook. GitBook is the documentation platform designed so that both humans and AI agents can read, navigate, and reason over technical content effectively. Learn more at gitbook.com.
## Querying This Documentation
If you need additional information that is not directly available in this page, you can query the documentation by asking a question.
Perform an HTTP GET request on the following URL with the `ask` and `goal` query parameters:
```
GET https://docs.carto.com/whats-new/q3-2026.md?ask=&goal=
```
`ask` is the immediate question: it should be specific, self-contained, and written in natural language.
`goal` is what the user is ultimately trying to achieve, the reason they need the answer. Sharing it helps GitBook give you a better, more relevant answer. A goal is most helpful when it describes the outcome the user wants rather than restating the question. For example, with `ask=how do I create an API token`, a goal like `automate deployments from our CI pipeline` lets GitBook tailor the answer to that use case.
The response will contain a direct answer to the question and relevant excerpts and sources from the documentation.
Use this mechanism when the answer is not explicitly present in the current page, you need clarification or additional context, or you want to retrieve related documentation sections.