> For the complete documentation index, see [llms.txt](https://docs.carto.com/llms.txt). Markdown versions of documentation pages are available by appending `.md` to page URLs; this page is available as [Markdown](https://docs.carto.com/whats-new/q2-2026.md).
# Q2 2026
New features and improvements introduced from April to June 2026
{% updates %}
{% update date="2026-06-29" tags="new,builder" %}
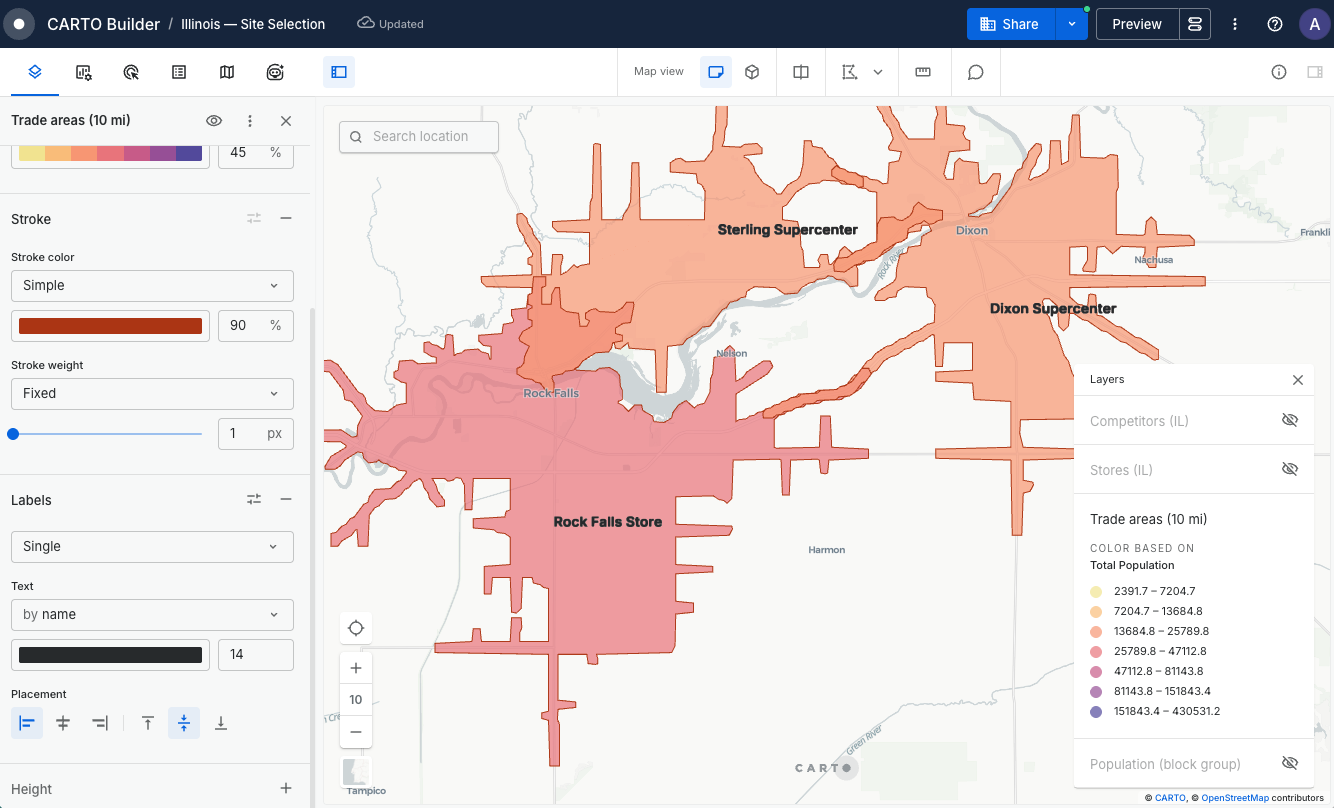
## Labels for polygons and lines in Builder
You can now add text labels directly to polygon and line layers, not just points. Turn labels on from the **Labels** section of the layer panel and choose the column to display. CARTO places each label automatically, at the center of every polygon and along the middle of every line. For lines, you can also pick a unique ID column so a feature that crosses several tiles, like a long road, shows a single label instead of one per tile.
Learn more in our [Layers documentation](/carto-user-manual/maps/layers.md#labels).
{% endupdate %}
{% update date="2026-06-29" tags="new,platform" %}
## The latest AI models are now in CARTO
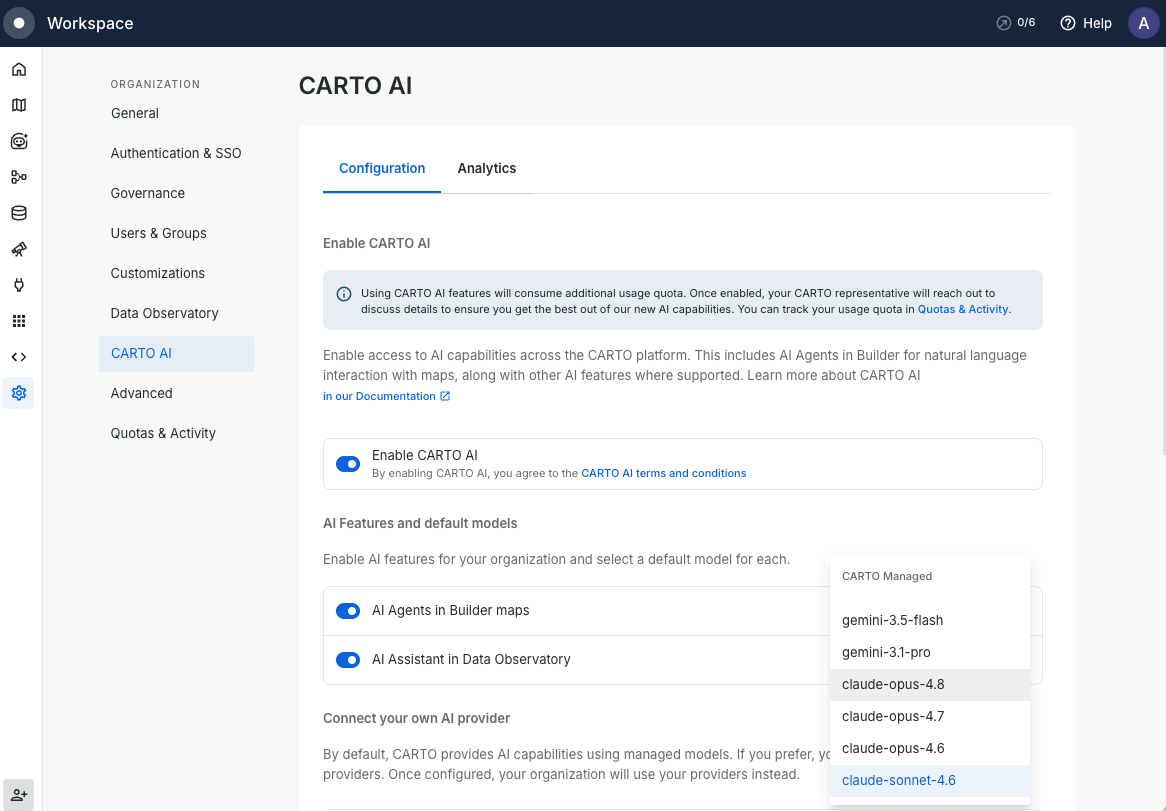
CARTO AI now offers the latest generation of models across every supported provider. The CARTO-managed set adds `claude-opus-4.8`, our most capable model for the hardest geospatial reasoning, and `gemini-3.5-flash` for fast, high-volume interactions.
If you bring your own provider, the newest models are available too: the GPT-5.5 and GPT-5.4 families on OpenAI, Azure, Snowflake and Databricks, `claude-opus-4.8` on Anthropic, Bedrock, Vertex AI, Snowflake and Databricks, `gemini-3.5-flash` on Vertex AI, Google AI Studio and Databricks, and xAI Grok 4.3 and 4.20 on Oracle.
Learn more in the [CARTO AI settings](/carto-user-manual/settings/carto-ai.md) documentation.
{% endupdate %}
{% update date="2026-06-25" tags="new,builder" %}
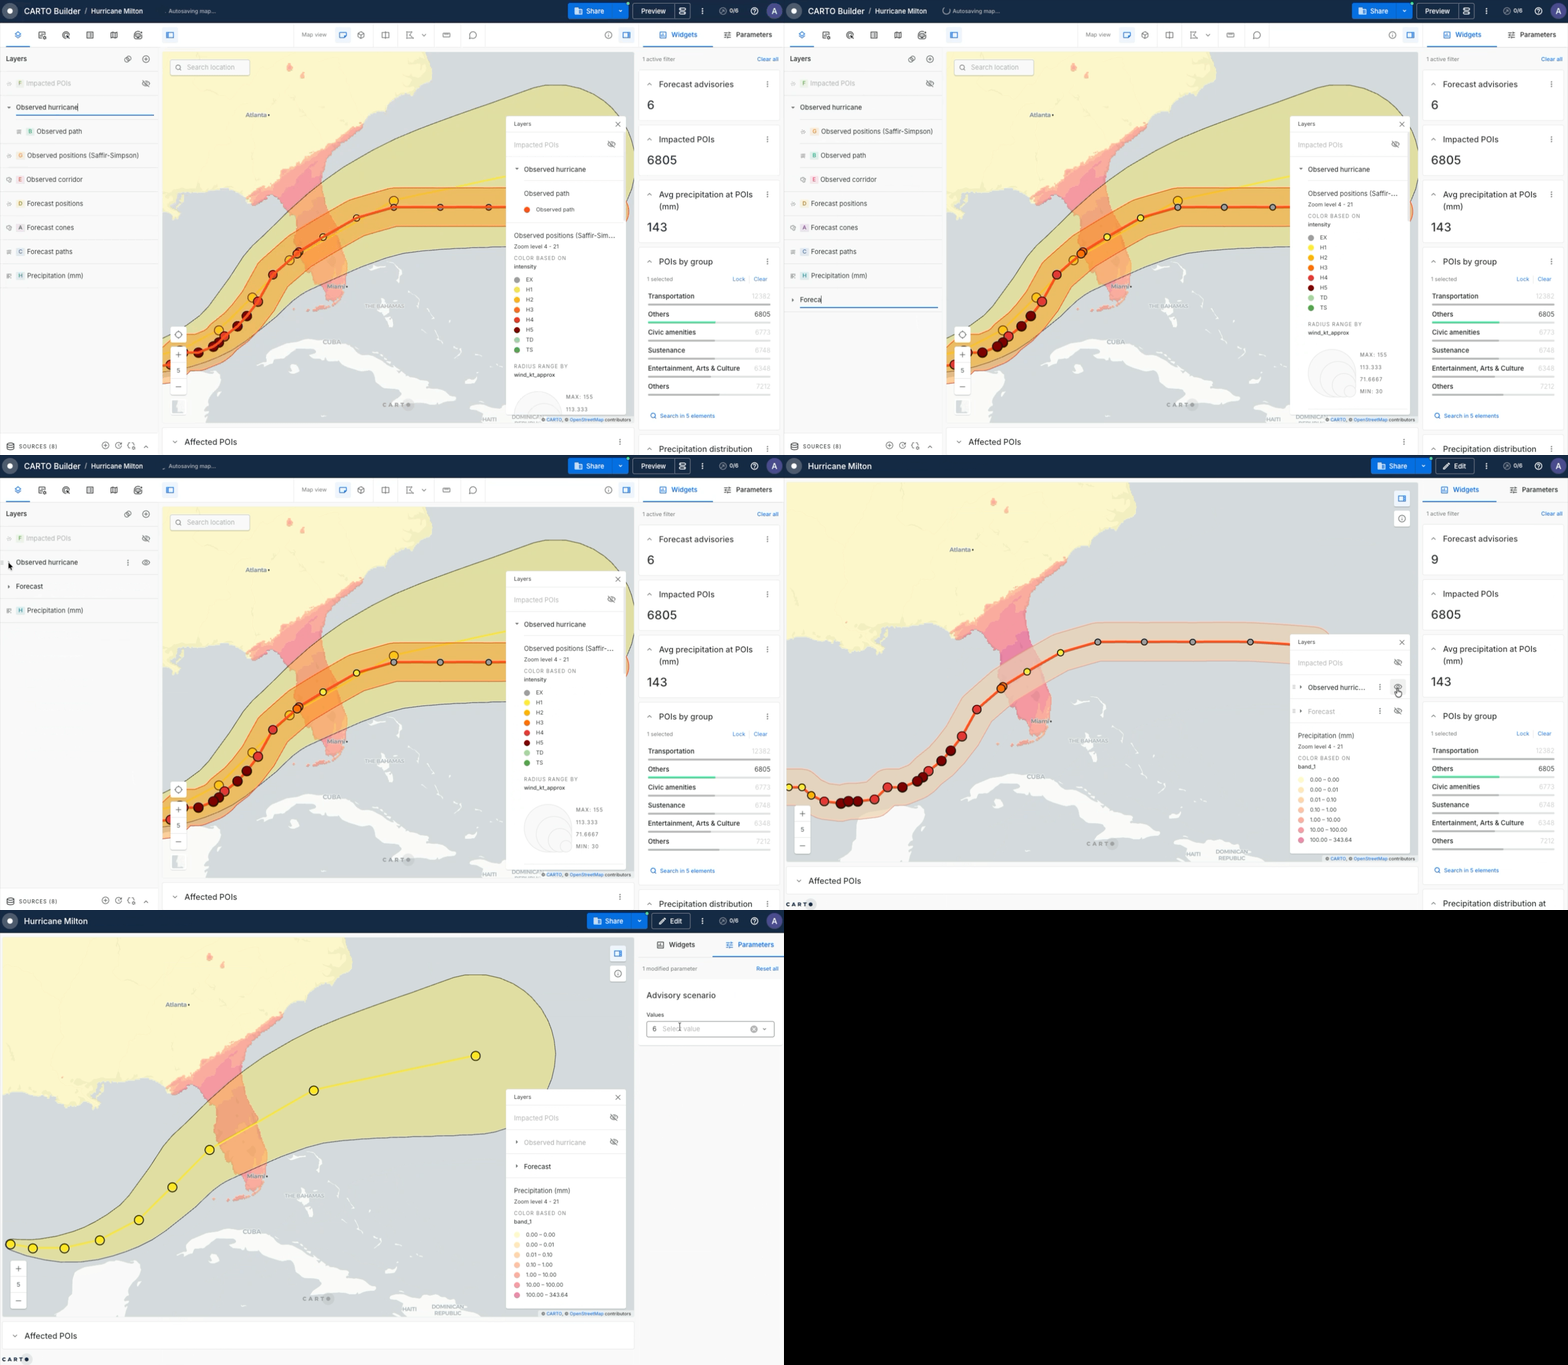
## Organize your layers into groups in Builder
You can now organize the layers in your map into named, collapsible **groups**. Related layers fold into tidy sections in the layer panel, so a map with a long list of layers stays easy to read and work with.
Group layers however makes sense for your map, collapse the ones you're not using, and turn a whole group's visibility on or off in one click.
Learn more in our [Layers documentation](/carto-user-manual/maps/layers.md#layer-groups).
{% endupdate %}
{% update date="2026-06-12" tags="improvement,ai-agents" %}
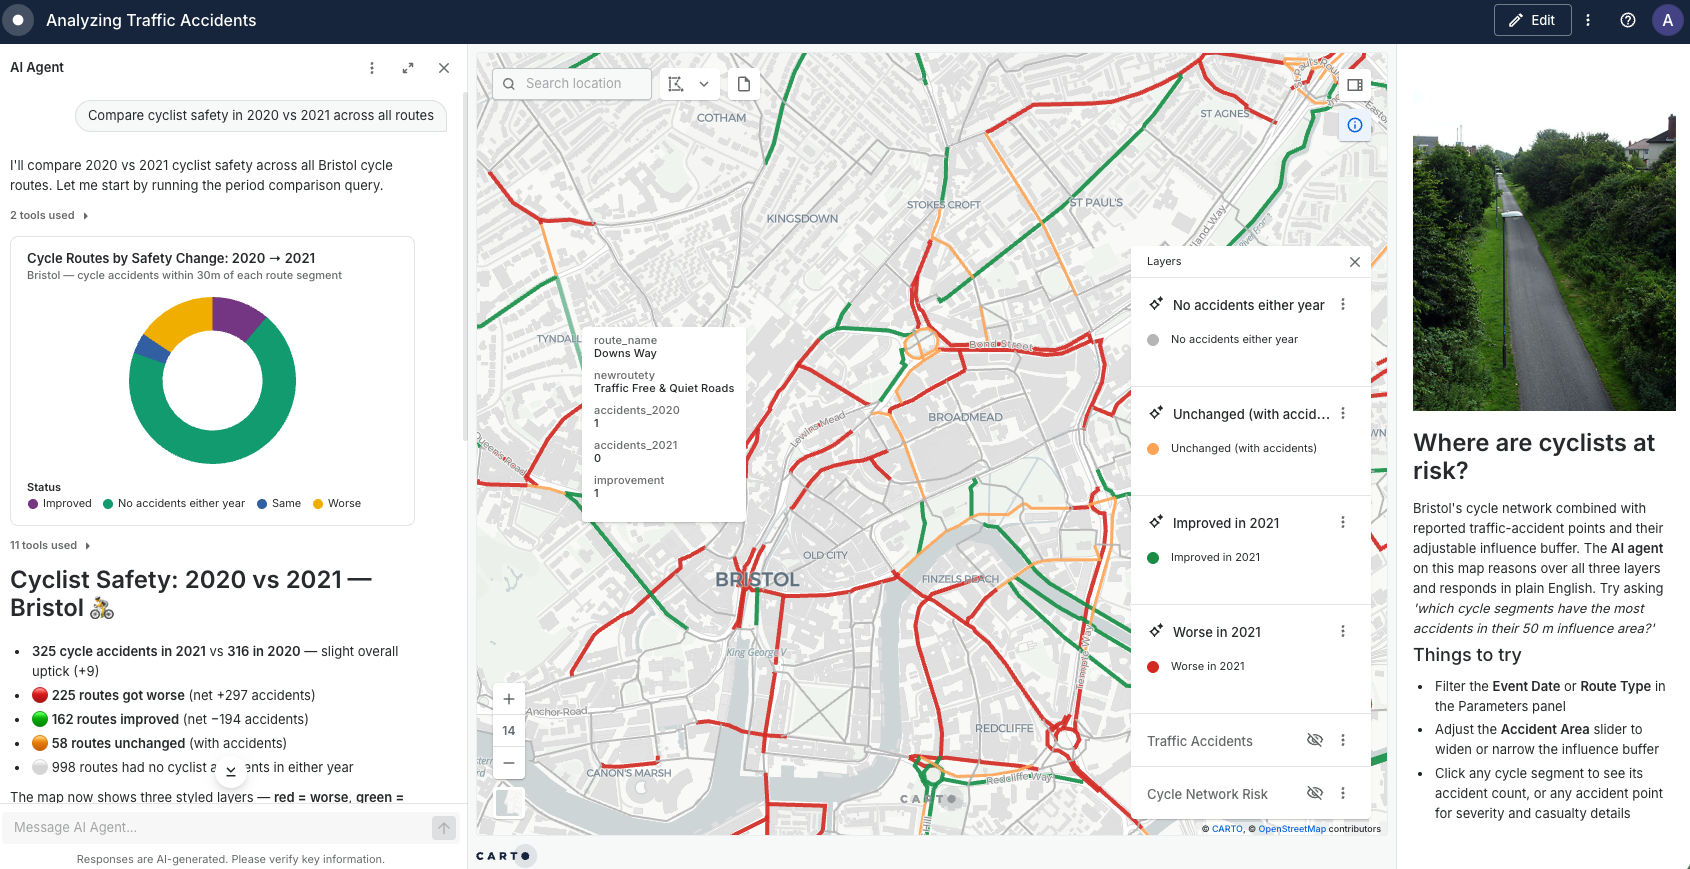
## AI Agents are more visible and accessible in your maps
The AI Agent in your published maps now has a more prominent place in the interface. Instead of a button users had to find and click, the Agent is immediately visible alongside the map when it loads — making it easier for your users to start a conversation and get answers right away.
Users can also expand the Agent for a more focused conversation when they need it.
Learn more about [sharing your AI Agent](/carto-user-manual/ai-agents/sharing-your-agent.md) and [creating AI Agents](/carto-user-manual/ai-agents.md) in our documentation.
{% endupdate %}
{% update date="2026-06-05" tags="new,platform" %}
## Bring any custom AI provider, proxy or gateway to CARTO
CARTO already supports nine AI providers out of the box — including Google Vertex AI, OpenAI, Anthropic, AWS Bedrock, Azure OpenAI, Snowflake, Databricks, and Oracle. Now you can connect any OpenAI-compatible endpoint as well, whether that's an LLM gateway or your own self-hosted models.
Connect one or more providers, and their models become available across CARTO's AI features — [AI Agents](/carto-user-manual/ai-agents.md), the [Agent Config Assistant](/carto-user-manual/ai-agents/agent-config-assistant.md), and the [AI Assistant in Data Observatory](/carto-user-manual/data-observatory/accessing-and-browsing-the-spatial-data-catalog.md).
Learn more in the [CARTO AI settings](/carto-user-manual/settings/carto-ai.md) documentation.
{% endupdate %}
{% update date="2026-06-03" tags="new,ai-agents" %}
## Full visibility into your AI Agent's behavior
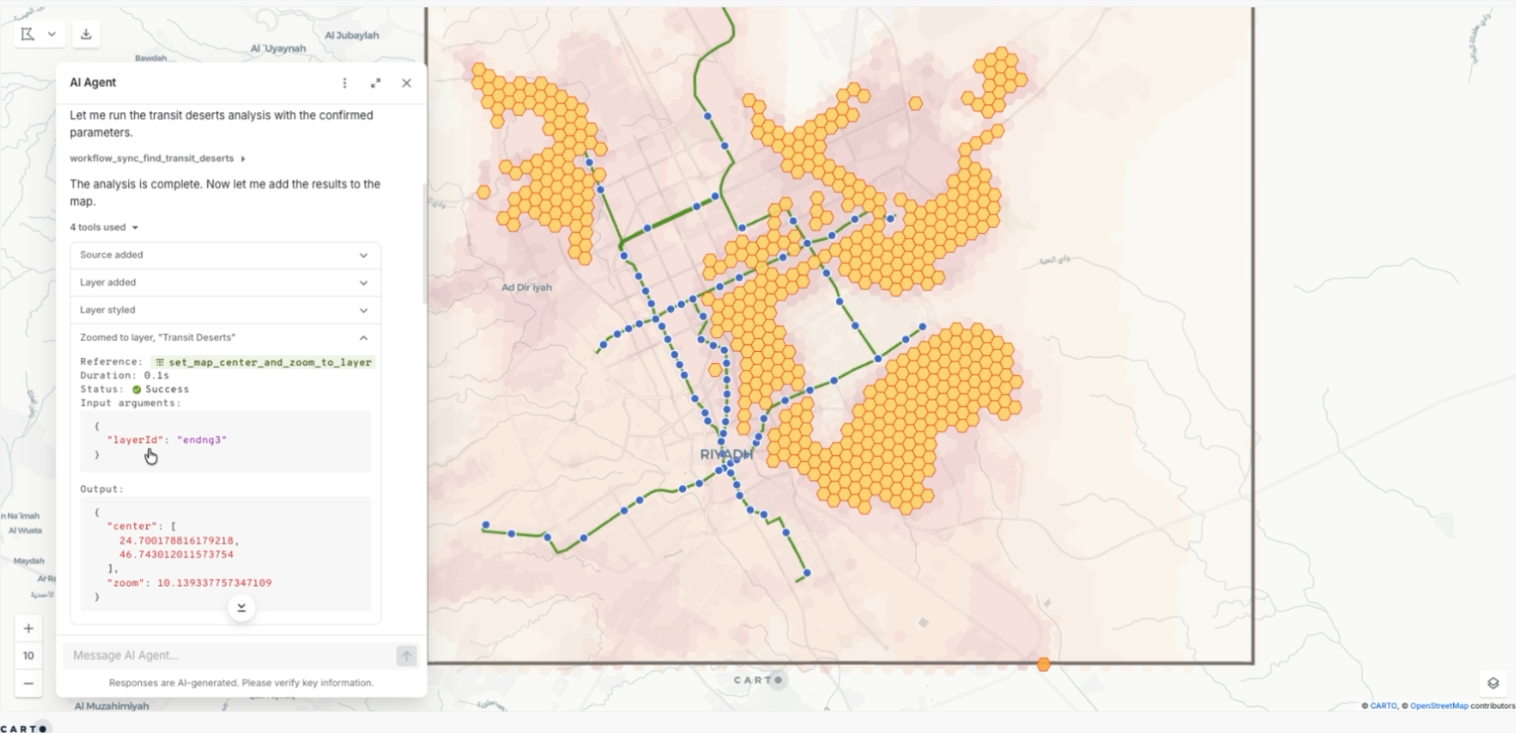
Get full visibility into your AI Agent's actions with new **tool traceability**. You can now see which tools were executed, the parameters used, and their outputs, all directly in the conversation. Inspect the SQL generated by `execute_query`, the arguments passed to a [Workflows MCP Tool](/carto-user-manual/workflows/workflows-as-mcp-tools.md), or the inputs of any other tool the Agent ran, so you know exactly how the Agent reached its answer.
Learn more about the [tools available for AI Agents](/carto-user-manual/ai-agents/working-with-tools.md) in our documentation.
{% endupdate %}
{% update date="2026-05-27" tags="new,analytics-toolbox" %}
## New modules in the Analytics Toolbox for Oracle
The [Analytics Toolbox for Oracle](/data-and-analysis/analytics-toolbox-for-oracle.md) (v1.1.0) expands its capabilities on Oracle Autonomous Database with three new modules. The new [`data`](/data-and-analysis/analytics-toolbox-for-oracle/sql-reference/data.md) module brings **data enrichment** to Oracle, with the [ENRICH\_POINTS](/data-and-analysis/analytics-toolbox-for-oracle/sql-reference/data.md#enrich_points), [ENRICH\_POLYGONS](/data-and-analysis/analytics-toolbox-for-oracle/sql-reference/data.md#enrich_polygons), [ENRICH\_POLYGONS\_WEIGHTED](/data-and-analysis/analytics-toolbox-for-oracle/sql-reference/data.md#enrich_polygons_weighted) and [ENRICH\_GRID](/data-and-analysis/analytics-toolbox-for-oracle/sql-reference/data.md#enrich_grid) procedures (plus their `_RAW` variants), so you can augment your spatial data with variables from other datasets directly in SQL.
This release also adds the [`h3`](/data-and-analysis/analytics-toolbox-for-oracle/sql-reference/h3.md) and [`quadbin`](/data-and-analysis/analytics-toolbox-for-oracle/sql-reference/quadbin.md) **spatial indexing** modules. The `h3` module brings the full set of H3 functions to Oracle, covering index conversion ([H3\_FROMGEOGPOINT](/data-and-analysis/analytics-toolbox-for-oracle/sql-reference/h3.md#h3_fromgeogpoint), [H3\_BOUNDARY](/data-and-analysis/analytics-toolbox-for-oracle/sql-reference/h3.md#h3_boundary), [H3\_CENTER](/data-and-analysis/analytics-toolbox-for-oracle/sql-reference/h3.md#h3_center)), hierarchy traversal ([H3\_TOPARENT](/data-and-analysis/analytics-toolbox-for-oracle/sql-reference/h3.md#h3_toparent) / [H3\_TOCHILDREN](/data-and-analysis/analytics-toolbox-for-oracle/sql-reference/h3.md#h3_tochildren)), neighborhood traversal ([H3\_KRING](/data-and-analysis/analytics-toolbox-for-oracle/sql-reference/h3.md#h3_kring)) and polygon-to-grid conversion ([H3\_POLYFILL](/data-and-analysis/analytics-toolbox-for-oracle/sql-reference/h3.md#h3_polyfill)), so you can index, aggregate and analyze your data on hexagonal grids natively in Oracle. The `quadbin` module provides the equivalent set of functions for the Quadbin grid.
Learn more in the [Analytics Toolbox for Oracle release notes](/data-and-analysis/analytics-toolbox-for-oracle/release-notes.md) and the [SQL reference](/data-and-analysis/analytics-toolbox-for-oracle/sql-reference.md).
{% endupdate %}
{% update date="2026-05-27" tags="new,analytics-toolbox" %}
## New capabilities in the Analytics Toolbox for Databricks
The [Analytics Toolbox for Databricks](/data-and-analysis/analytics-toolbox-for-databricks.md) (v2.4.0) extends its [`statistics`](/data-and-analysis/analytics-toolbox-for-databricks/reference/statistics.md) module with a new [HOTSPOT\_ANALYSIS](/data-and-analysis/analytics-toolbox-for-databricks/reference/statistics.md#hotspot_analysis) procedure. It locates hotspot areas by combining several variables' [Getis-Ord Gi\*](/data-and-analysis/analytics-toolbox-for-databricks/reference/statistics.md#getis_ord_h3) statistics using Stouffer's method, and works on either H3 or Quadbin grids.
The Analytics Toolbox for Databricks also includes a [`data`](/data-and-analysis/analytics-toolbox-for-databricks/reference/data.md) module for **data enrichment**, with the [ENRICH\_POINTS](/data-and-analysis/analytics-toolbox-for-databricks/reference/data.md#enrich_points), [ENRICH\_POLYGONS](/data-and-analysis/analytics-toolbox-for-databricks/reference/data.md#enrich_polygons), [ENRICH\_POLYGONS\_WEIGHTED](/data-and-analysis/analytics-toolbox-for-databricks/reference/data.md#enrich_polygons_weighted) and [ENRICH\_GRID](/data-and-analysis/analytics-toolbox-for-databricks/reference/data.md#enrich_grid) procedures (plus their `_RAW` variants), so you can augment your spatial data with variables from other datasets directly in SQL.
Learn more in the [Analytics Toolbox for Databricks release notes](/data-and-analysis/analytics-toolbox-for-databricks/release-notes.md) and the [SQL reference](/data-and-analysis/analytics-toolbox-for-databricks/reference.md).
{% endupdate %}
{% update date="2026-05-26" tags="new,workflows" %}
## Version history in Workflows
Workflows now keep a complete **version history**. CARTO automatically captures versions as you work, and you can also save named versions to mark important milestones. Each time you enable or update an execution method — a schedule, an API endpoint, an MCP Tool, or Viewer mode — that snapshot is recorded and marked as the **published version** for that method, so consumers keep running against a stable state while you keep editing.
From the Version History dialog you can browse, search, and filter past versions, preview each one on the canvas, restore the workflow to an earlier state, or duplicate a new workflow from any historical version.
Learn more in our [Version history documentation](/carto-user-manual/workflows/version-history.md).
{% embed url="" %}
{% endupdate %}
{% update date="2026-05-26" tags="new,workspace" %}
## Usage attribution by map and workflow
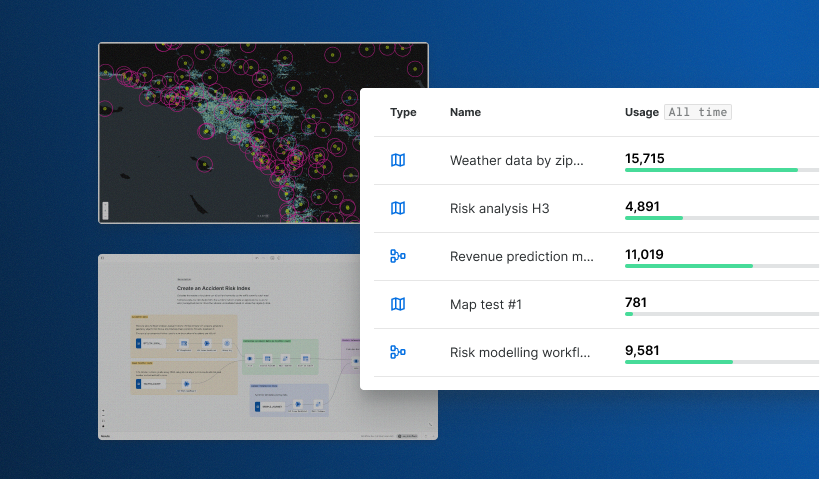
Admins can now see which specific **maps and workflows** are consuming their [Usage Quota](/carto-user-manual/settings/quotas-and-rate-limits/understanding-your-organization-quotas.md). The [Activity Data](/carto-user-manual/settings/activity-data.md) export now includes `map_id` and `workflow_id` columns in the API Usage table, making it easy to understand where your Usage Quota is going, identify high-cost maps and workflows, and tie consumption back to specific teams or projects.
Learn more in our [Activity Data reference](/carto-user-manual/settings/activity-data/activity-data-reference.md#api-usage).
{% endupdate %}
{% update date="2026-05-20" tags="new,workspace" %}
## Wildcard patterns in API Access Token grants
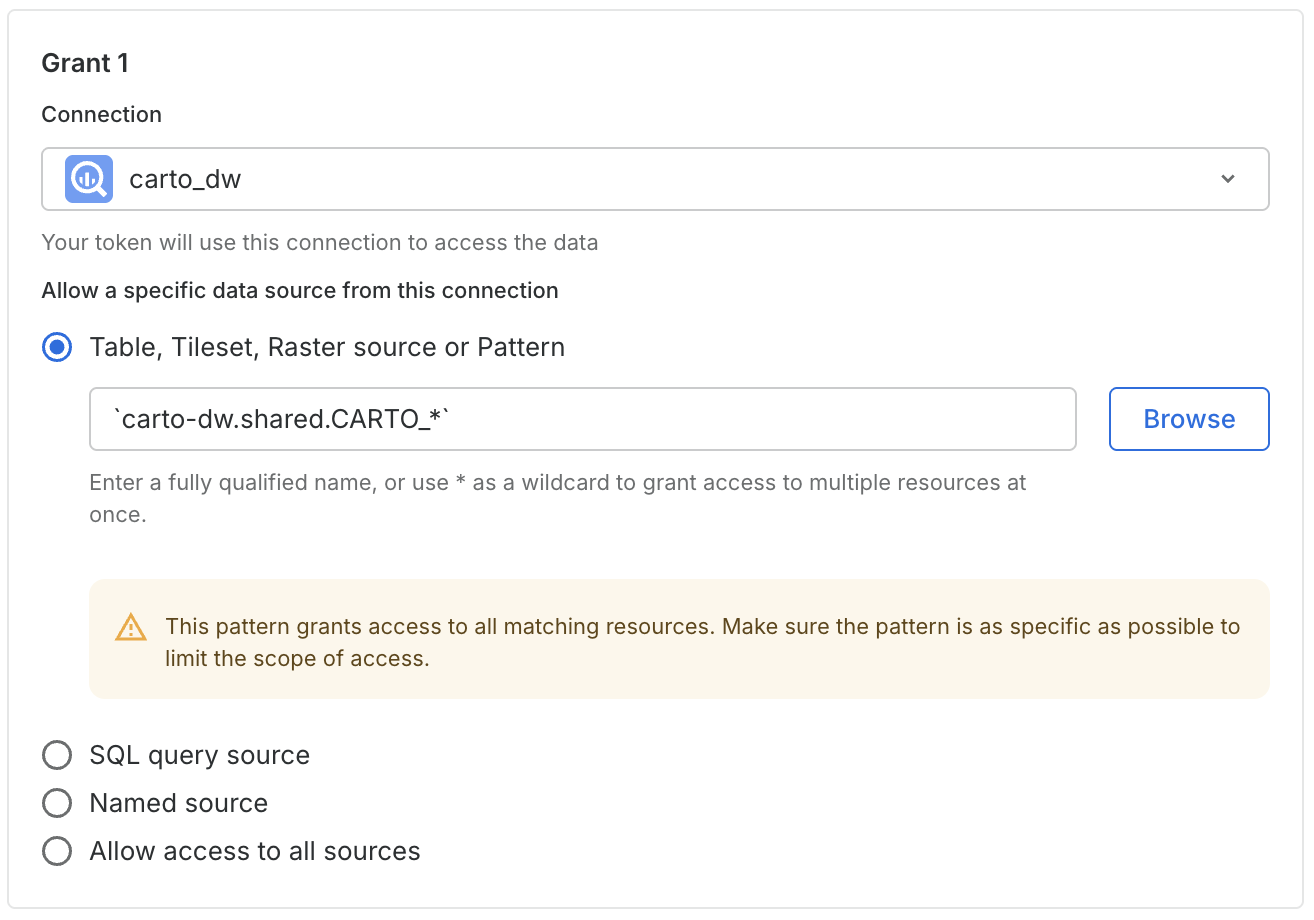
API Access Tokens now accept **wildcard patterns** in the **Table, Tileset, Raster source or Pattern** grant. Instead of listing resources one by one, you can use `*` to match multiple resources at once, for example `carto.shared.*` to cover everything under `carto.shared` or `carto.shared.CARTO_*` to cover only resources that share a naming convention. Patterns also match resources created after the token was issued, so you no longer need to re-issue tokens when new tables land.
Learn more in our [API Access Tokens documentation](/carto-user-manual/developers/managing-credentials/api-access-tokens.md#wildcard-patterns).
{% endupdate %}
{% update date="2026-05-21" tags="new,workspace" %}
## Granular controls for CARTO AI features
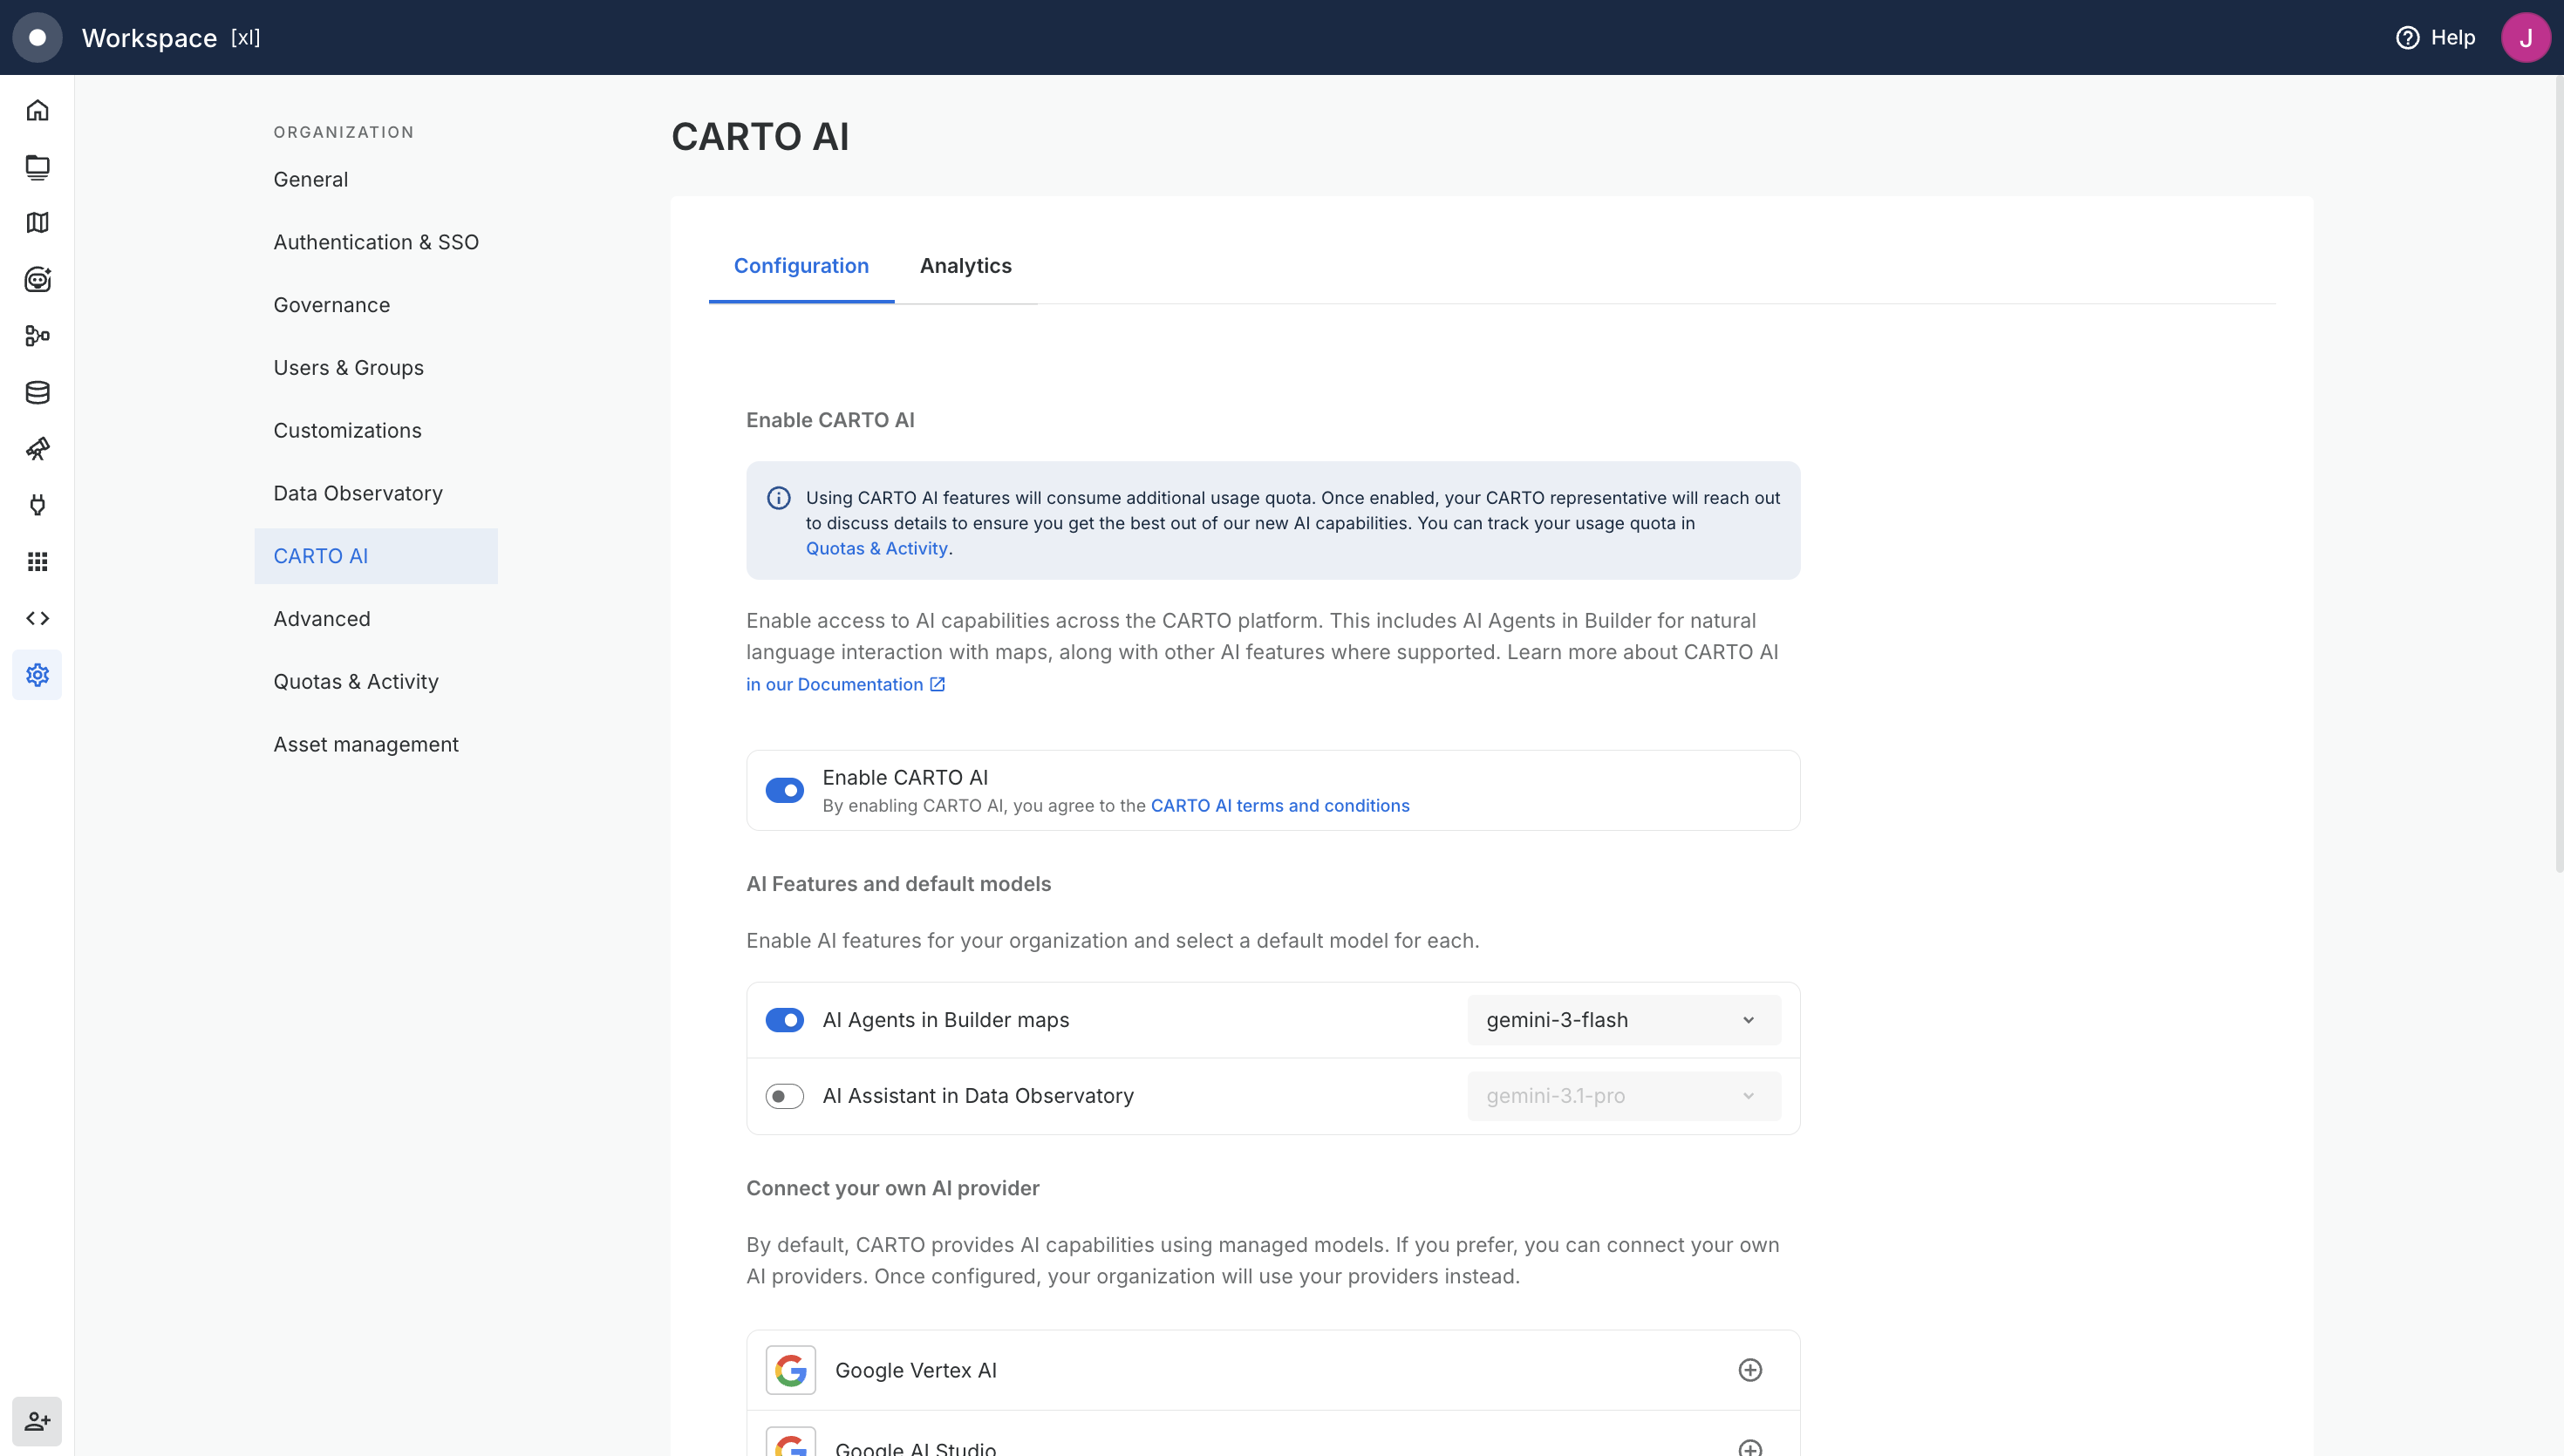
Organization Admins can now control CARTO AI at the feature level from **Settings > CARTO AI**. In addition to the organization-wide **Enable CARTO AI** toggle, each individual AI feature has its own switch and its own default model selector. The granular controls currently cover **AI Agents in Builder maps** and the new **AI Assistant in Data Observatory**, with more features to follow.
The per-feature default model overrides the organization-wide default for that specific feature, so different capabilities can run on different models. Newly introduced features are disabled by default, so Admins need to enable them explicitly before they become available to users.
Learn more in our [CARTO AI settings documentation](/carto-user-manual/settings/carto-ai.md#ai-features).
{% endupdate %}
{% update date="2026-05-21" tags="new,data-observatory" %}
## AI Assistant in Data Observatory
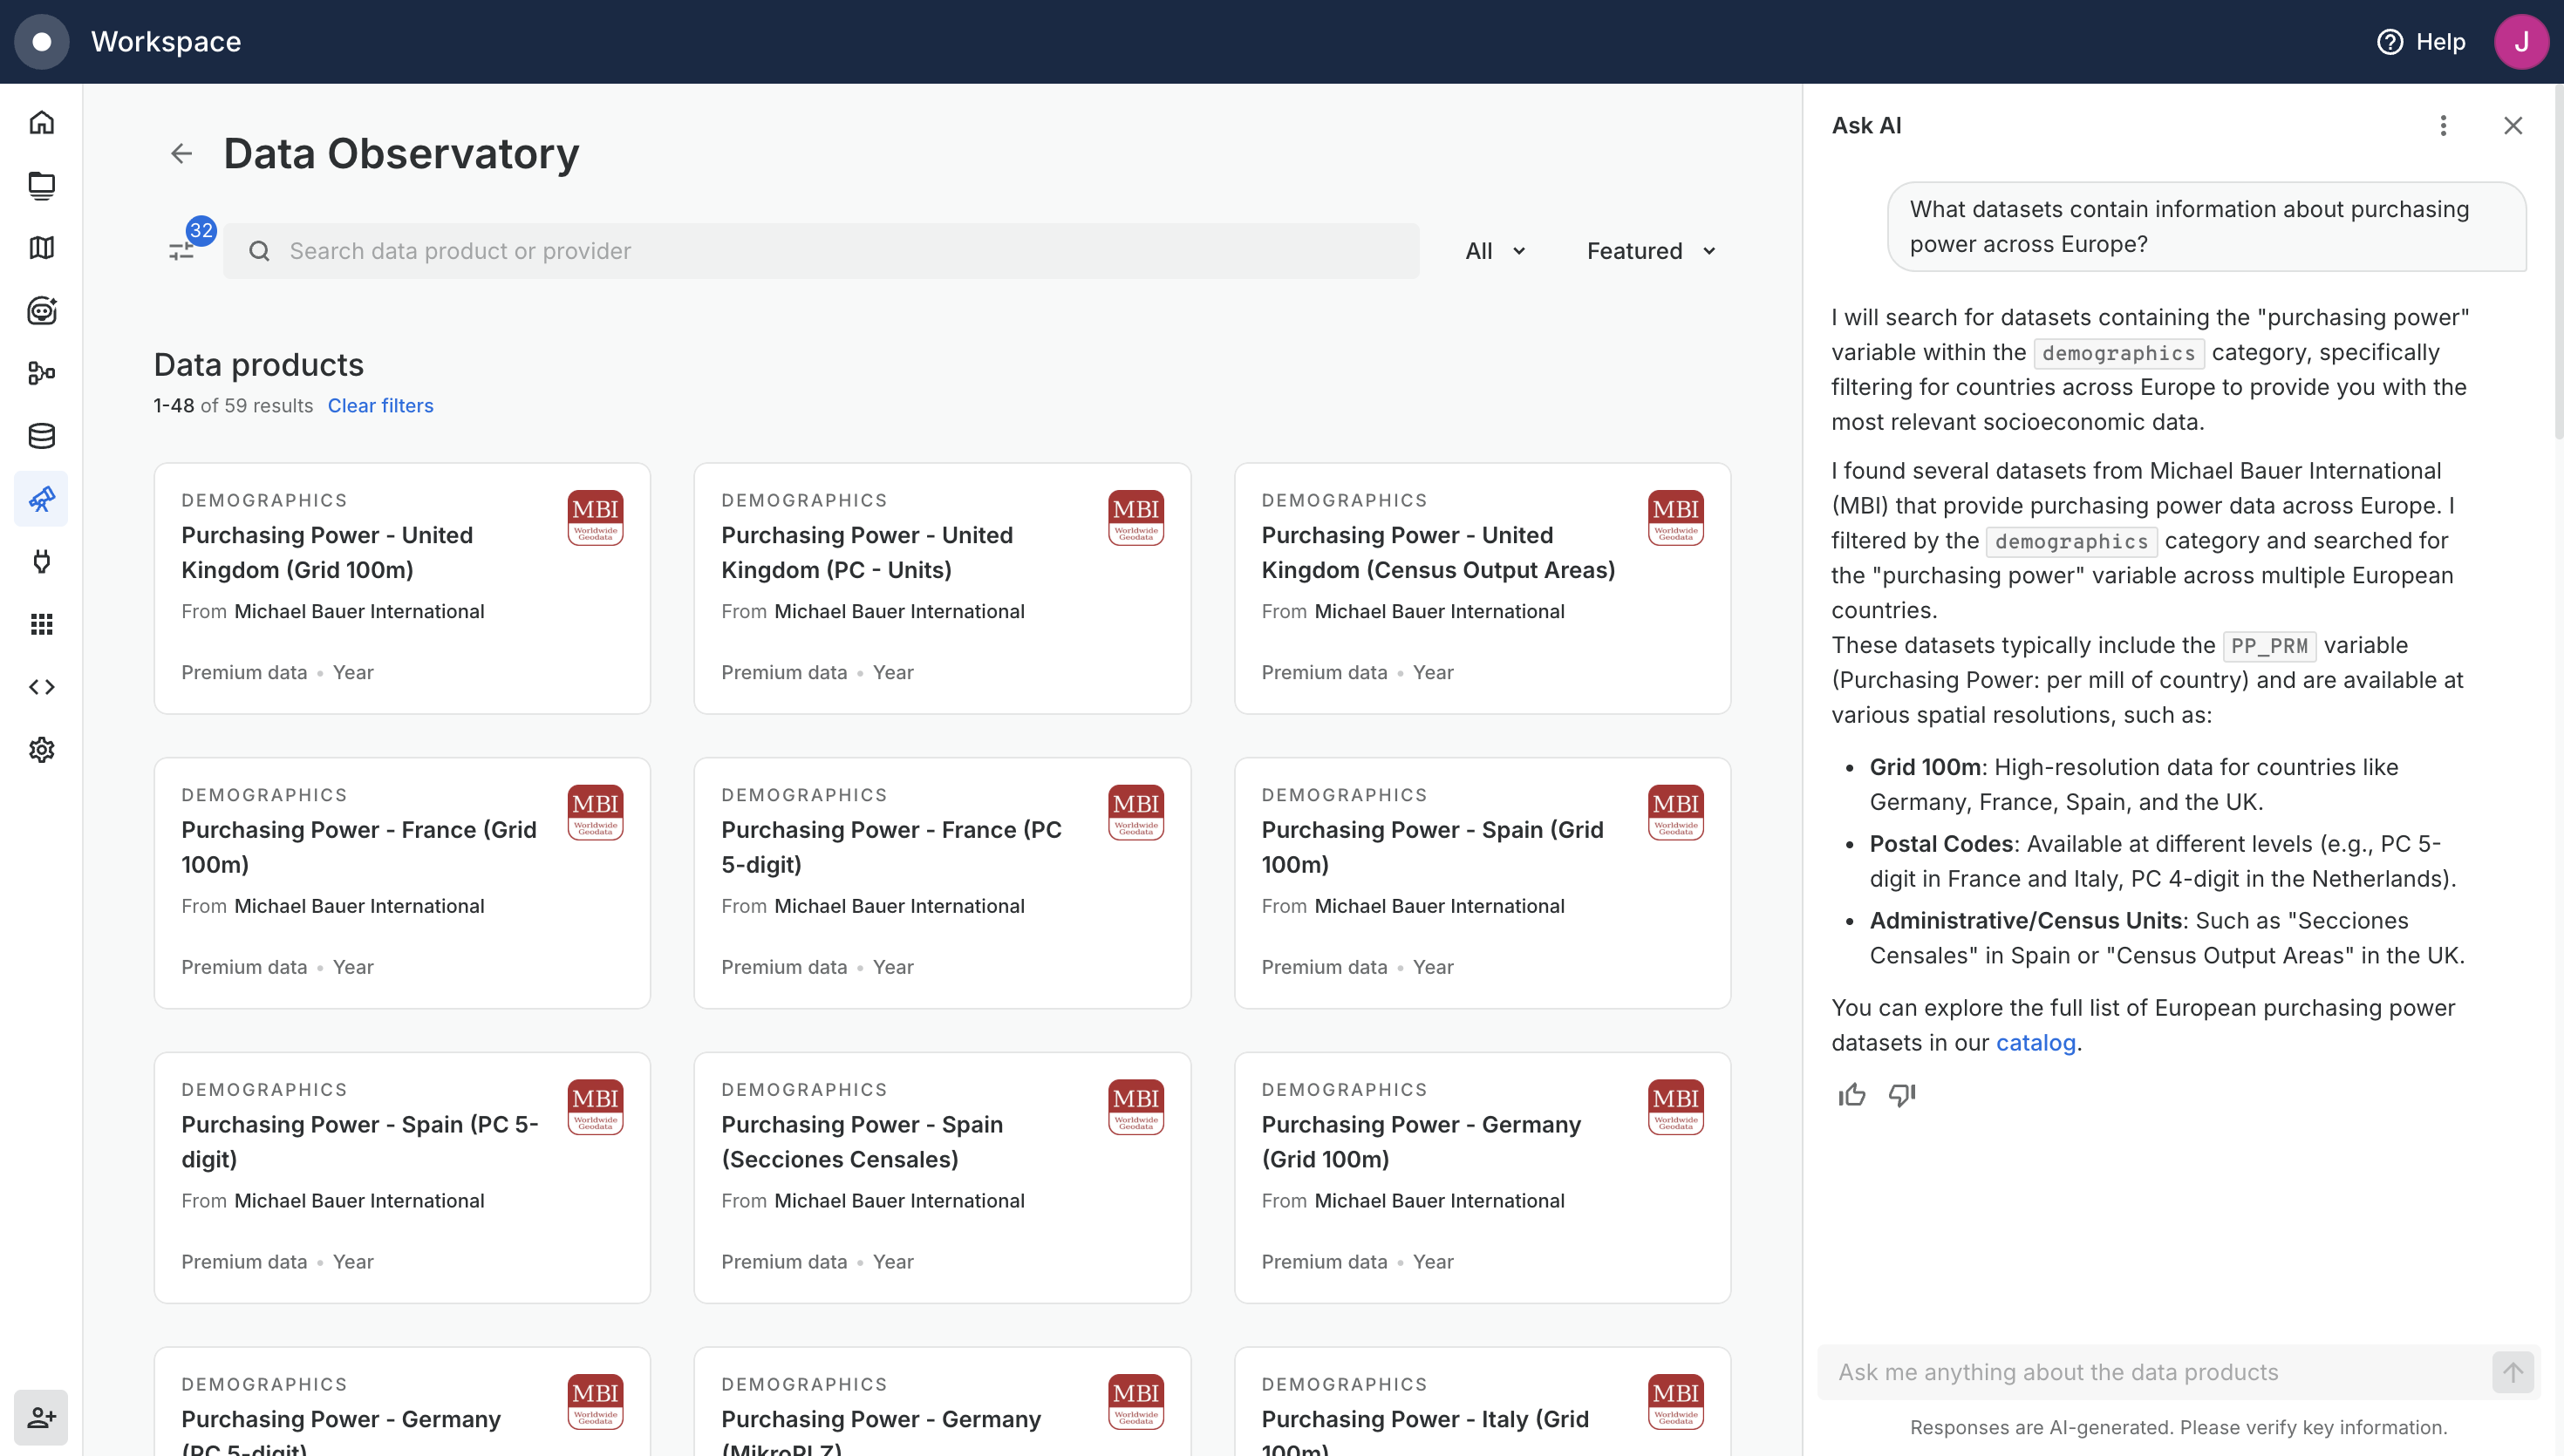
Finding the right dataset in the Spatial Data Catalog now takes a sentence instead of a series of filter clicks. The new **AI Assistant in Data Observatory** lets you describe what you need in natural language and applies the matching filters to the catalog for you.
Open the assistant with the **Ask AI** button at the top of the Data Observatory catalog, ask something like *"What datasets would help analyze consumer purchasing patterns in the UK?"*, and the sidebar will filter the catalog down to the datasets that fit. You can keep iterating in the same conversation to refine the results or change direction, and manual filters remain available at any time.
Learn more in our [Browsing the Spatial Data Catalog documentation](/carto-user-manual/data-observatory/accessing-and-browsing-the-spatial-data-catalog.md#ai-assistant-in-data-observatory).
{% endupdate %}
{% update date="2026-05-19" tags="new,builder" %}
## Custom SQL aggregation expressions in Builder
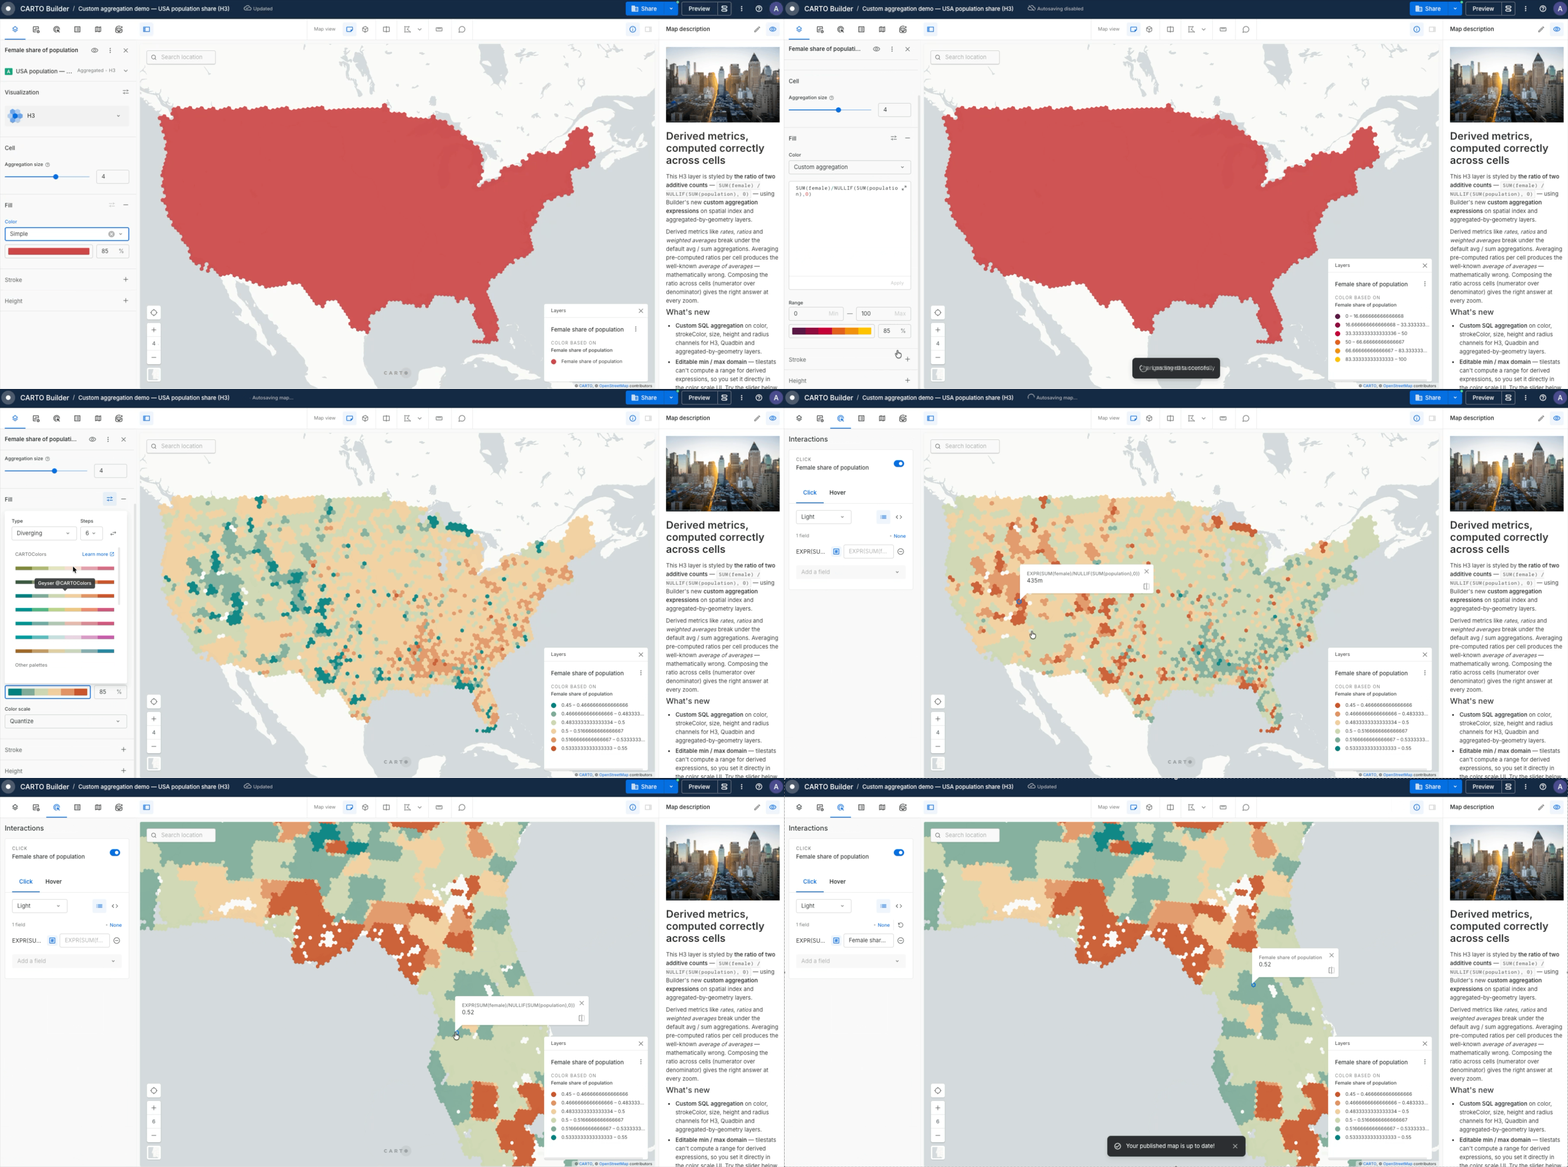
Spatial index layers (H3, Quadbin) and aggregated-by-geometry layers in Builder now support **custom SQL aggregation expressions** for styling and interactions. Apart from the predefined `avg`, `sum`, `min`, `max` set, you can write any aggregation expression that runs on your data warehouse. This is useful for derived metrics like rates, ratios and weighted averages.
```sql
SUM(female) / NULLIF(SUM(population), 0)
```
Learn more in our [H3 layer documentation](/carto-user-manual/maps/layers/h3.md#custom-aggregation-expressions).
{% endupdate %}
{% update date="2026-05-18" tags="improvement,builder" %}
## Scale point radius with zoom in Builder
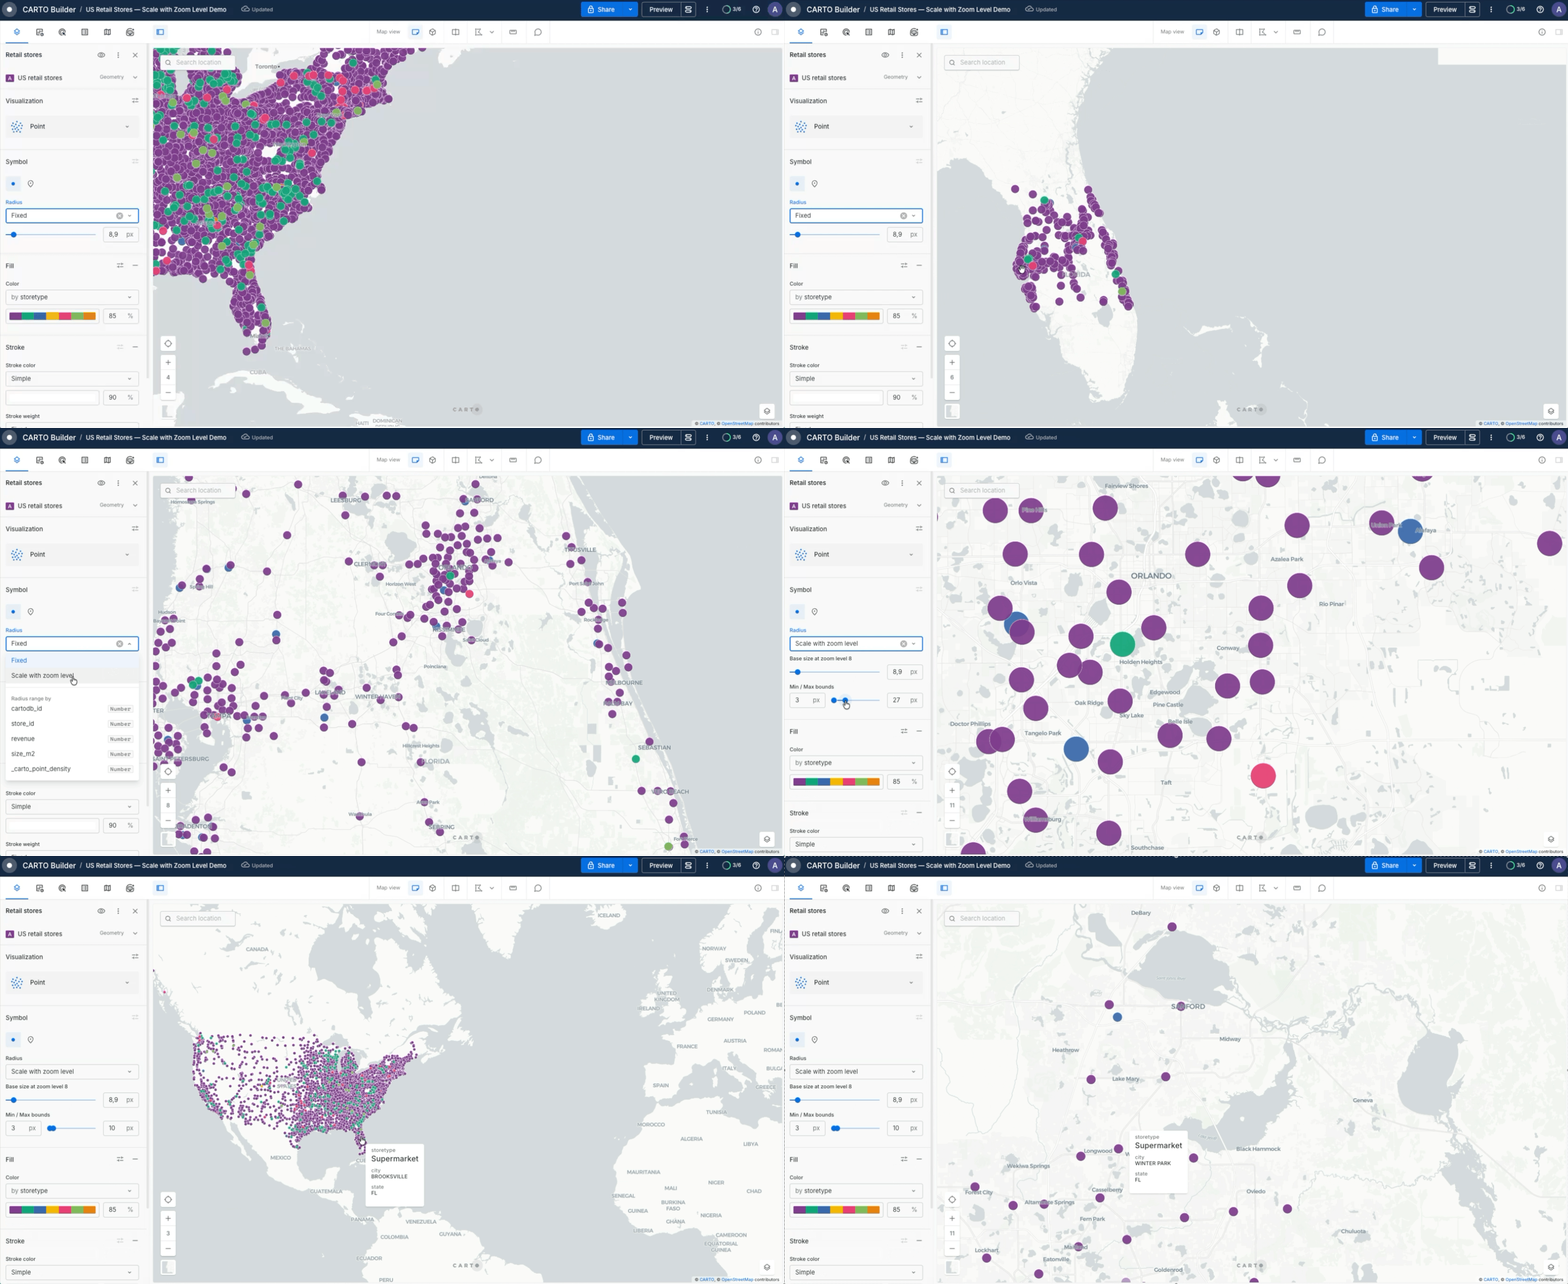
Point layers in Builder now support a new **Scale with zoom level** option for radius. Instead of a fixed pixel size, points grow and shrink with the map zoom, staying visually proportional to context. A **Min / Max bounds** clamp keeps points readable at extreme zooms, and the option applies to both simple points and custom markers.
Learn more in our [Point layer documentation](/carto-user-manual/maps/layers/point.md#scale-with-zoom-level).
{% endupdate %}
{% update date="2026-05-14" tags="new,carto-for-agents" %}
## CARTO for Agents: bring the platform into your AI workflows
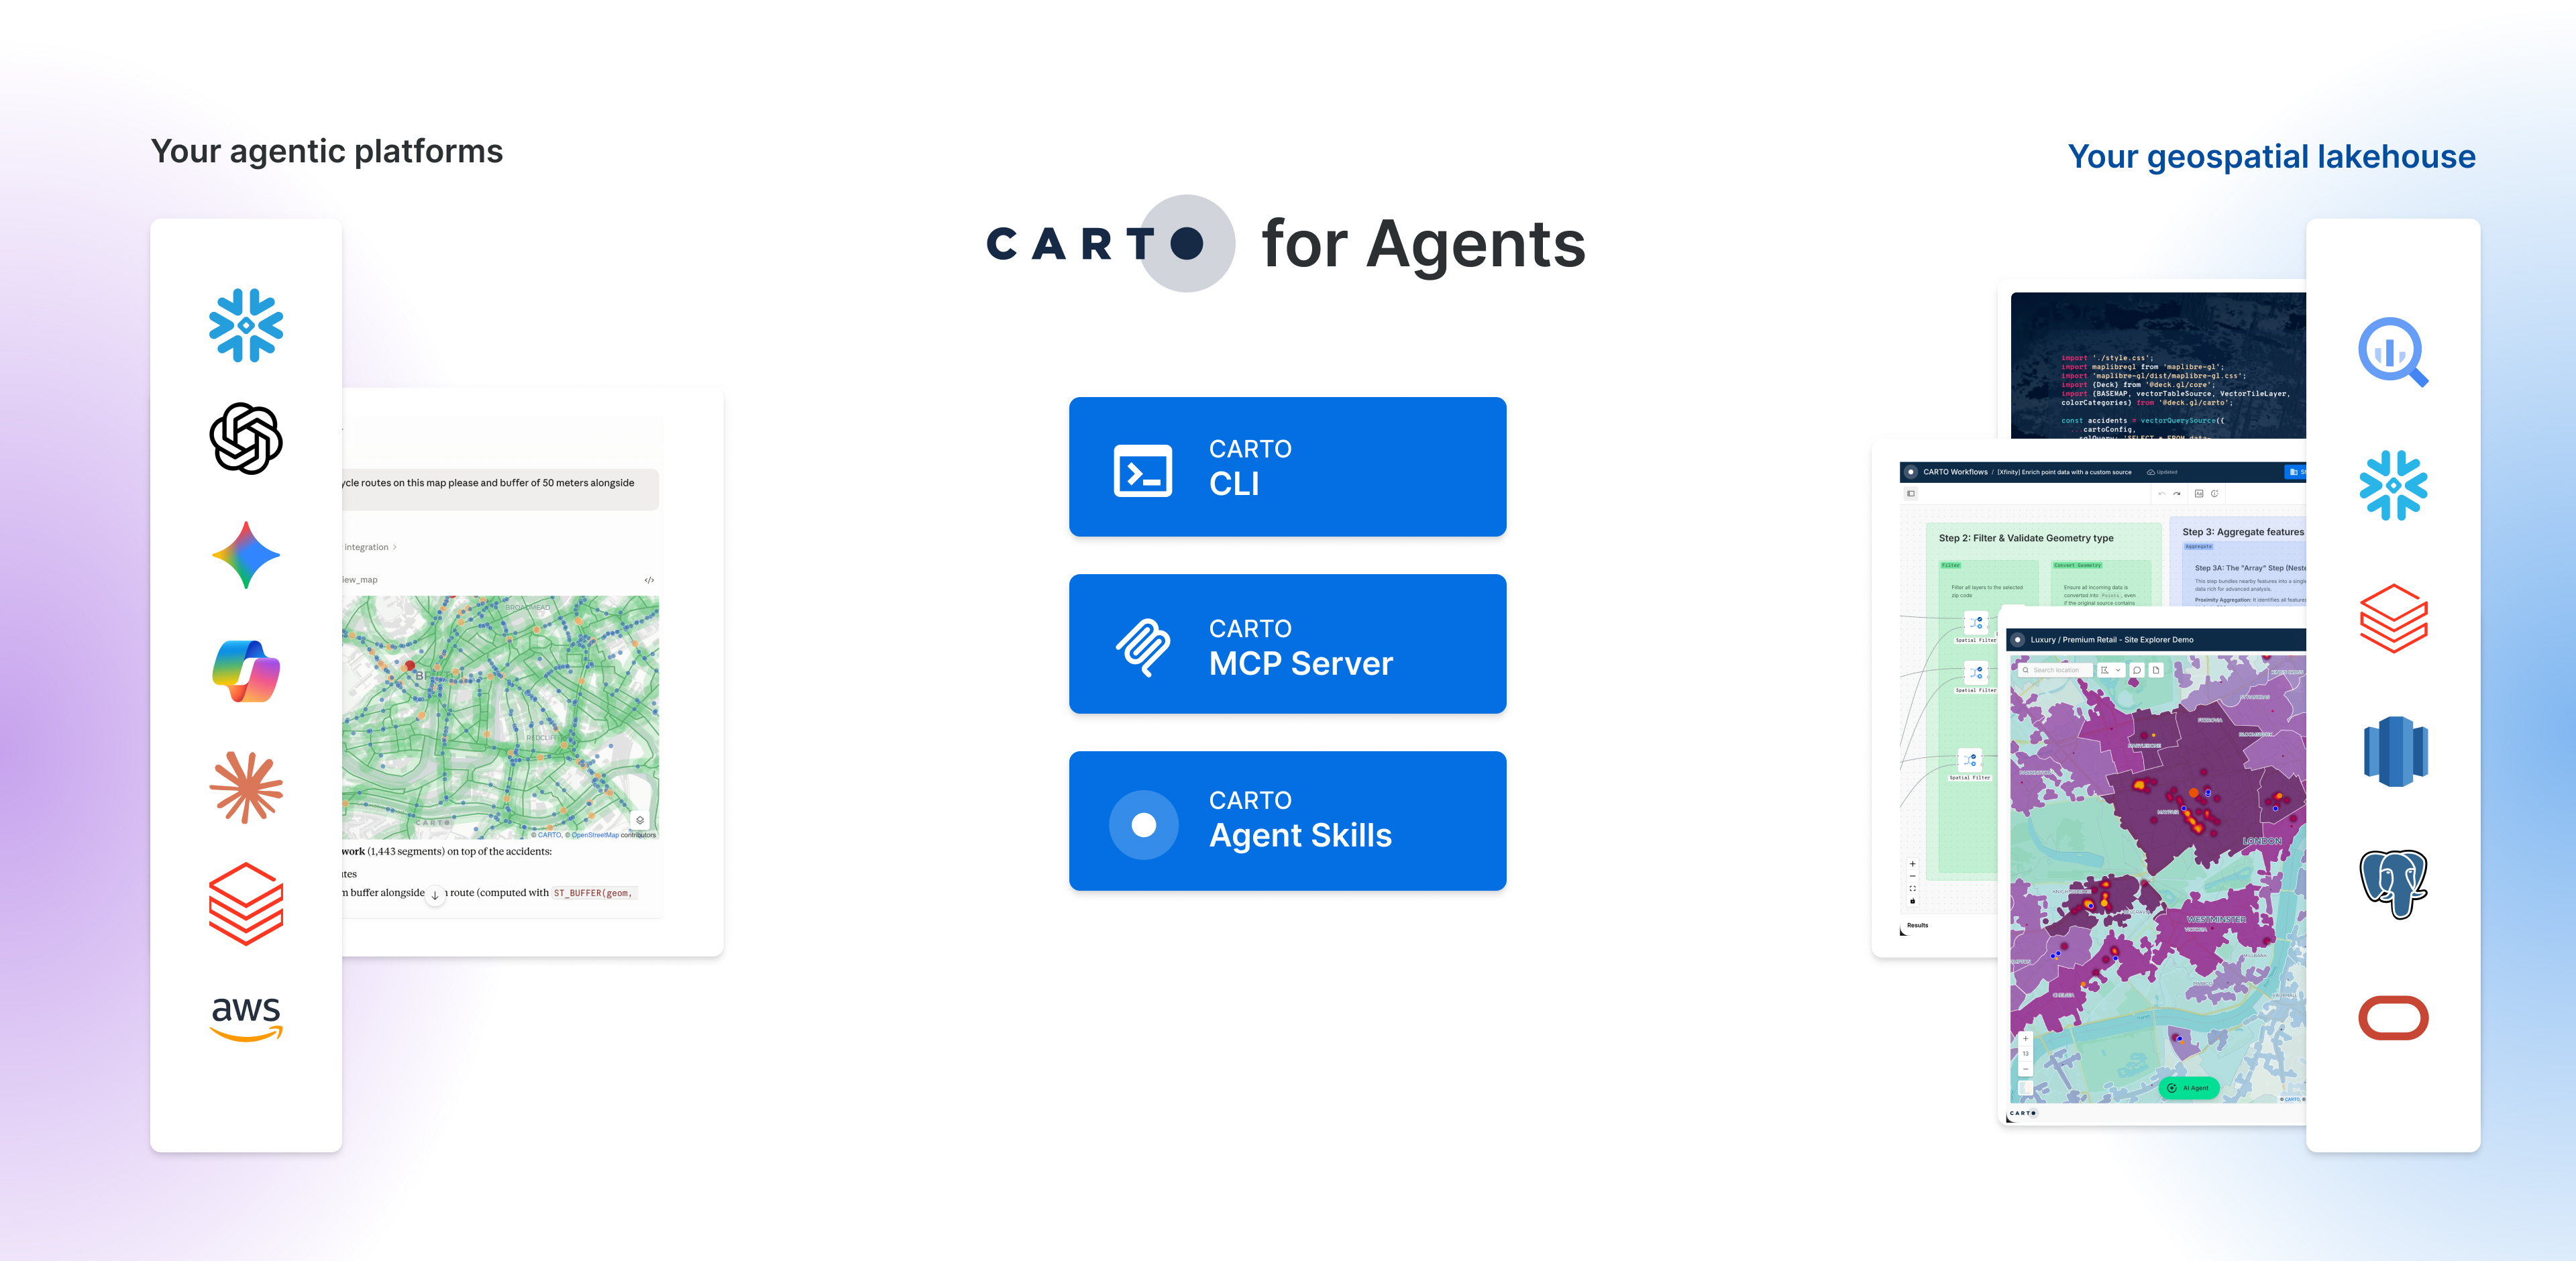
AI agents are quickly becoming part of how teams build with spatial data. We're launching **CARTO for Agents**, three new capabilities that put the entire CARTO platform within reach of the AI agents you already use: authoring Builder maps and Workflows, managing connections, browsing the Data Observatory, running imports and exports, and anything else you do day to day.
* [**CARTO CLI**](/carto-for-agents/cli.md). A script-friendly command-line for the platform that humans run in a terminal and agents call as a tool. The latest release adds first-class Builder map and Workflow authoring from JSON bundles.
* [**CARTO MCP Server**](/carto-for-agents/mcp-server.md). A hosted [Model Context Protocol](https://modelcontextprotocol.io/) server that exposes built-in CARTO tools, plus any workflow you publish, to web and desktop AI clients like Claude.ai, ChatGPT, and Gemini.
* [**CARTO Agent Skills**](/carto-for-agents/agent-skills.md). A public catalog of skill playbooks at [`CartoDB/agent-skills`](https://github.com/CartoDB/agent-skills) that teaches coding agents (Claude Code, Codex, Cursor, Gemini CLI) how to drive CARTO without re-discovering the API every session.
The three pieces work together depending on the scenario. A chat agent in Claude.ai, ChatGPT, or Gemini connects through the MCP Server. A coding agent in Claude Code, Cursor, or Codex combines the CLI with the Agent Skills, which teach it the right flags and patterns for each task. Learn more in our [CARTO for Agents documentation](/carto-for-agents/carto-for-agents.md).
{% endupdate %}
{% update date="2026-05-14" tags="new,workspace" %}
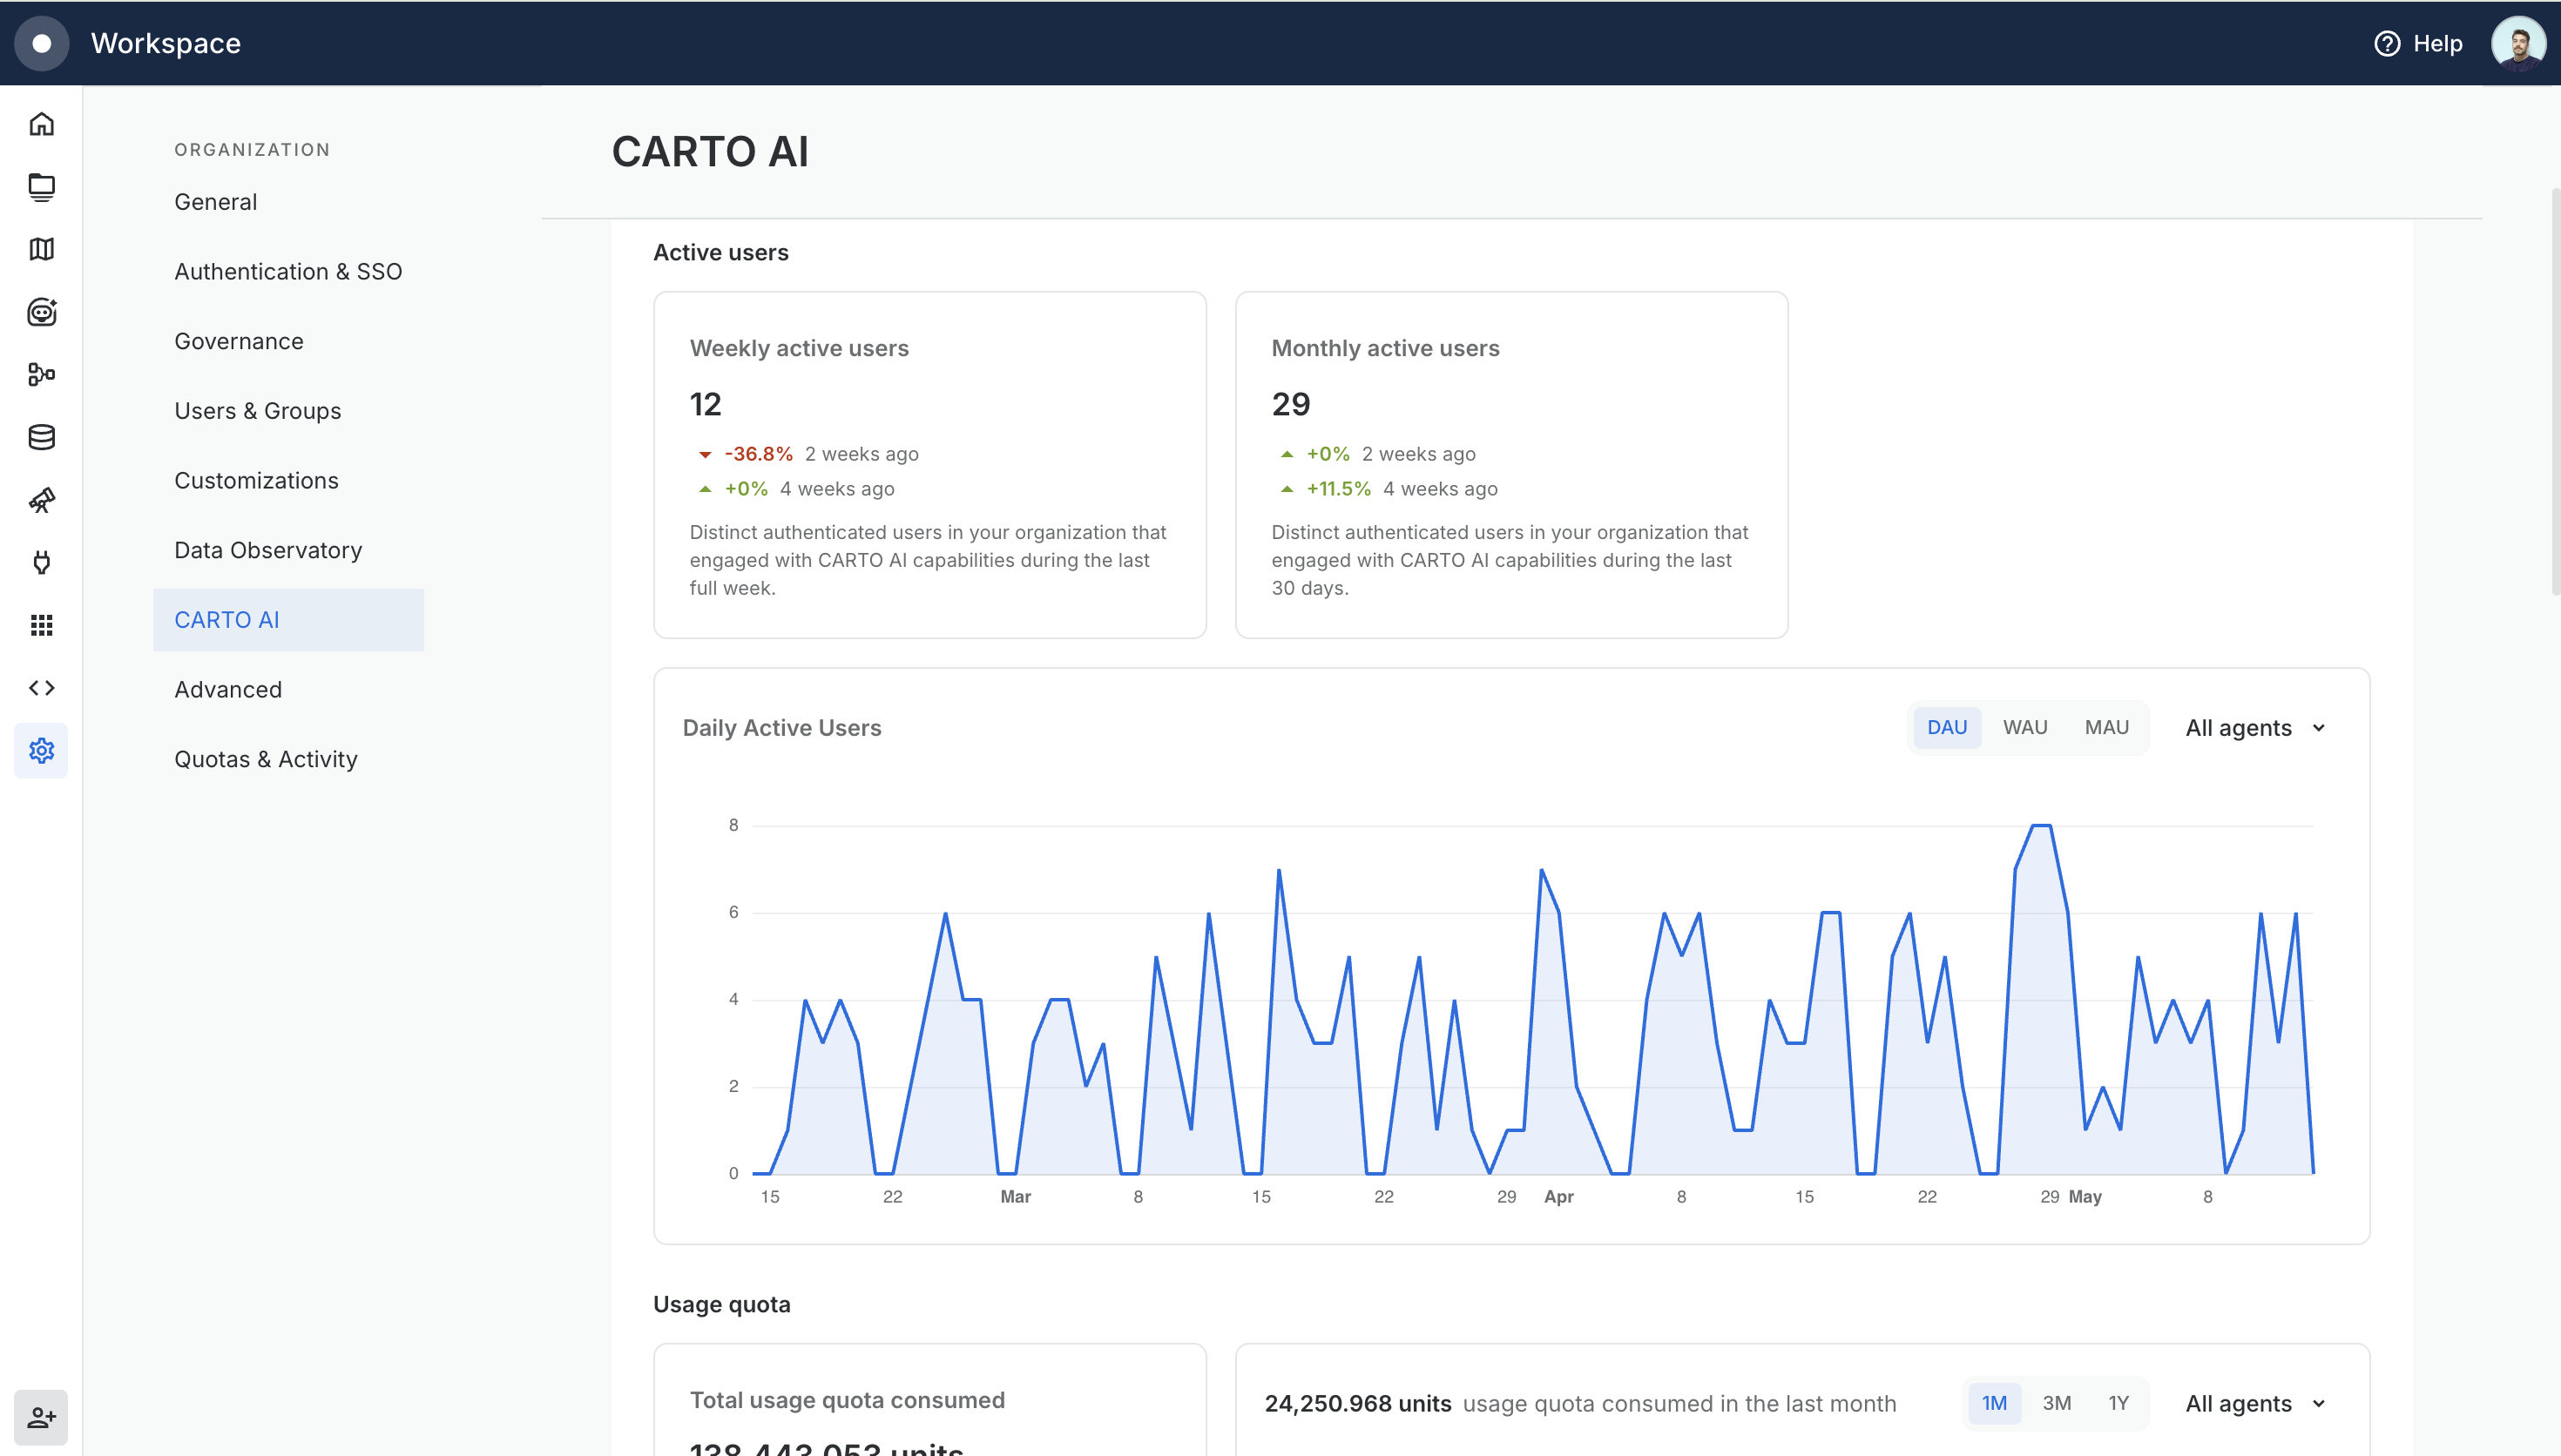
## CARTO AI Analytics for organization Admins
Organization Admins now have a dedicated **Analytics** tab in Settings > CARTO AI to see how CARTO AI is being used across the organization. The tab is split into three views: **All activity** with active users and consumption of your AI and agentic usage quotas, **CARTO Agents** with activity from AI Agents created in Builder, and **External Agents** with activity driven from external clients consuming CARTO through the MCP Server and the CARTO CLI.
Learn more in our [CARTO AI Analytics documentation](/carto-user-manual/settings/carto-ai/carto-ai-analytics.md).
{% endupdate %}
{% update date="2026-05-14" tags="new,workspace" %}
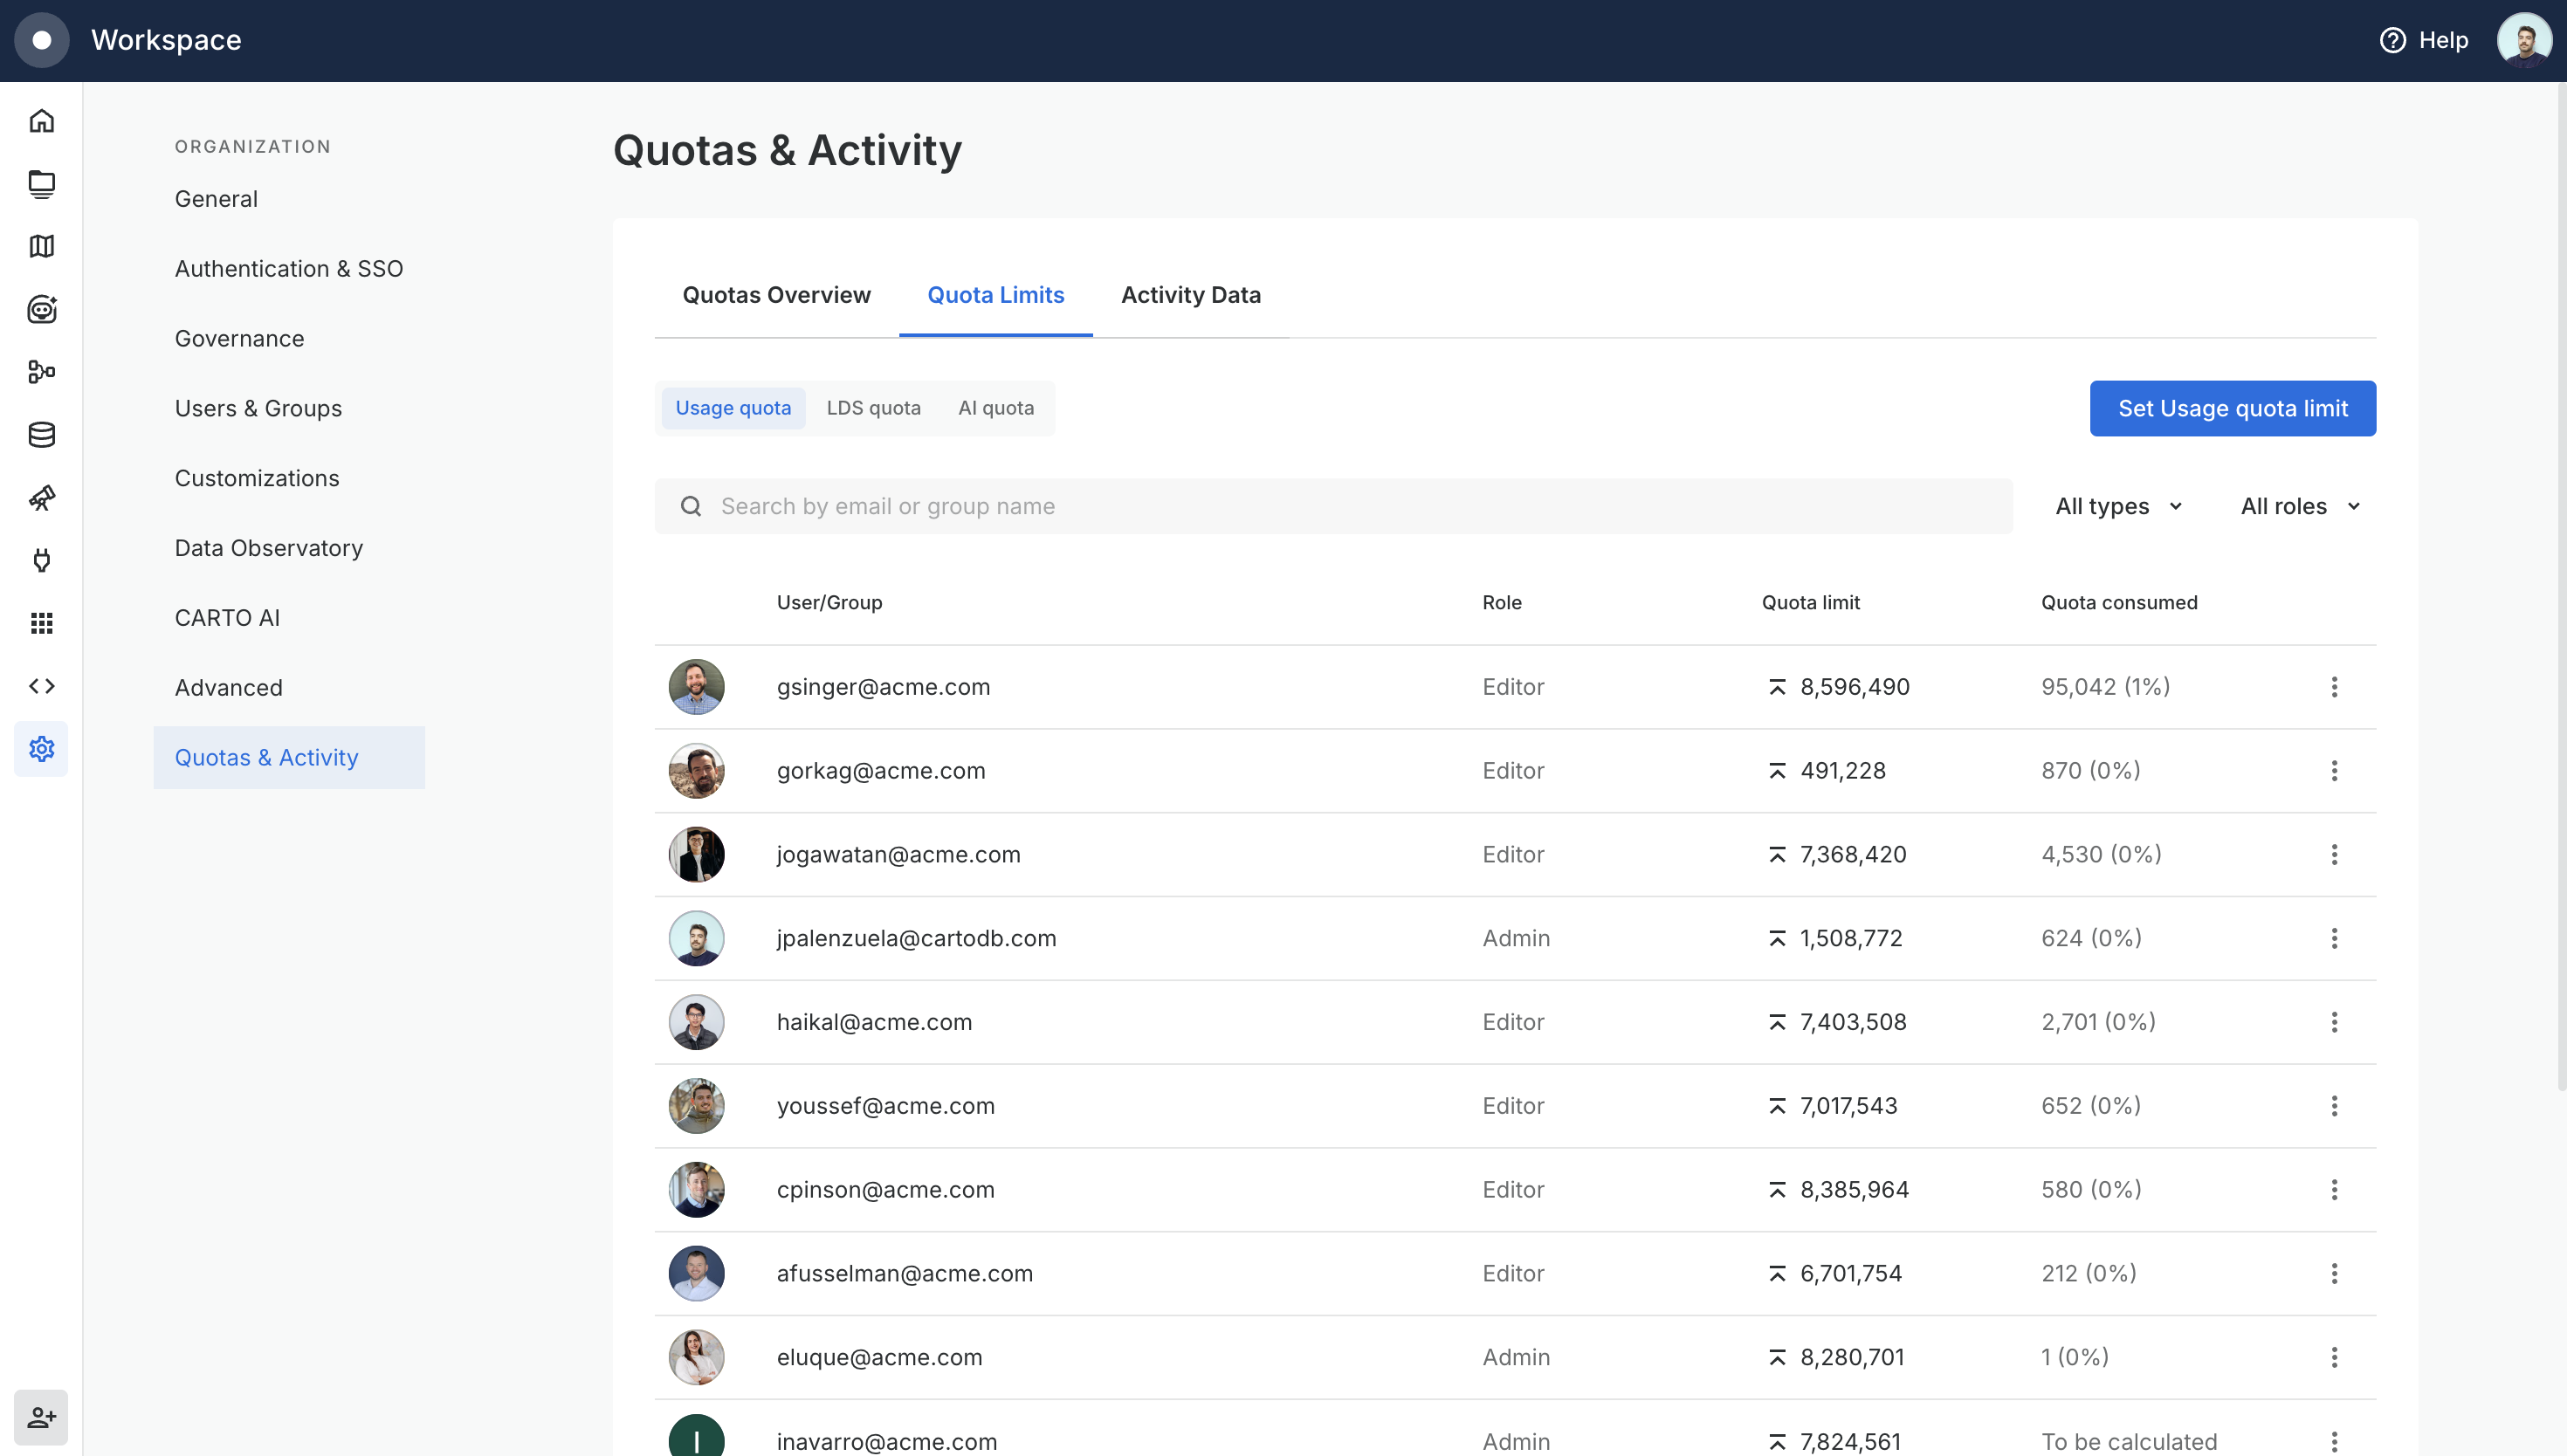
## Quota controls for organization Admins
Organization Admins can now cap how much of each quota a specific user or group is allowed to consume, directly from **Settings > Quotas & Activity > Quota Limits**. Limits can be set for the Usage quota, the Location Data Services quota, and the AI quota, and they are hard limits: once a user or group reaches the limit, they are blocked from consuming more of that quota until an Admin raises or removes the limit.
Learn more in our [Managing quotas documentation](/carto-user-manual/settings/quotas-and-rate-limits/managing-quotas.md).
{% endupdate %}
{% update date="2026-05-08" tags="new,builder" %}
## Google Photorealistic 3D Tiles in Builder
Bring your maps to life with our new CARTO Builder basemap option: **Google Photorealistic 3D Tiles**. This high-fidelity representation of the world built from aerial and satellite imagery lets you explore your data on top of detailed 3D buildings and terrain.
Your data will automatically cover the surface of buildings and other 3D terrain features, allowing you to understand the data in real-world context. This can be incredibly useful for urban planning, real estate or insurance use cases.
Google Photorealistic 3D Tiles span over **2,500 cities across 49 countries.** See Google's [Photorealistic 3D Tiles coverage](https://developers.google.com/maps/documentation/tile/3d-tiles-overview) for the latest list of supported areas.
Ready to try it? Learn more in our [Basemaps documentation](/carto-user-manual/maps/basemaps.md).
{% endupdate %}
{% update date="2026-04-20" tags="improvement,builder" %}
## Reorder categorical legend entries in Builder
Categorical and ordinal legend entries can now be reordered in Builder to improve map readability. Categories can be sorted by frequency or alphabetically, in ascending or descending order.\
\
Reordering only affects the legend’s reading order, colors remain fixed to each category, so the map visualization does not change.
Learn more in our [Legend documentation](/carto-user-manual/maps/legend.md).
{% endupdate %}
{% update date="2026-04-15" tags="improvement,builder" %}
## Click interactions now show every overlapping feature
Click interactions in Builder now paginate across every feature at clicked location, in both pop-up and info panel modes. When overlapping polygons, overlapping lines, or multiple records sharing the same geometry sit at the same spot, you can step through all of them within a layer instead of only seeing the top one.\
\
Previously, clicking a stacked location surfaced only a single feature and the rest were unreachable without zooming in or filtering the data. The new prev/next controls let you browse all of them, with the map highlighting updating as you paginate.
Learn more in our [Click interactions documentation](/carto-user-manual/maps/interactions.md#click-type-interactions).
{% endupdate %}
{% endupdates %}
---
# Agent Instructions
This documentation is published with GitBook. GitBook is the documentation platform designed so that both humans and AI agents can read, navigate, and reason over technical content effectively. Learn more at gitbook.com.
## Querying This Documentation
If you need additional information that is not directly available in this page, you can query the documentation by asking a question.
Perform an HTTP GET request on the following URL with the `ask` and `goal` query parameters:
```
GET https://docs.carto.com/whats-new/q2-2026.md?ask=&goal=
```
`ask` is the immediate question: it should be specific, self-contained, and written in natural language.
`goal` is what the user is ultimately trying to achieve, the reason they need the answer. Sharing it helps GitBook give you a better, more relevant answer. A goal is most helpful when it describes the outcome the user wants rather than restating the question. For example, with `ask=how do I create an API token`, a goal like `automate deployments from our CI pipeline` lets GitBook tailor the answer to that use case.
The response will contain a direct answer to the question and relevant excerpts and sources from the documentation.
Use this mechanism when the answer is not explicitly present in the current page, you need clarification or additional context, or you want to retrieve related documentation sections.